Keywords
T cell receptor excision circle, thymic function, stem cell transplantation
T cell receptor excision circle, thymic function, stem cell transplantation
Although a hematopoietic stem cell transplant (HSCT) is an effective treatment for several types of malignant blood diseases, it can cause a number of different side effects, mainly related to opportunistic infections and graft versus host disease (GVHD). The immediate post-transplant period is followed by severe immunodeficiency resulting in persistent susceptibility to infection1–5. Even more prolonged immunodeficiency arises from inadequacy in effective CD4+ T-cell and B cell reconstitution6–9. Regeneration of adequate T-cell numbers and repertoire are key elements in the recovery of immunity, required for protection against infection10.
Post-transplant T-cells are derived from mature T-cells present in the donor graft, and T-cells developing de novo in the recipient from donor stem cells. It is likely that the latter pathway of differentiation leads to long-term immune reconstitution11,12. It has been suggested that the reconstitution and maintenance of effective T-cell immunity after HSCT is dependent on education about T-cell precursors in the thymus, as shown by the correlation between increased thymic output and an increment in naïve T-cells, and broader TCR repertoires after transplantation13–15. Factors that can delay thymic function include age, cell source, histocompatibility leukocyte antigen mismatches, GVHD and direct thymic damage from chemoradiotherapy11,16–19.
The production of a functional T-cell receptor requires the deletion of the TCRδ gene, which is positioned within the TCRα- locus20. The deleted TCRδ-genes remain present as extrachromosomal circular products called signal joints T-cell receptor excision circles (sjTRECs). These products are stable21, are not duplicated during mitosis, and are therefore diluted with each cellular division22. Thus, sjTRECs are markers of developmental proximity to the thymus, and their concentrations in peripheral blood can be used to estimate thymic output and evaluate thymic function in patients after stem cell transplantation23.
It has been reported that TREC levels correlate to post-transplant outcomes18,24,25. Several factors affecting thymic output have been suggested, but there is still some controversy11,26–28. Herein we tested whether pre-transplant thymic function, assessed by the quantification of TRECs in the peripheral blood, may predict a prognosis in the setting of HLA-identical HSCT with a large prevalence of high risk disease. Furthermore, we also assessed TREC levels before and during acute GVHD.
Over a consecutive 54-month period, 62 allogeneic stem cell transplant recipients from the UNIFESP (Bone Marrow Transplant Unit of Sao Paulo Hospital and Pediatric Bone Marrow Transplant Unit of the Pediatric Institute of Oncology) and Santa Marcelina Hospital, Brazil, between 2003 and 2007, were included. The group was comprised of children and adults who received a myeloablative preparative regimen and unmanipulated bone marrow or peripheral blood stem cell graft from an HLA-matched related donor. Patients submitted a stem cell transplant with a T-cell depleted graft and children with severe combined immunodeficiency were excluded. The risk of disease was classified based on the International Bone Marrow Transplant Register criteria (www.cibmtr.org). Patients’ characteristics, treatment and complications after transplantation are summarized in Table 1. This study was approved by the Institutional Medical Ethics Committee (number CEP 0532/02) and all patients or guardians gave informed consent before their enrollment.
GVHD prophylaxis consisted predominantly of cyclosporine or cyclosporine and short course methotrexate. Cyclosporine levels were monitored weekly and kept at the therapeutic range of 150-300 ng/dl during the first 60 days, and then the drug dose was continuously tapered through the next 180 days, until a complete suspension, depending on disease status at the time of transplantation and the presence or absence of GVHD. Antibacterial, antifungical and antiviral prophylaxis consisted of 160mg of trimethoprim-sulfamethoxazol 3 times/week on alternative days for Pneumocistis jiroveci, fluconazole 150mg once/day for fungical prophylaxis and acyclovir 400mg twice/day or valcyclovir 500mg twice/day for Herpes simplex Surveillance cytomegalovirus (CMV) antigenemia testing was performed for all patients. Diagnosis and clinical grading of acute and chronic GVHD were performed according to established criteria29–31. Bacterial, cytomegalovirus and fungical infection, sepsis and septic shock were defined according to previously established criteria32–34.
Buffy coat samples were obtained and frozen before the conditioning regimen for the 62 patients. Thirty-one patients developed acute GVHD, and we were able to collect samples within 2 weeks before acute GVHD, and in ongoing GVHD from 16 of these patients. A control group was composed of 27 healthy donors from whom peripheral blood or bone marrow was collected before G-CSF stimulation.
Sixty-two patients received a myeloablative conditioning regimen followed by allogeneic HCT (Table 1). During the follow-up period of 18 months, among all patients, there were 14 severe bacterial infections, 22 CMV infections, six relapses and three fungical infections. Acute GVHD (aGVHD) occurred in 31 patients, and the incidence of grade I, II and III-IV was 13%, 18% and 19%, respectively. Among the 52(83.8%) who survived for at least 100 days after transplantation, 34(65%) developed chronic GVHD (cGVHD). As the number of relapses and fungal infection were low in our cohort, we focused the analysis on overall survival and occurrence of GVHD and severe bacterial infections.
To perform the TREC assay, total DNA was extracted from buffy-coat by the DTAB/CTAB method (dodecyl trimethyl-ammonium bromide/cetyl trimethyl-ammonium bromide)35, and DNA concentrations were adjusted to 100ng/ul. One μl of DNA was used in all reactions. Delta deletion sjTRECs formed by δREC- ψJα rearrangement were amplified and quantified using SYBR-Green PCR Master Mix and an ABI 7000 instrument (Applied Biosystems, Foster City, CA). The standard curve was generated as previously described36. Primers for sjTRECs were: forward primer (5’CATCCCTTTCAACCATGC’3) and reverse primer (5’CGTGCCTAAACCCTGCAGC’3), which produced an approximately 102 base-pair product. To improve TREC detection, two steps of amplification were performed. The first PCR conditions were: 50°C for 2 minutes and 95°C for 10 minutes, followed by 10 cycles of 95°C for 15 seconds and 63°C for 1 minute. Afterwards, 1ul was utilized in second-step amplification. The second PCR conditions were: 95°C for 10 minutes followed by 40 cycles of 95°C for 15 seconds and 63°C for 1 minute. TREC values obtained by RT-PCR were normalized by the proportion of lymphocytes in the blood cell count. This count was performed in the same peripheral blood sample that was utilized for DNA isolation. All DNA samples were amplified in triplicate and universal PCR precautions were taken to avoid amplicon contaminations along with negative control reactions.
A receiver-operating-characteristic (ROC) curve was used to obtain the most discriminating overall survival cut-off for TREC values. Correlation between Gaussian distribution variables was calculated with Spearman correlation. Survival analysis was calculated using Kaplan-Meier plot and log rank test. Cumulative incidence analysis was calculated using death as a competing event for infections, acute or chronic GVHD. Cox proportional hazard model analysis was used to identify independent risk factors for death, infection, and acute or chronic GVHD, reviewed in the context of hematopoietic cell transplantation37. The variables included in the model were those that were marginally significant, p-value ≤ 0.10, in the univariate analyses. Non-parametric (Wilcoxon and Mann-Whitney) tests were utilized to compare TREC levels between patients with high and low disease risk, and before and during ongoing acute GVHD. All p values were two tailed and a value <0.05 was considered to indicate statistical significance. The analysis was done using the SPSS v10.0 Statistical Software (Chicago, Illinois, 1992).
Because we used a modified assay for TREC detection, we first wanted to confirm that it gives similar results to previous studies38,39. To this end, we analyzed the relationship between TREC levels and age and, as expected, observed a highly significant negative correlation in healthy control individuals as well as in patients before transplantation (r=-0.46 and r=-0.70, respectively; p≤0.0001).
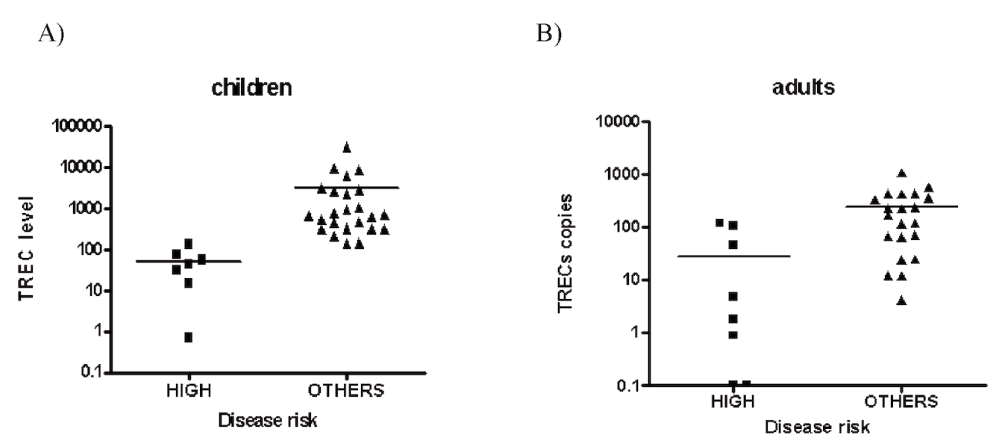
Although the pre-transplant TREC levels have been previously associated with post-transplant prognosis24, we sought to repeat this analysis in our population of patients because it had a much bigger proportion of malignant high-risk diseases (27% vs 1% in 24). Indeed, we observed higher levels of TRECs in patients with no high-risk disease (nonmalignant, low and intermediate risk) compared to high-risk disease patients in both adult and children populations (p<0.001, Figure 1A and Figure 1B), thus making critical the inclusion of this factor in further analysis.

A) Comparison of TRECs levels between high-risk disease (n=7) and others (nonmalignant, low and intermediated risk disease; n=24) in children before stem cell transplantation (p<.001). B) Comparison of TRECs levels between high risk disease (n=10) and others (nonmalignant, low and intermediated risk disease; n=21) and in adults before stem cell transplantation (p<.001).
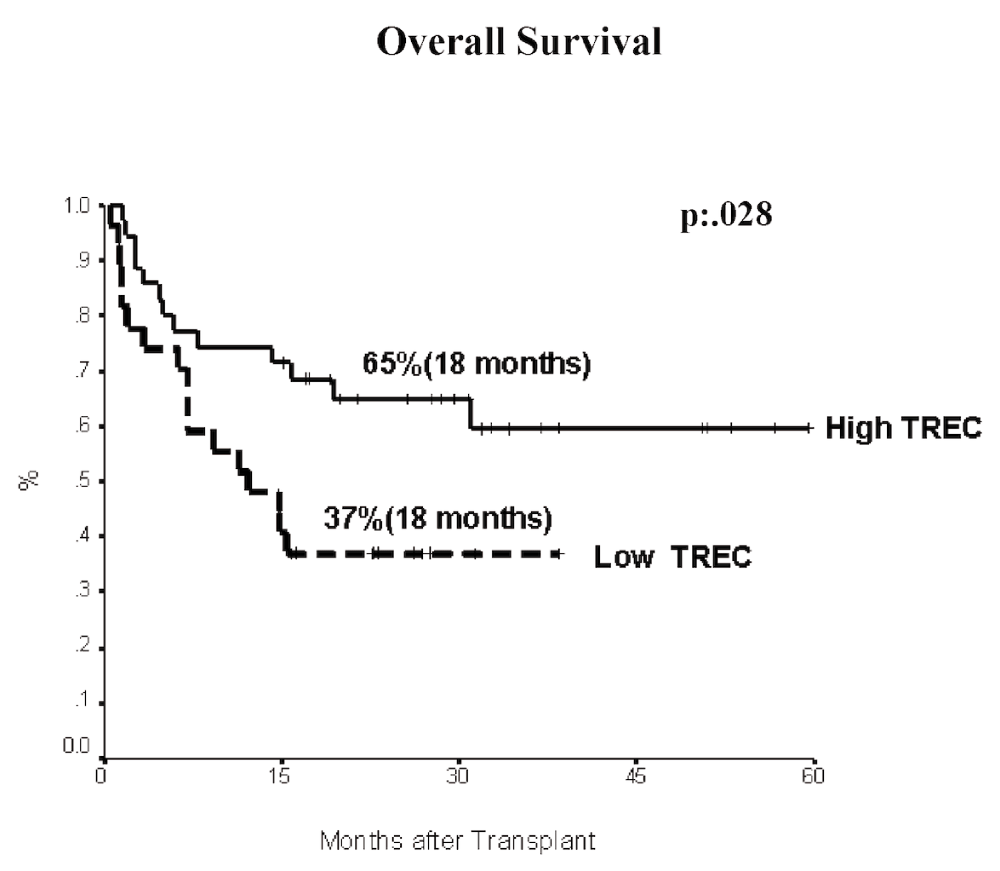
Using the receiver-operating-characteristic (ROC) curve, we found a cut-off value of 134 TREC/µg of lymphocyte DNA that discriminated between patients that survived or not for at least 6 months after transplantation (65% of sensitivity and 60% of specificity). Based on this cut-off, patients were divided into “high” and “low” TREC groups. We observed higher survival in “high” TREC group (p=0.028) (Figure 2) with almost twice the survivors in the “high” TREC group vs the “low” TREC group at 18 months after transplantation (65% vs. 37%, respectively). Applying a multivariate analysis including TREC level, cell source (peripheral blood), recipient age (>25 years), ABO incompatibility, sex mismatch, and high risk disease, we found that worse survival was independently associated (p<0.05) to low TREC values before transplantation (RR: 2.6) and high risk disease (RR: 2.2) (Table 2).

Patients with high TREC (n=35) are shown as a solid line, while the patients with low TREC (n=27) are plotted as a dashed line. Log rank p=.028.
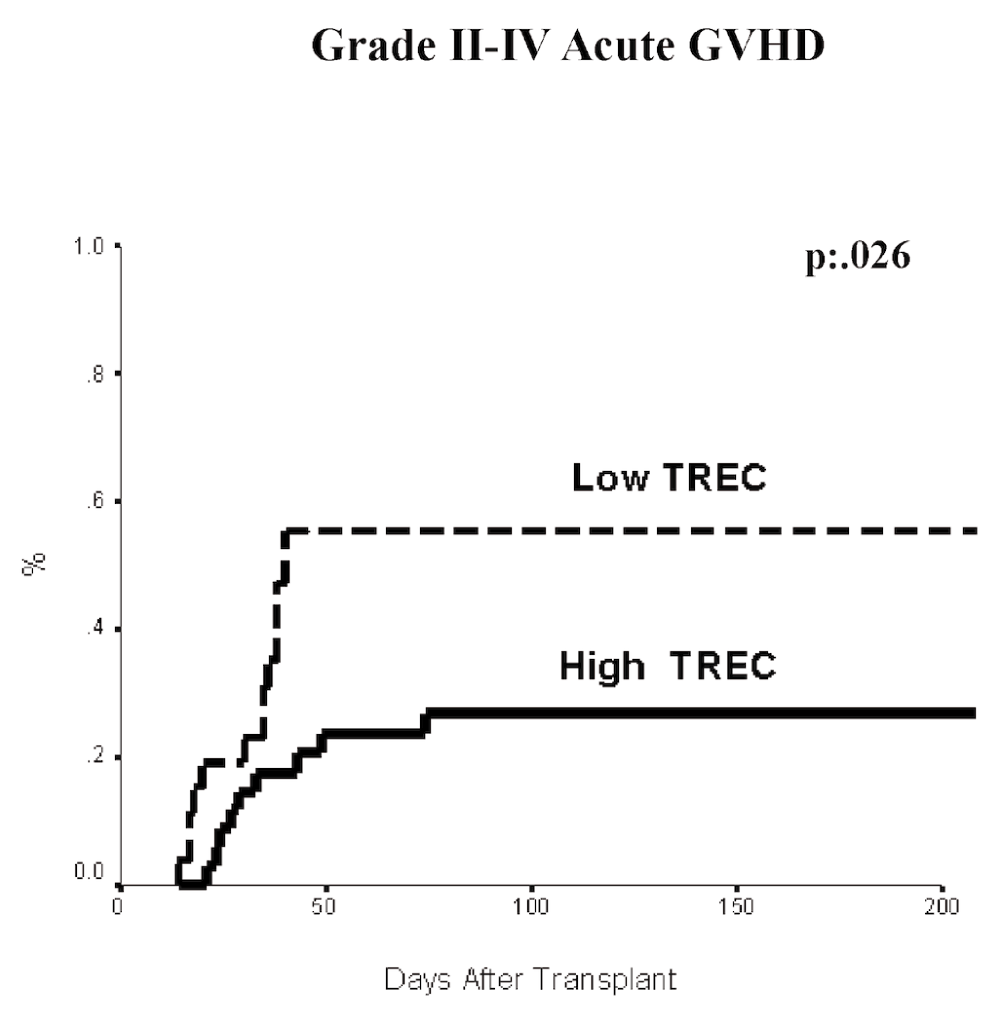
We also observed a higher incidence of grades II-IV aGVHD (Figure 3) among low TREC patients (p=0.02), with the incidence of aGVHD grade II-IV in high and low TREC groups of 25.7% and 57.8%, respectively. Multivariate analysis showed that low TREC levels (RR 2.5, p<0.03) and the antecedent of high risk disease (RR: 5.2 p<0.025) were independently associated with an increased incidence of aGVHD grades II-IV (Table 2).

Patients with high TREC are shown as a solid line, while the patients with low TREC are plotted as a dashed line. Log rank p=.026.
Although we did not find an association between TREC levels and cGVHD, the expected associations of cGVHD with age40–42 and source of cells for transplant43–45 were detected (Table 2).
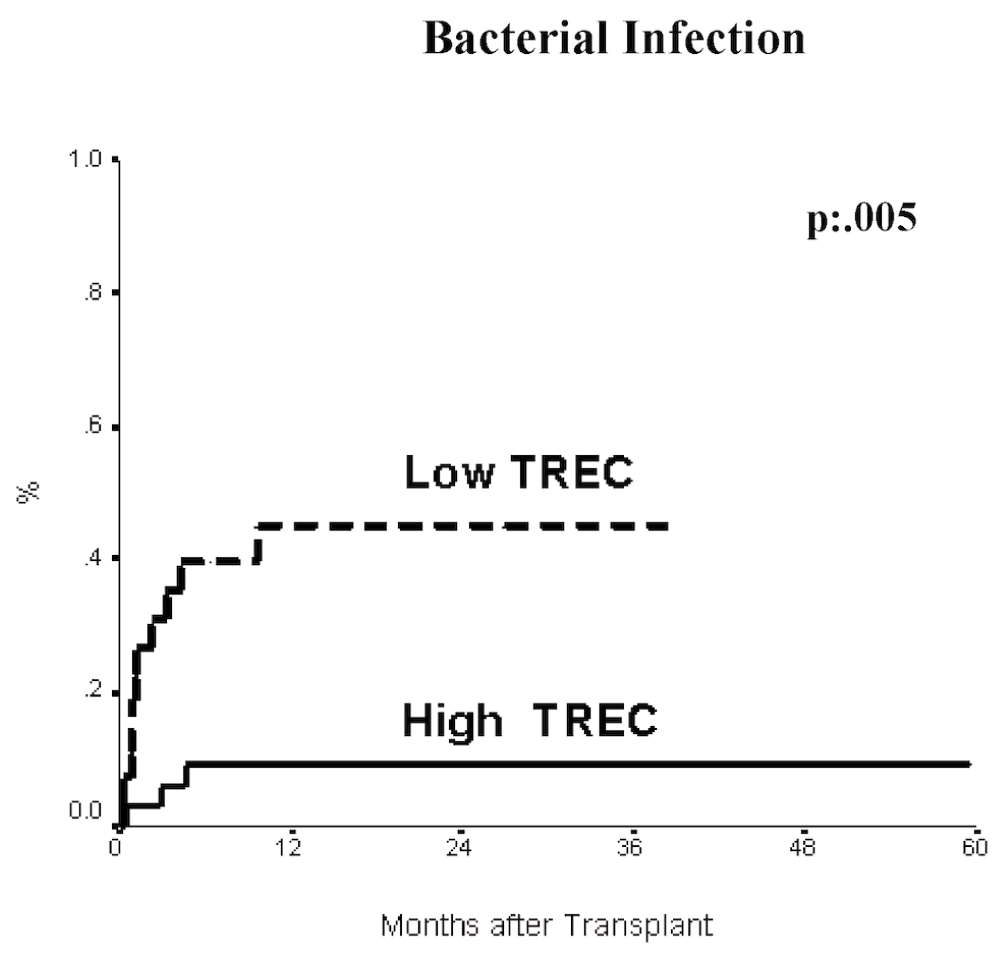
Next we performed the same analysis for bacterial and cytomegalovirus infection. There was a higher incidence of severe bacterial infection in the low TREC (42%) compared to the high TREC (8.5%) group (p=0.005) (Figure 4). Considering other variables, only low TREC level and peripheral blood as a source of transplant independently associated to bacterial infections (RRs: 6.6 and 4.2, respectively) (Table 2). CMV infection was also more frequently observed in the low TREC patients (63% vs. 22%, p<0.03) (Figure 5). Furthermore, low TREC values before transplantation and high risk disease had independent impact on the incidence of CMV infection (Table 2).

Patients with high TREC are shown as a solid line, while the patients with low TREC are plotted as s dashed line Log rank p=.005.
With the result of pre-transplant thymus function associated with aGVHD, we wondered if thymus output after transplantation (i.e. TREC levels) would also be related to aGVHD. For this purpose we assessed TRECs levels in blood samples collected before (pre-aGVHD) and during aGVHD from 16 patients. The time period between pre-aGVHD and aGVHD samples was 11.5±8 days. Comparing TREC levels between pre-aGVHD and aGVHD samples, we observed increased levels during aGVHD (147 vs. 480 TRECs/µg of lymphocyte DNA, p=0.015). One could suggest that this difference may be explained by the gradual increase in TREC levels after transplantation. In which case, the more time between pre-aGVHD and GVHD samples, the larger the increment in TREC levels. The analysis, however, showed no correlation between distance in time and TREC levels (Dataset 1). In addition, there was no correlation between the number of days after transplantation (17 to 49 days) and TREC levels in this time period. This indicates that we have observed an increase in TREC levels associated with aGVHD independently on the overall increase in TREC levels after transplantation reported previously25,46.
It has been postulated that a good immune reconstitution after HSCT means a better prognosis for the patients under stem cell transplantation47,48. The evaluation of immune reconstitution assessed by TREC quantification has been a matter of research. Here we analyzed the impact of pre-transplant thymic function in patients undergoing an HSCT. Although it has been reported that TREC levels correlate to post-transplant outcome5,18,24,25,49 it was not clear whether these observations are results of association of TREC levels with the severity of disease risk, especially considering a strong relation between disease risk and TREC levels (Figure 1A and 1B). In contrast to previously published work24, we analyzed a cohort of patients with a much higher proportion of malignant high-risk diseases, which allowed us to address the above mentioned concern. Thus, our results suggest that TREC levels is an independent marker for complications after HSCT.
Interestingly, we found that low TREC levels were associated with a higher probability of bacterial infection and aGVHD. This suggests that TREC levels are not just associated with high or low T-cell response after transplantation, but rather reflect an overall response to damage as well as potential capacity to establish immune homeostasis after transplantation. Indeed, in the setting of high-risk disease, patients were treated prior to transplantation with multiples cycles of chemotherapy and/or radiotherapy, potential contributors to thymic injury. Cortical and medullary thymic epithelial cells are dramatically altered after radiotherapy and chemotherapy14,50 as damage of thymic stroma precludes normal thymocyte development51 and probably the generation of TRECs.
Diminished levels of TRECs have been reported during chronic GVHD, or with a previous history of acute or chronic GVHD10,11. However, others studies have failed to demonstrate a direct association between TRECs levels and acute or chronic GVHD46,52. In a mouse model of aGVHD, TRECs levels were analyzed in the spleen and thymus, but not in blood, making difficult the direct comparison of these experiments in mice with our results53. TREC levels during acute GVHD have not been reported in patients. We, however, observed an increase of TREC levels during ongoing acute GVHD in comparing to the TREC levels two weeks before aGVHD. Interestingly, herein observed increases in TREC levels during acute GVHD are very similar to our previous observation of increased TREC levels during acute cardiac rejection38 suggesting that similar events may be occuring in these two pathological processes in the blood. The explanation for these results, on one hand, could be an increased output of TREC positive naïve T-cells into circulation, stimulated by the ongoing immune response25. On the other hand, this result might indicate the exit of activated/effector cells from the circulation into target tissues and a consequent increase in a naïve T-cell pool in the blood. Keeping in mind the limitations of our analysis (a small number of patients and an indirect comparison), additional research is necessary in order to draw definitive conclusions about changes in post-transplant TREC levels in relation to aGVHD.
In this work we demonstrated a relatively easy way of normalizing TREC values determined by RT-PCR, without the concomitant need for flow cytometry to estimate the numbers of CD3+ cells. Notably, a cut-off established by ROC-curve analysis, which could discriminate between a good or bad prognosis, was similar to the value found at the 60th percentile, after TREC values distribution in percentiles from published works24,25. Using our cut-off, we observed very similar results when compared to published results in relation to survival, acute GVHD, bacterial and CMV infections24. Finally, we have shown disease risk as one the most important sources of TREC level variability in patients before HSCT. Further studies should consider this factor in order to establish how TREC levels can be used in diagnostics.
In conclusion, our results further support the idea that the thymic competence before transplantation is a critical factor for a good prognosis after hematopoietic stem cell transplantation.
F1000Research: Dataset 1. sjTREC before transplant - patient dataset, 10.5256/f1000research.7330.d108555
AMA- designed the study, participated in patients enrolment, performed experiments, analyzed results, wrote manuscript; KK- performed experiments, analyzed results; AS- participated in patients enrolment and study design; JSRO- designed the study, participated in patients enrolment, contributed to analyses of results; MGL- designed the study, contributed to analyses of results, contributed to guidance of the laboratory part of the project; NS and AM- designed the study, analyzed results, wrote manuscript, provided overall leadership of the project. All authors have seen and agreed to the final content of the manuscript.
The study was supported by AFIP’s internal funding. The sponsor of the study had no role in study design, data collection, data analysis, interpretation or writing of the report.
| Views | Downloads | |
|---|---|---|
| F1000Research | - | - |
|
PubMed Central
Data from PMC are received and updated monthly.
|
- | - |
Competing Interests: No competing interests were disclosed.
Competing Interests: No competing interests were disclosed.
Alongside their report, reviewers assign a status to the article:
| Invited Reviewers | ||
|---|---|---|
| 1 | 2 | |
|
Version 1 16 Dec 15 |
read | read |
Click here to access the data.
Spreadsheet data files may not format correctly if your computer is using different default delimiters (symbols used to separate values into separate cells) - a spreadsheet created in one region is sometimes misinterpreted by computers in other regions. You can change the regional settings on your computer so that the spreadsheet can be interpreted correctly.
Provide sufficient details of any financial or non-financial competing interests to enable users to assess whether your comments might lead a reasonable person to question your impartiality. Consider the following examples, but note that this is not an exhaustive list:
Sign up for content alerts and receive a weekly or monthly email with all newly published articles
Already registered? Sign in
The email address should be the one you originally registered with F1000.
You registered with F1000 via Google, so we cannot reset your password.
To sign in, please click here.
If you still need help with your Google account password, please click here.
You registered with F1000 via Facebook, so we cannot reset your password.
To sign in, please click here.
If you still need help with your Facebook account password, please click here.
If your email address is registered with us, we will email you instructions to reset your password.
If you think you should have received this email but it has not arrived, please check your spam filters and/or contact for further assistance.
Comments on this article Comments (0)