Keywords
mental entanglement, EEG, ERP, bootstrap, Monte Carlo.
mental entanglement, EEG, ERP, bootstrap, Monte Carlo.
The study of EEG correlates of social interaction is a hot topic in the world of social neuroscience, described as follows by Cacioppo & Bertson (2002): “Social neuroscience addresses fundamental questions about the mind and its dynamic interactions with the biological systems of the brain and the social world in which it resides”.
The study of EEG correlates of social interaction ranges from simple face-to-face motor interactions (e.g. Hari et al., 2013), to empathy (Singer & Lamm, 2009), to interpersonal motor co-ordination (Oullier et al., 2008; Sebanz & Knoblich, 2009). A recent review of the current status of the field, particularly in reference to social cognition, is given by Chatel-Goldman et al. (2013). This review highlights the importance of not underestimating possible non-local mechanisms that can emerge from person-to-person interactions. These mechanisms are defined as “dependent operations between two or more brains that operate at least in part on shared information content” and are also described as interactive alignment, resonance, phase synchronization, and non-local correlations.
Is it conceivable that these mechanisms can be detected even when two persons are mentally interacting without the possibility of sensory information exchange?
This possibility is rarely studied, not so much because of technical or methodological difficulties, but because the prevailing view is that the human mind can only receive information through the five senses and anything else is impossible. Nonetheless, if we assume that the human mind is also capable of receiving and processing information transmitted from other than the five senses, it becomes possible to investigate the characteristics of mental activity related to the interaction between two sensorily isolated individuals.
This model of mind function, also defined as “non-local” because it is not limited to the spatial and temporal confines of the five senses, is predicted by various theoretical models. For example, according to Dual-Aspect Monism (Atmanspacher, 2012), there is neither a material reality nor a mental reality – rather, they are two different aspects of one reality. These mental characteristics are also consistent with Generalized Quantum Theory (GQT) proposed by Walach & von Stillfried (2011), and Filk & Römer (2011). This theory postulates the existence of a distant mind-to-mind connection (mental entanglement), similar to the entanglement phenomena of quantum physics.
According to these authors: “The genuinely quantum theoretical phenomenon of entanglement can and in general will show up also in GQT if the following conditions are fulfilled:
1) A system is given, inside which subsystems can be identified. Entanglement phenomena will be best visible if the subsystems are sufficiently separated such that local observables pertaining to different subsystems are compatible.
2) There is a global observable of the total system, which is complementary to local observables of the subsystems.
3) The total system is in an entangled state. For instance, eigenstates of the global observable are typically entangled states.
A distant social interaction between two persons who know each other satisfies these requirements provided that:
a) the two persons represent two subsystems of a single larger one created by their relationship, and
b) this relationship constitutes an entangled state, and furthermore that
c) the measurable psychological and physiological variables represent the system’s comprehensive characteristic even though measured individually.
The study presented here is a further addition to this field of research. In comparison to other research, our specific objectives are:
1) To determine the difference in power or other statistical characteristics of the EEG signal between the person receiving the physical stimulus and his/her mentally connected partner;
2) Determine the latency period, if any, between the EEG signals and the stimulus of both partners;
3) Determine the frequency ranges of EEG activity that best represent the connection between the subject pair.
Six Italian Caucasian healthy adults were chosen for the experiment, comprised of five men and one woman, with an average age of 35.5 years (standard deviation = 8.3).
They were selected among the members of the EvanLab, the private laboratory involved in this study. The criteria for their voluntary inclusion were their mutual friendship (> 10 years), and their experience in being able to maintain prolonged focused concentration – a product of their familiarity with meditation and other practices requiring control of mental activities.
The use of experimental subjects is in accordance with ethical guidelines as outlined in the Declaration of Helsinki, and the study has been approved by the Ethical Committee of the University of Padova’s Department of General Psychology. Before taking part in the experiment, each subject gave his/her informed consent in writing after having read a description of said experiment.
A software program, available at http://dx.doi.org/10.6084/m9.figshare.1466876, especially written by one of our co-authors (GW) administered the sequence of stimuli and synchronized the EEG recordings from each member of the pairs. EEG activity was measured using two Emotiv® EEG Neuroheadsets, equipped with 14 EEG channels, connected via WiFi to a Windows PC.
The technical details are: 14 electroencephalography channels based on international location from 10 to 20 (AF3, F7, F3, FC5, T7, P7, O1, O2, P8, T8, FC6, F4, F8, AF4, plus two reference electrodes). The mastoid electrodes (M1, M2) served as reference points against which the voltage generated from all other electrodes was compared. The sample frequency of the Emotiv® headsets is 128 Hz, with a bandwidth from 0.2 to 45 Hz, with a built-in fifth order low-pass digital filter as well as two notch filters at 50 and 60 Hz respectively as protection against noise produced by the local electricity network. The Emotiv® EEG has a proprietary wireless network connection at a frequency of 2.4 GHz.
The auditory stimulus was composed of a 500 Hz sinusoid applied through 32 Ohm Parrot ZIK® earphones at a volume of about 80 dB. The visual stimulation was from high intensity red LEDs in a 4×4 arrangement placed approximately one meter from the subject being stimulated. The subject kept his/her eyes closed because the light could easily be detected through the eyelids.
The members of each pair were placed in two separate rooms approximately five meters from each other. Each room was sound- and light-proof, so as to block out any and all external sensory information.
Between these two rooms was a control room with two computers connected to the Emotiv® headsets and from which the research assistant controlled the sensory stimulation program and each partner’s EEG recording (see Figure S1 in Supplementary material). The software program in use ensured that the signals coming from the two EEG headsets were recorded simultaneously (to within 8 ms).
The partner designated as “Sender” was given the following instructions: “When you are ready, relax and be prepared to receive a visual and auditory stimulus which you will send to your partner. To assist your mental connection with him/her, concentrate on his/her photo before starting the experiment. Your only task is to mentally transmit what you will perceive, while limiting your body movements to prevent interference with your EEG activity. You will perceive 128 stimulations of 1 second each, separated by pauses of random length lasting 4 to 6 seconds in order to avoid predictable rhythms. The experiment will last about 10 minutes.”
The partner designated “Receiver” was given the following instructions: “When you are ready, relax and be prepared to receive the stimuli sent from your partner. To assist your mental connection with him/her, you will see a facial photo of him/her before starting the experiment. Your task is to mentally connect with him/her and try to perceive the stimulus he/she is receiving, while keeping your body still to prevent interference with your EEG activity. The experiment will last about 10 minutes.”
Once the quality of the EEG signals was confirmed, and with the consent of the subjects, the research assistant began running the experiment’s program. To prevent either subject from predicting when the first stimulus would be given, it was preceded by a period of silence of random duration from 2 to 3 minutes.
At the end of the experiment, after a period of rest, in m ost cases (if subjects agreed and time allowed) the role of each subject was reversed.
All together data from 25 pairs of subjects was collected over three days. The raw data are available at http://dx.doi.org/10.6084/m9.figshare.1466876 which include details of pairings.
To avoid any experimenter’s effect, the research assistant who managed the software for the data acquisition were blind to the exact start of the stimulation sequence, given the randomization of the duration of the first pre-stimulation period as described above.
The reduction of the risk of any conventional communication between the pair of participants, was guaranteed by the sensory isolation of the two rooms were they were placed as already described. The only remaining possibility was to speak aloud each other, but this event could clearly be noticed by the research assistant.
Collection of the evoked potential was initially conducted by filtering the signals in the 1 – 12 Hz band followed by normalization (see software code of Appendix 1 at http://dx.doi.org/10.1101/022046), hence employing the traditional averaging method of time- and phase-locked epochs. The typical result of an evoked potential obtained from Senders can be seen in the graph in Figure 1.
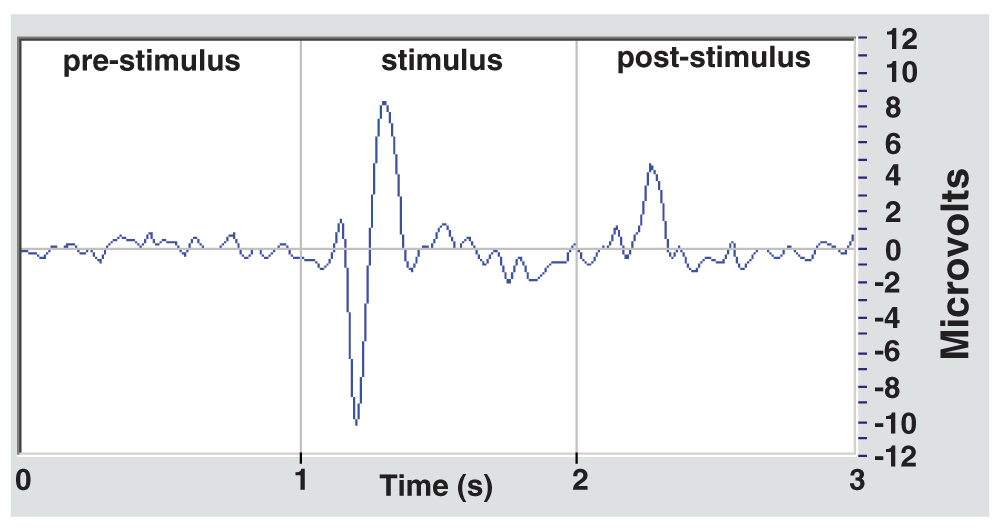
The graph is an average of 128 stimuli and 14 EEG channels. Usually two peaks are seen, a negative and a positive one, about 250 to 300 ms after the stimulus begins, and a minor peak at about 250 ms after the stimulus ceases.
The average Event-Related Potential (ERP) of all 25 files from Senders and Receivers was also calculated. To get the total sum of evoked potentials from all subjects while avoiding ERP different latency period problems, each subject’s individual evoked potential powers were added up. The resulting graph is shown in Figure 2.
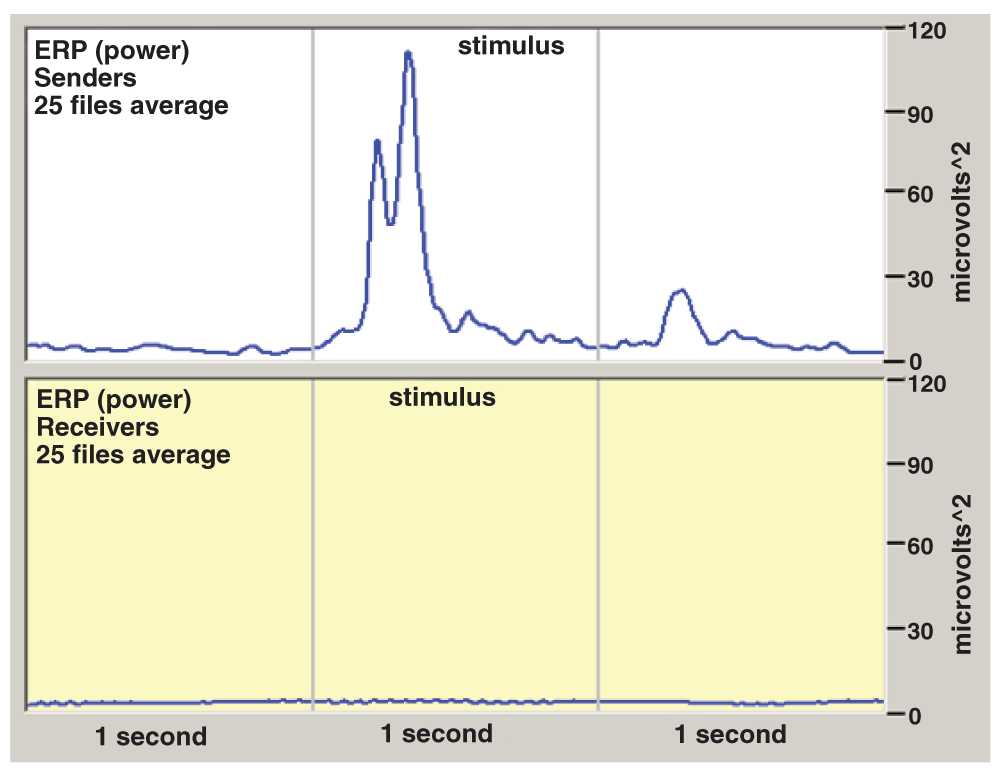
Figure 2 clearly shows an ERP in the Senders, but nothing of interest in Receivers.
Following this negative result we began using an original method created by one of our co-authors (WG), and described in detail in Tressoldi et al. (unpublished; pre-print proof available at http://biorxiv.org/content/early/2015/07/06/022046), which was found more resistant to jitter and interferences compared to the traditional averaging method. Furthermore, as described below and in more detail in the original paper, this new processing method is far less prone to unwanted effects of EEG artifact because as the Pearson Correlation depends only on signal phase and not to amplitude.
This method is based on the Pearson correlation between segments of data of fixed length L, as shown in Figure 3.

The corresponding Pearson Correlation is calculated and recorded on the R(x) array.
As an example, the Emotiv® EEG Neuroheadset provides NC = 14 EEG channels and a sample frequency of 128/s; the stimulus is 1 second duration and an epoch’s length is 3 seconds, equal to 384 samples. In this case it becomes possible to calculate the R(x) array in a number of combinations of pairs equal to: Nt = NC*(NC - 1)/2 = 91. The result can be written using a new array, R(I, X), in which I = 1... 91 and X = 1... 384 are the calculated values. The stimulus is administered at the same time as sample no. 128 and ceases after one second, with sample no. 256. The next processing step involves the average of R(I, X) over all the given stimuli, the result designated as R’(I, X).
Therefore, for each value of I = 1.... 91 a baseline is calculated, comprised of the average of R’(I, X) in the pre- and post- stimulus areas. Finally a new array is calculated, Sync(I, X), based on the result’s absolute value: Sync(I, X) = Abs(R’(I, X-Baseline)).
Then the average of all the Nt combinations gives us the final array, Sync1(X), which represents the total variations of the EEG correlations during a 3 second epoch, for all stimuli and all EEG channels. It is also possible to calculate a similar array, Sync2(C, X), for each channel, C.
To be extra certain, the analysis of experimental data was nonetheless conducted on longer epochs – up to 4 seconds – comprised of 1.5 seconds pre-stimulus, 1 second stimulus, and 1.5 seconds post-stimulus. To calculate the probability that the observed differences in baselines are due to chance, the experimental data were compared to those obtained with a simulation conducted using a bootstrap procedure with the following characteristics:
a) Signals from the desired frequency range (in our case 9–10 Hz in Receivers and 1–16 Hz in Senders) are filtered using a digital filter that leaves signal phases intact, according to the Discrete Fourier Transform (DFT) and its related inverse processing. The filtered files are then saved. We point out that for Senders the standard frequency range (1–16 Hz) was used because the ERP is usually generated in this range.
b) The same processing method (The GW6 method) is applied to these files, but choosing at random the point in which a stimulus is thought to be present. For each file, the same number of stimuli (128) are evaluated, as in the experimental tests. For each file at least 20 bootstrap calculations are made, eventually resulting in over 500 files. The average of these calculations constitutes the blue bootstrap curve in Figure 4 and Figure 5, which therefore represents the expected probability due to chance, to compare with the obtained experimental curves (red). This method appears valid in that it gives a virtually flat curve (blue), close to zero throughout.
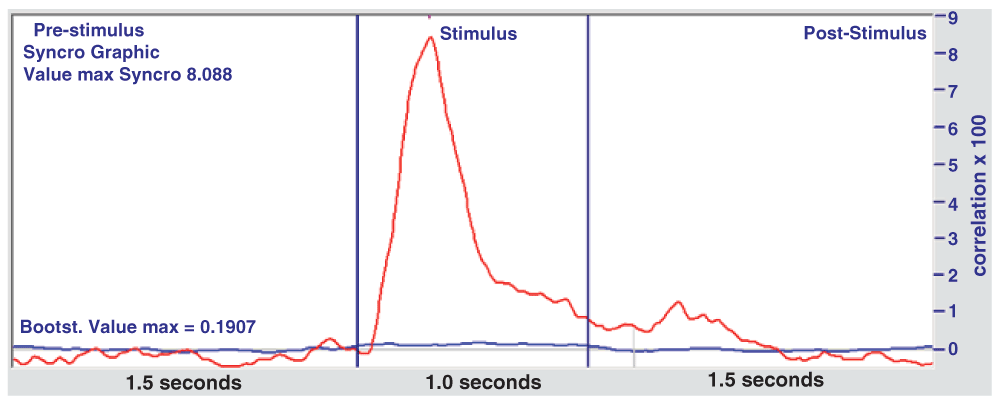
On the vertical axis are correlation values x100. The blue curve denotes the average of 500 bootstrap files.
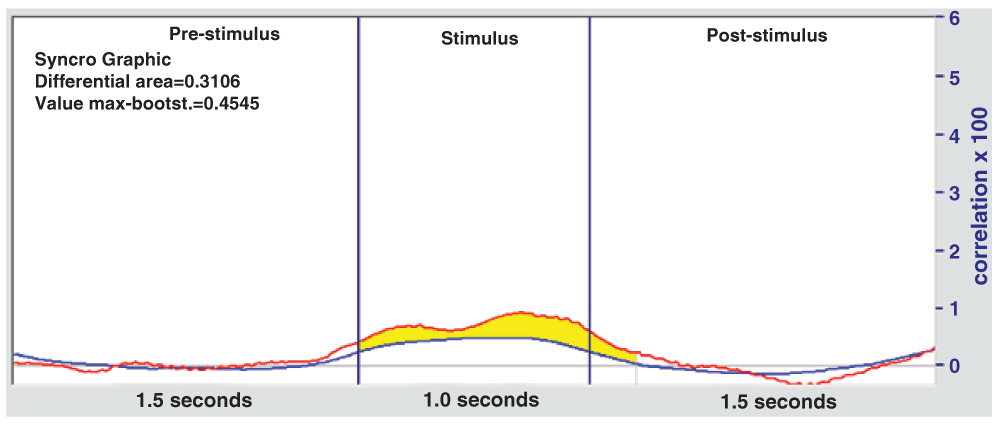
The red curve is the average correlation and the blue is the bootstrap curve (average of 500 files), which represents the expected probability due to chance.
In Figure 4, a distinct peak (red curve) is seen which represents a correlation ERP at about 300 ms from the start of the stimulus, followed by a weaker peak at the end of the stimulus. This graph is similar to the one obtained from standard averaging in Figure 2, only expanded.
In Figure 5, with respect to the Receivers, there is an area that exceeds the normal chance expectation represented by the bootstrap curve. This area is highlighted in yellow and can be calculated as the difference with respect to the bootstrap curve.
A similar analysis was conducted by filtering signals within the 1 to 16 Hz band (as in the Senders) with statistically null results, and subsequently in the 8 to 16 Hz band, followed by the 8 to 12 Hz, but the best result was obtained in the 9 to 10 Hz range (see Table 1).
The column on the right shows the probabilities that the results are purely due to chance.
| Role | EEG Band | Area Difference | Maximum Value | Probability |
|---|---|---|---|---|
| Receivers | 9–10 | 0.3106 | 0.4545 | 0.002/0.003 |
| Receivers | 8–12 | 0.1516 | 0.186 | 0.035/0.040 |
| Receivers | 8–16 | 0.0737 | 0.167 | 0.15/0.17 |
| Senders | 1–16 | 2.464 | 7.90 | <0.00001 |
After having established an increase in cerebral correlation in Receivers coinciding with the remote stimulus given to Senders, it is necessary to determine the importance of this difference with respect to the statistical chance. To this end, instead of resorting to conventional statistical methods, often inapplicable to complex situations such as this, we used an emulation procedure of the Monte Carlo type consisting of the following steps:
a) Take the bootstrap files within the desired frequency band – in our case from 9 to 10 Hz (around 500 files), or from other bands. All of these files are the result of a GW6-type processing and are now the input data set for the Monte Carlo emulation.
b) 25 “fake” files are randomly chosen and their final average is calculated, in the same way as the average of the 25 “real” files.
c) The difference in area with respect to the average of all the 500 bootstrap curves is calculated, as in Figure 5. This difference may be either a negative or positive number.
d) Determine if this number is higher than that obtained from the real experimental files. If it is higher, a counter is incremented.
e) Start again from a) and repeat the cycle as required (we repeated the cycle 2000 times).
At the end, determine how many times out of 1000 a group of 25 bootstrap files randomly exceeds the value of the area found experimentally. The results give the probability of obtaining a surplus of area by chance, as in Figure 6. This procedure does not use any specific a priori statistical model, and is based solely on applying numerous emulations exactly as with real data. As shown in Table 1, in the 9 to 10 Hz band the result is significant to a level of around 2–3/1000, equivalent to P ≤ 0.003, and is even significant in the 8 to 12Hz band, with P ≤ 0.04. The almost Gaussian distribution of the values shows that the method is valid and agrees with normal statistics.
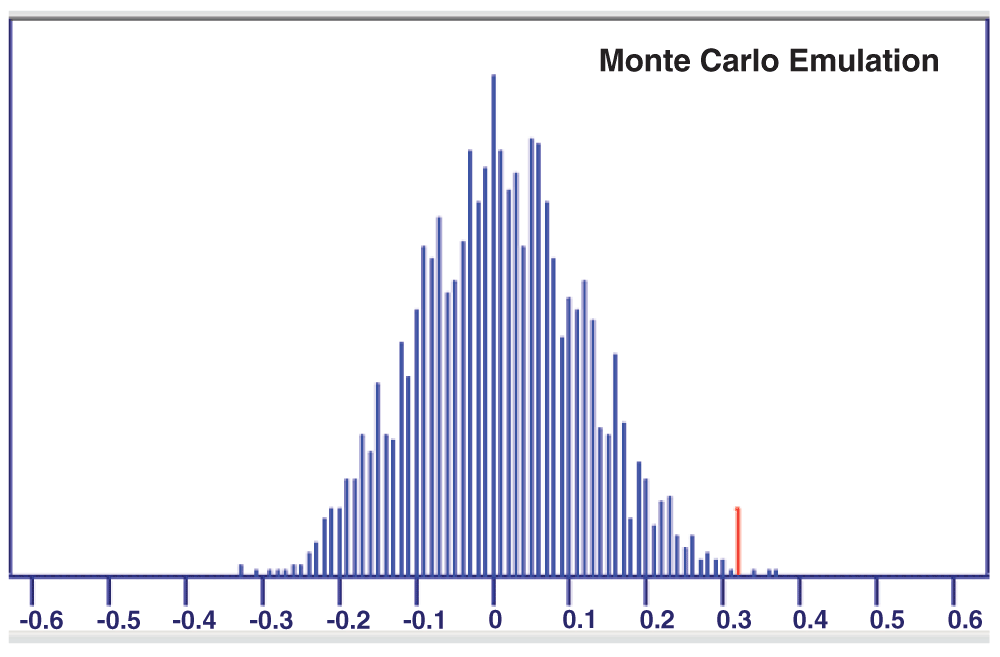
The value of the area to be exceeded (see Table 1) is 0.3106 (red line). The distribution is approximately Gaussian and the specified value is exceeded by chance 3 out of 2000 times.
When traditional methods of averaging and calculations for ERP power are used, there is a distinct evoked potential in the EEGs of subjects who are Senders, but not in the EEGs of Receivers.
Conversely, when the GW6 method is used and the signals within the 9 – 10 Hz band are filtered, we obtain the results shown in Figure 5, which are statistically confirmed by the Monte Carlo Emulation. These outcomes lead us to believe that Receivers exhibit a weak response to the remote stimulus in the form of a small change in cerebral synchronization coinciding with the stimulus. This variation approximately equates to a 0.5% correlation, with a maximum of about 1.5–2.0% in the best subjects under examination. Even though the applied method does not display a result in the form of a wave similar to that seen in the Senders’ ERPs, this result does however open the door to future investigations aimed at identifying specific patterns of weak but significant responses in Receivers. This study is clearly explorative but if our results were confirmed, they would be of huge scientific importance because they provide neurophysiological evidence of a connection – or social interaction – at distance.
Regarding future developments in this area, we will attempt to identify EEG signals in Receivers while applying a gradual reduction in the number of stimulations. Continual advances in techniques for processing EEG signals allow us to be optimistic in reaching this objective.
The raw dataset and software codes for this article are available at: http://dx.doi.org/10.6084/m9.figshare.1466876
The unpublished proof describing the GW6 method is available at: http://biorxiv.org/content/early/2015/07/06/022046
GW, LP and SM conceived the study and designed the experiments. All authors carried out the research. GW, LP and PT prepared the first draft of the manuscript. All authors were involved in the revision of the draft manuscript and have agreed to the final content.
We kindly acknowledge the support of the BIAL Foundation, which funded part of this study through grant no. 124/12.
We confirm that the funders had no role in study design, data collection and analysis, decision to publish, or preparation of the manuscript.
| Views | Downloads | |
|---|---|---|
| F1000Research | - | - |
|
PubMed Central
Data from PMC are received and updated monthly.
|
- | - |
Competing Interests: No competing interests were disclosed.
Competing Interests: No competing interests were disclosed.
Alongside their report, reviewers assign a status to the article:
| Invited Reviewers | ||
|---|---|---|
| 1 | 2 | |
|
Version 5 (revision) 10 Feb 16 |
read | |
|
Version 4 (revision) 02 Feb 16 |
read | |
|
Version 3 (revision) 14 Jan 16 |
read | |
|
Version 2 (revision) 09 Nov 15 |
read | |
|
Version 1 03 Aug 15 |
read | read |
Provide sufficient details of any financial or non-financial competing interests to enable users to assess whether your comments might lead a reasonable person to question your impartiality. Consider the following examples, but note that this is not an exhaustive list:
Sign up for content alerts and receive a weekly or monthly email with all newly published articles
Already registered? Sign in
The email address should be the one you originally registered with F1000.
You registered with F1000 via Google, so we cannot reset your password.
To sign in, please click here.
If you still need help with your Google account password, please click here.
You registered with F1000 via Facebook, so we cannot reset your password.
To sign in, please click here.
If you still need help with your Facebook account password, please click here.
If your email address is registered with us, we will email you instructions to reset your password.
If you think you should have received this email but it has not arrived, please check your spam filters and/or contact for further assistance.
Comments on this article Comments (0)