Keywords
Biochar amendment, conventional rice farming, greenhouse gas emissions, melaleuca biochar, rice-husk biochar, soil fertility
This article is included in the Agriculture, Food and Nutrition gateway.
Biochar amendment, conventional rice farming, greenhouse gas emissions, melaleuca biochar, rice-husk biochar, soil fertility
We have incorporated the reviewers’ suggestions and recommendations in the new version. Accordingly, the revisions have been made as follows:
1) The term soil physiochemical properties has been used in the title.
2) A short explanation related to soil properties has been supplemented in the abstract section.
3) An additional explanation has been expanded to statistical analysis.
4) The use of abbreviations has been unified in all parts
See the authors' detailed response to the review by Bui Truong Tho
See the authors' detailed response to the review by Azeem Tariq
In Vietnam, the agricultural sector contributes approximately 30% of national greenhouse gases (GHGs) emissions (MONRE, 2017). For rice cultivation, paddy fields are the primary source of GHGs emissions (Nan et al., 2020; Shinoda et al., 2019), accounting for 50% of the sub-sectors in agricultural production and roughly 14.6% of national GHG emissions in Vietnam (MONRE, 2017). According to NDC (2020), Vietnam is committed to reducing 8% of total national GHGs emissions from domestic resources by 2030. Management and technological strategies will play a vital role in reducing the total carbon footprint. Biochar is a carbonized biomass product produced from thermochemical conversion of organic materials under oxygen-limited conditions (Lohri et al., 2016; Wu et al., 2012; Waqas et al., 2018). Biochar applications have been noted as one of the most promising approaches for reducing GHGs emissions from rice production (Koyama et al., 2015; Wu et al., 2019a; Nan et al., 2021), and IPCC recently recommended the method (Ji et al., 2020). Previous studies have demonstrated that biochar incorporated into soil paddy fields positively rehabilitated soil properties such as pH neutralization, cation exchange capacity (CEC), and buffering capability, soil organic materials (SOM), and nitrogen storage (Qin et al., 2016; Luo et al., 2020); improved plant available water, microporosity, and soil aggregate stability, and decreased bulk density (Burrell et al., 2016); effected on soil functions and fertility (Giagnoni et al., 2019; Siedt et al., 2021); and ameliorated nutrient availability of carbon (C), nitrogen (N), phosphorus (P), potassium (K), magnesium (Mg) and Calcium (Ca) (Li et al., 2019). Furthermore, biochar forms a great habitat for different microorganisms via providing macro-, meso- and micropores (Palansooriya et al., 2019; Wu et al., 2019a), supports microbial communities by providing labile C substrates for degradation (Smith et al., 2010), stimulating biodiversity and abundance of methanotrophic microbes (Qin et al., 2016). Moreover, the addition of biochar to the soil reduces GHGs emissions (Spokas and Reicosky, 2009; Koyama et al., 2015; Nan et al., 2020; Huang et al., 2019) and increases rice yield under different favorable conditions (Yang et al., 2019; Paiman and Effendy, 2020).
In the Vietnamese Mekong Delta (VMD), melaleuca is an abundantly available hard firewood resource, accounting for 176,295 ha (GIZ, 2009); the wood reserve of melaleuca is estimated at 13 million m3. In addition, rice husk is known as a by-product of rice production, accounting for 20% of rice yields (Chungsangunsit et al., 2009). It is estimated that VMD annually produces around 1.9 million tons of rice husk (Son et al., 2017). Biomass (hardwood and crop residues) are often used as typical feedstock for making biochar pyrolysis owing to their multiple-porous structure (Nguyen et al., 2018; Nan et al., 2020), which facilitates the multifunctional purposes of soil amendment and pollutant remediation. Therefore, both melaleuca and rice husk could be used to produce biochar, which is then applied to rice paddy fields as a GHGs emission reduction strategy. Although previous studies have demonstrated the effectiveness of biochar incorporation on reducing GHGs emissions, little attention has been paid to the quantitative variation of rice husk biochar (RhB) and melaleuca biochar (MB) on GHGs emissions and soil improvement in VMD lowland conditions. Moreover, the majority of previous studies exclusively emphasize CH4 and N2O emissions on water practices by controlled irrigation, and alternative wetting and drying, and midseason drainage (Yang et al. 2019, Sriphirom et al. 2020, Uno et al. 2021), while atypical water irrigation regime has not been thoroughly elucidated.
Thus, we aimed (i) to elucidate the CH4 and N2O emissions and global warming potential (GWP) from the incorporation of RhB and MB into the paddy field soils under locally typical water management regimes in the VMD, and (ii) to determine the effects of RhB and MB amendments on soil physicochemical properties. We, therefore, conducted a field experiment with a variety of RhB and MB amendment amounts under conventional farming practices. Our field experimentation confirmed that RhB and MB application to rice paddy fields was feasible in reducing GHGs emissions. Simultaneously, biochar application improved soil availability of SOM and anaerobically mineralized N.
A field experiment was carried out on a typical smallholding farmer's paddy field in Thoi An Dong Village, Can Tho city, Vietnam (10°3′44″N, 105°41′55″E). The study area was located in the center of the Mekong Delta, Vietnam, which is a tropical area influenced by the monsoon climate zone, with measured mean annual rainfall (2,088.4 mm), air temperature (27.5 °C), humidity (78.0 – 86.0%), sunshine (2,467.4 – 2,695.4 hours) in the period from 2015-2019 (DONRE, 2020). The precipitation and temperature during the experiment were recorded by a weather station placed at the farmer's house (~150 m from the field experiment). The soil was classified as Thionic Glycesol (International Union of Soil Sciences (IUSS) working group World Reference Base (WRB), 2015) (Dong et al., 2012, Minamikawa et al., 2021). The elementary properties were (0-20 cm depth) as follows: pH (H2O), 5.41; EC, 0.9 mS cm−1; bulk density, 0.92 g.cm−3, silty clay texture (59.3% clay, 39.5% silt, 1.2% sand); organic matter, 87 g kg−1; total N, 4.21 g kg−1; cation exchange capacity (CEC), 37.4 meq 100 g−1; exchangeable K, 0.54 meq 100 g−1, exchangeable Mg, 5.47 meq 100 g−1; exchangeable Ca, 10.5 meq 100 g−1; and total C, 40.76 g kg−1.
RhB was made on-site using a simple semi-industrial pyrolysis batch method (Oikawa et al., 2016). Here a short iron bar was to set onto the ground. A stainless chimney pipe 1.5m long was vertically erected to the bar using wire. The pipe was kept at a 10-cm distance from the ground to release smoke generated during the pyrolysis process. Embers were placed adjacent to the bar to kick off the carbonization process. Then, rice husk was poured around the bar according to a coniform shape with 1.5 m height and 1.5 m diameter. RhB was generated from the bottom to the summit. After finishing the pyrolysis process (two days), RhB was watered to achieve ambient temperature.
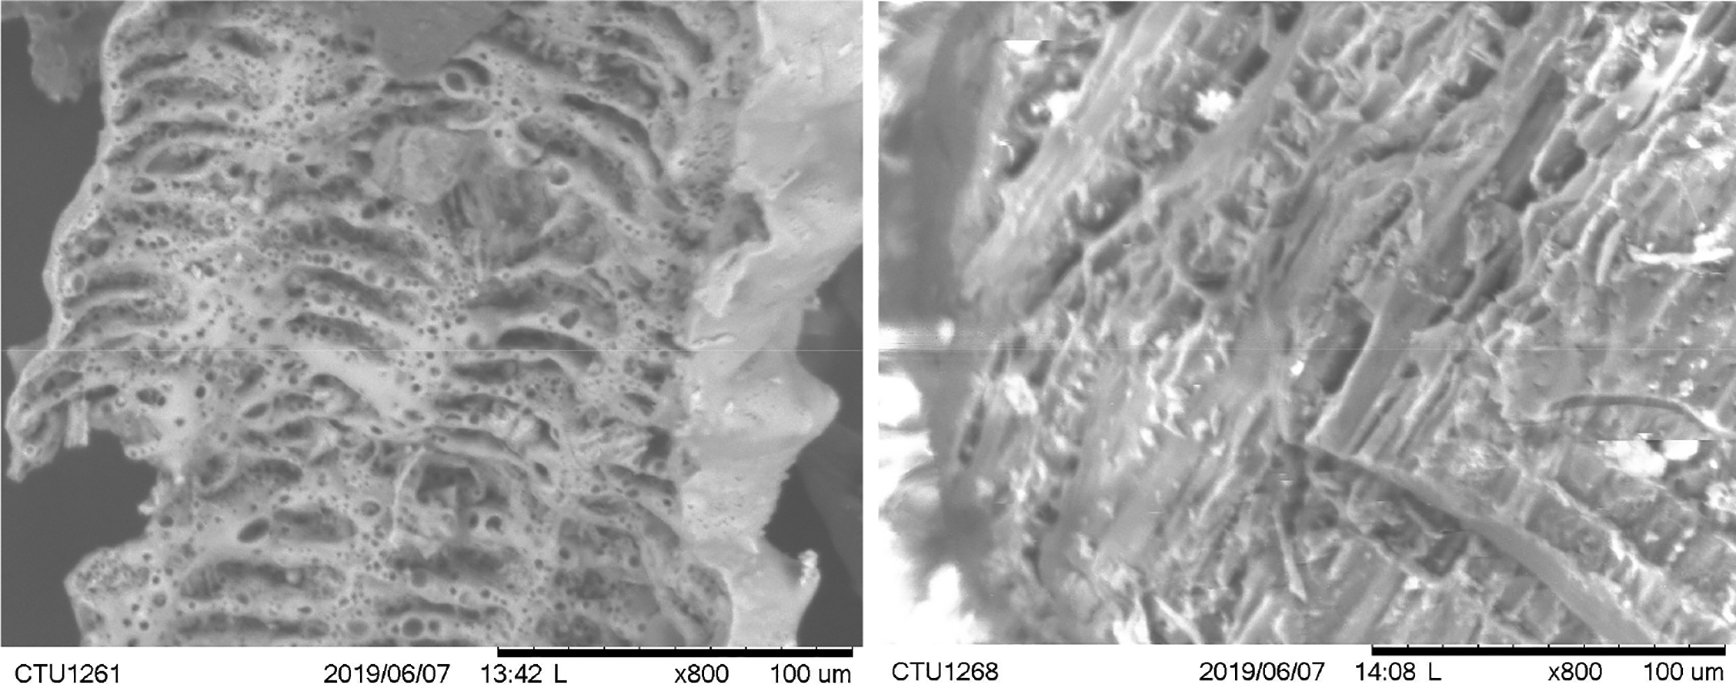
MB was produced by a poor-oxygen pyrolysis process under a traditional bell-shaped charcoal production kiln for a 30-day batch. The kiln was made from baked bricks, clay, and sand mortar. The kiln’s structure comprises a bell-shaped heating firewood chamber, a door used for firewood loading, and biochar unloading. A combustion chamber provided hot air for the carbonization process, while four chimneys were installed around the heating chamber discharging smoke during the carbonization process. Firewood was fully loaded according to each layer inside the heating chamber; the lowest layer was kept 10 cm away from the ground to ensure air convection. Before starting, the door was closed to begin the carbonization process. Air heating from the combustion chamber was slowly provided to the inner heating chamber to form carbonization. After 30 days of pyrolysis, the heating was switched off, and the combustion chamber was blocked off for an additional 15 days to cool to ambient temperature. The images of RhB and MB and their properties are shown in Figure 1 and Table 1, respectively.
The size of each experimental plot was 20 m2 (4 m × 5 m) which were arranged in a randomized complete block design with three replications. Each plot was separated by soil banks and covered with mulch film. Five treatments with RhB and MB incorporated into the soil paddy field comprised 0 t ha−1 (conventional rice cultivation without biochar supplementation), 5 t ha−1, and 10 t ha−1 (based dried weight) named CT0, RhB5, RhB10, MB5, and MB10, respectively. Biochar was manually spread on the soil surface of each pot and evenly incorporated into the plow layer of soil (approximately 20 cm) by shovels and rakes before sowing. Biochar additions were applied one time solely at the beginning of the experiment.
According to the local crop calendar, the experiment time corresponded with the Spring-Summer (SS) season (the second crop) (Table 2). This is a transitional season between the dry and wet seasons. Rice straw and rice stubble from the previous rice crop cycle (Winter-Spring) were plowed by a hand tractor and underwent a 7-day fallow period before sowing. A short-duration variety of rice (IR50404 cultivar) typically grown in VMD was used in this field experiment (85-90 days of maturity). Pre-germinated seeds were sown on the wet-leveled soil using drum seeders at a rate equivalent to 120 kg ha−1. The irrigation followed regionally typical water management based on the farmer’s practical experience.
| Cultivated schedule | Date of experiment1) | Days after sowing |
|---|---|---|
| Plowing | 14/03/2019 | −7 |
| Biochar incorporation | 21/03/2019 | 0 |
| Sowing | 21/03/2021 | 0 |
| Starting irrigation | 29/03/2021 | 8 |
| Fertilization | ||
| 1st topdressing (16-8-20)2) | 30/03/2019 | 9 |
| 2nd topdressing (32-16-0)2) | 13/04/2019 | 23 |
| 3rd topdressing (32-16-20)2) | 27/04/2019 | 38 |
| Drainage | 30/05/2019 | 70 |
| Harvest | 14/06/2019 | 85 |
Inorganic fertilizers with the total amount of 80 kg N ha−1, 40 kg P2O5 ha−1 and 40 kg KCl ha−1 were applied. The fertilization was divided into intervals at 9, 23, and 38 days after sowing (DAS) by broadcasting. Nitrogen (N) was applied as urea at a rate of 16-32-32 kg N ha−1 (broadcasted three times). Phosphorus (P) was applied as superphosphate at a rate of 8-16-16 kg P2O5 ha−1 tolerant (broadcasted three times). Whereas potassium (K) was applied as potassium chloride at a 20-0-20 kg KCl ha−1 rate (broadcasted twice). The rice cropping calendar and fertilizer application are shown in Table 2.
Scanning electron microscope (SEM) images of RhB and MB were captured by microscope (TM-1000, Hitachi, Japan). Specific surface area and total pore volume were determined using BET Surface Area Analyzer (Quatachrome Nova 1000e, USA).
A weather station (WS-GP1, Delta-T Devices, Cambridge, UK) was installed on-site to record hourly temperature and rainfall at the experimental site. Redox potential (Eh) at plow-layer soil (20 cm) was measured by using platinum-tipped electrodes pined into the ground at a depth of 5, 10, and 20 cm; a portable Eh meter (HM31P; TOA-DKK, Japan) was connected to the electrodes to record soil Eh values at corresponding times to gas sampling. Surface water levels were also recorded simultaneously with gas sampling, using a ruler to read values directly in a plastic-perforated tube pre-installed in each plot.
Topsoil samples (0-20 cm) in each plot were collected before adding biochar and harvest by an auger 3 cm diameter. Visible remaining biomass was eliminated before air drying and sieved at 2.0 mm. Initial soil samples (n = 15) were mixed into a collective sample for analysis. Harvest soil samples were collected for each plot separately. Physical soil properties were measured as follows: soil texture - Pipette Robinson method (Carter and Gregorich, 2008), bulk density - Core method, and the particle density of soil (Blake and Hartge, 1986). Biochar and soil chemical properties were detected as follows: pH (H2O) – a portable pH meter (HANA, Germany), soil organic matter (SOM) and total organic C (TOC) – Walkley and Black (1934), total P - Bowman (1988), available P (AP) - Olsen and Sommers (1982), total N – semi-micro Kjeldahl method (Bremner, 1996), anaerobically mineralized N (AN)– a 7-day anaerobic incubation at 40 °C (Keeney and Bremner, 1996), and CEC and exchangeable cations – Thomas (1982).
Rice yield was determined by harvesting from a 2.5 m × 2.0 m area in each plot at physiological maturity and removed unfilled grains by water before sun drying. A grain moisture tester (Riceter f2, Kett Electric Laboratory, Tokyo, Japan) was used to measure moisture content. The presented rice yield was adjusted to a 14% moisture content.
The closed chamber method was used to collect gas samples. A chamber was made from transparent polyvinyl chloride (PVC) panels with a 1.5 mm thickness. The cross-sectional area was 0.25 m2 (0.5 m × 0.5 m). The height of the chamber was 70 cm from the bottom to the top layer. The chamber inside was equipped with a circulating fan, a temperature meter, and a pressure control plastic bag as described in detail by Minamikawa (2015). The chamber was placed on a plastic pre-installed base (a groove 4.5 cm depth) in each plot and sealed off by water before sampling. After chamber closure, a syringe (50 mL) was utilized to take inside gas at 1, 11, 21, and 31 minutes. Then, gas samples were injected into a 20-mL evacuated vial. The gas sampling was carried out from 10 DAS to 73 DAS at 7-day intervals. The concentrations of CH4 and N2O were analyzed with a gas chromatograph (8610C, SRI Instruments, CA, USA) equipped with a flame ionization detector (FID) and an electron capture detector (ECD) for the analysis of CH4 and N2O, respectively. The columns for the analysis of CH4 and N2O were packed with Porapak Q (50–80 mesh); dinitrogen (N2) was used as the carrier gas for both FID and ECD.
Porosity was calculated by dividing volume pores (based on the subtraction between bulk density and particle density of soils) by volume total (Flint and Flint, 2002). CH4 and N2O fluxes were calculated by a linear progression of gas concentration change over time, and total fluxes of CH4 and N2O were calculated using a trapezoidal integration method described by Minamikawa (2015). Global warming potential (GWP) was calculated based on CO2 equivalence (1 CH4 = 34 CO2-eq; 1 N2O = 298 CO2-eq) at a 100-year scale of climate-carbon feedbacks (Myhre et al., 2013). Yield-scale GWP was calculated by dividing the GWP by grain yield (Minamikawa et al., 2021).
One-Way analysis of variance (ANOVA) was used to assess the effects of each biochar on grain yield, gas fluxes, GWP, yield-scale GWP, and soil improvement. The difference of treatments was carried out using Duncan’s method for all pairwise multiple comparison procedures. Linear regression analyses were performed to assess the relationship between Eh change and methane emission. We also analyzed the relationship between biochar application rate and gas emissions. In the statistical analysis, we did not compare the difference between RhB and MB. All analyses were carried out using R stats Version 4.2.0 (R Project for Statistical Computing, RRID:SCR_001905). The results are presented in tabular form with the values including mean ± standard deviation (SD) and the different symbols with a confidence level of 95%. Significant different comparison among treatments was considered at Duncan’s multiple range test (***P < 0.001, **P < 0.01, *P < 0.05 and †P > 0.05) after passing homogeneity of variance.
The mean air temperature and the total rainfall during the experiment were 28.9 °C and 429 mm, respectively (Figure 2). High rainfall was observed between 40-60 and 65-80 DAS. Figure 3 shows that the flooding water regime was predominantly observed during the experimental regression. The trend of water levels variation was similar over treatments. Water was irrigated from 7 DAS, reflooded 3-5 cm from soil surface for fertilizing (9, 23, and 38 DAS), and respective multiple drainage practices (−10 to 5 cm) (Uno et al., 2021) was carried out for the remaining periods. Fifteen days before harvesting (70 DAS), the soil was drained and kept saturated to minimize rice lodging and easy-to-harvest grain. Rice plants flowered and headed during 45-60 DAS.

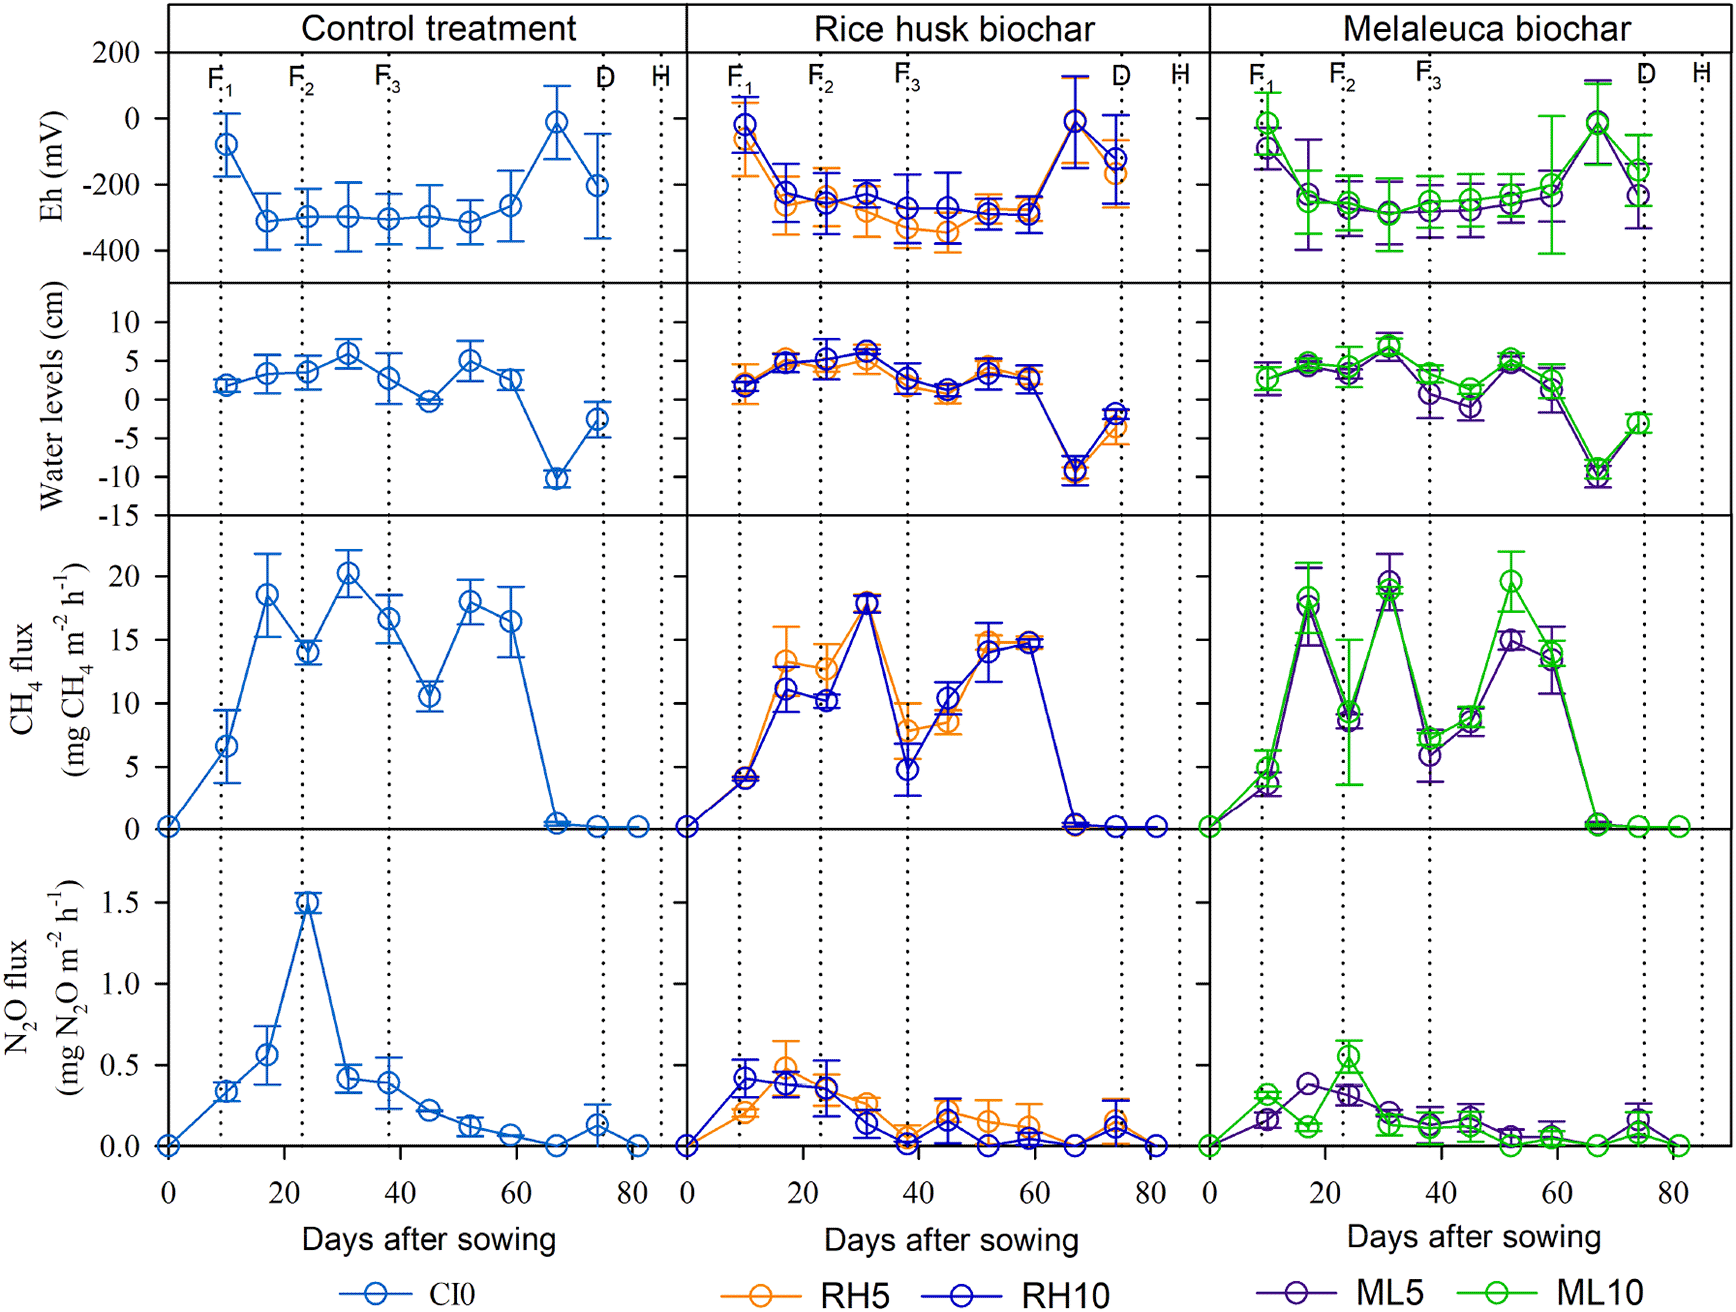
Error bars indicate the standard error (n = 3). Vertical dotted lines illustrate agronomic management of the first, the second and the third topdressing fertilizer (F1, F2 and F3, respectively), drainage (D) and harvest (H).
CH4 emissions gradually increased in the early rice growth stage (0-17 DAS) and almost stopped after drainage (70 DAS) (Figure 3). It should be noted that CH4 flux was predominant in the period from 17 – 59 DAS and several CH4 flux peaks were observed between treatments (i.e., three peaks were observed in MB5 and MB10). Maximum CH4 flux peaks were reached simultaneously in all treatments after 31 DAS. Highest peaks between treatments are represented in a descending way as follows: CT0 > MB5 > MB10 > RhB5 > RhB10. Compared to the CT0 treatment, biochar application reduced total CH4 emissions significantly (Table 3). Particularly, RhB5 and RhB10 mitigated total CH4 flux from 24.2 to 28.0%, respectively, while MB5 and MB10 alleviated between 22.0 and 14.1%, respectively. Irrespective of RhB and MB, the CH4 flux was insignificant with an increasing biochar addition rate from 5 to 10 t ha−1 (P < 0.01). There was a negative linear regression relationship between biochar application rate and total CH4 emission (P < 0.001, r2 = 0.825) (Figure 4). In contrast, the linear regression of melaleuca biochar was poorly explained with increasing biochar amendment rate and total CH4 flux (P = 0.095, r2 = 0.254).
| Treatment2) | Grain (g m−2) | CH4 (g CH4 m−2) | N2O (g N2O m−2) | GWP (g CO2-eq m−2) | Yield-scaled GWP (g CO2-eq m−2) |
|---|---|---|---|---|---|
| CT0 | 498 ± 47.6 | 18.6 ± 0.80aA | 0.39 ± 0.07aA | 749 ± 13.5aA | 1.51 ± 0.13aA |
| RhB5 | 513 ± 56.2 | 14.1 ± 0.23b | 0.29 ± 0.07ab | 566 ± 25.5b | 1.12 ± 0.18b |
| RhB10 | 510 ± 33.0 | 13.4 ± 0.30b | 0.23 ± 0.04b | 524 ± 2.76c | 1.03 ± 0.06c |
| MB5 | 519 ± 9.86 | 14.5 ± 1.00B | 0.24 ± 0.01B | 563 ± 31.6B | 1.09 ± 0.08B |
| MB10 | 517 ± 10.9 | 15.9 ± 0.90B | 0.17 ± 0.07B | 591 ± 10.8B | 1.14 ± 0.44B |
| P value3) | |||||
| CT × RhB | † | *** | * | *** | ** |
| CT × MB | † | ** | ** | *** | ** |
2) CT0, control treatment; RhB5 and RhB10, 5 and 10 t ha−1 rice-husk biochar amendment, respectively; MB5 and MB10, 5 and 10 t ha−1 melaleuca biochar amendment, respectively.
3) Statistical analysis did not compare between RhB and MB. The letters indicate significant difference according to Duncan’s multiple range test (***P < 0.001, **P < 0.01, *P < 0.05 and †P > 0.05). Normal and capital lowercases indicate a significant difference between CT0 vs. RhB and CT0 vs. MB, respectively.

Each symbol represents one replication in each treatment.
N2O was released mainly in the early stage of rice growth in all treatments (Figure 3). The highest N2O flux peaks were observed in the CT0 (24 DAS). All measured values were below 1.5 mg N2O m−2 h−1. As observed, N2O flux flushed mainly during the fertilizing period from 9 to 38 DAS, even though experimental pots were predominantly flooded, especially in the CT0 accounted for 56.8% in total, while RhB and MB varied by 50.6-53.1% and 52.3-47.6%, respectively. Total N2O emission was reduced in RhB or MB applied soil compared to CT0 (Table 3). Specifically, RhB10 significantly reduced by approximately 41.0%, whereas MB5 and MB10 by 38.5 and 56.4%, respectively. However, the reduction of total N2O flux was insignificant in MB5. As a result, there were different negative linear relationships of biochar application rate and total N2O flux (RhB, P = 0.012, r2 = 0.619; MB, P = 0.002, r2 = 0.757) (Figure 4).
Biochar addition to the soil slightly increased rice yield compared to the CT0, but the statistical analysis was insignificant (Table 3). A similar pattern about emissions was seen among GWP, yield-scaled GWP, and total CH4 flux due to CH4 flux was greatest contribute to GWP, yield-scaled GWP. The RhB additions significantly decreased the GWP and yield-scaled GWP by 24.4 – 30.0% and 25.8 – 31.8% for RhB5 and RhB10, respectively. Although MB significantly diminished the GWP and yield-scaled GWP by 24.8 – 21.09% and 27.8 – 24.5%, respectively, there was no significant difference between MB5 and MB10.
A similar performance pattern of soil Eh condition was seen among treatments (Figure 3). Eh reduced after initial irrigation and was seen to reach a stable level (below -250 mV) during the rice growth period from 17 to 66 DAS. Whereas the final drainage rapidly increased the soil Eh condition (73 DAS) in all treatments. The supplementation of RhB and MB obviously improved soil Eh condition compared to the CT0 by 7.44 – 14.5% and 10.7 – 19.0%, respectively (Table 4). There was a negative linear relationship between hourly CH4 flux and the Eh values in RhB (P < 0.001; r2 = 0.552) and MB (P < 0.001; r2 = 0.502) (Figure 5).
| Treatment2) | pH | Eh3) (mV) | Bulk density (g cm−3) | Porosity (%) | SOM (g kg−1) | AP (mg kg−1) | AN (mg kg−1) |
|---|---|---|---|---|---|---|---|
| CT0 | 4.69 ± 0.10 | -242 ± 12.3cB | 0.97 ± 0.10aA | 53.3 ± 0.75bB | 31.8 ± 0.36cC | 19.0 ± 3.95B | 10.7 ± 1.03bB |
| RhB5 | 4.81 ± 0.21 | -224 ± 6.12b | 0.78 ± 0.04b | 61.5 ± 7.20ab | 43.2 ± 2.08b | 21.8 ± 3.48 | 15.5 ± 0.52a |
| RhB10 | 5.26 ± 0.64 | -207 ± 2.13a | 0.74 ± 0.13b | 65.1 ± 2.07a | 47.6 ± 1.13a | 25.2 ± 4.04 | 14.8 ± 0.60a |
| MB5 | 4.82 ± 0.13 | -216 ± 16.3A | 0.75 ± 0.06B | 55.5 ± 1.92A | 39.1 ± 3.03B | 25.1 ± 2.81AB | 14.5 ± 1.10AB |
| MB10 | 4.68 ± 0.17 | -196 ± 5.78A | 0.71 ± 0.05B | 62.9 ± 4.19A | 45.0 ± 1.30A | 28.8 ± 2.79A | 16.6 ± 2.97A |
| P value4) | |||||||
| CT × RhB | † | * | * | * | *** | † | *** |
| CT × MB | † | * | *** | * | *** | * | * |

Table 4 represents the soil characteristic differences between treatments at the time of harvest. Overall, although biochar amendment was seen to increase soil pH slightly, statistical analysis implied no significant difference between treatments. Yet, biochar amendment significantly reduced the soil bulk density (RhB5, 19%; RhB10, 23%; MB5, 22.7% and MB10 26.8%) and ameliorated the soil porosity (RhB5, 8.2%; RhB10, 11.8%; MB5, 2.2%, and MB10 9.6%). However, increasing RhB and MB biochar application rate from 5 to 10 t ha−1 did not significantly change soil bulk density and porosity. Moreover, intensifying biochar incorporation significantly increased SOM by 38.6 – 52.7% for RhB and 25.4 – 45.9% for MB. Notably, AN in biochar-applied treatments was higher than that of the CT0 by 44.8 – 38.3% and 35.5 – 55.1% for RhB and MB, respectively. AP significantly increased in the MB treatments by 32.1 – 51.58% but did not in RhB. Although additional biochar increased the available and mineralized nutrients, statistical analysis results showed no significant difference between biochar application rates of 5 to 10 t ha−1 (Table 4) (Tran Sy et al., 2021).
Conventional practices without biochar application released 18.6 g CH4 m−2 and 0.39 g N2O m−2 (Table 3). These values are in accordance with previous findings conducted in the VMD (Vo et al. 2020; Minamikawa et al. 2021; Uno et al. 2021). Notably, RhB and MB amendments under typically local water management, and conventional practices significantly reduced CH4 flux by 24.2 % in RhB5, 28.0 % in RhB10, 22.0 % in MB5, 14.1 % in MB10 and N2O flux by 38.5 % in RhB5, 56.4 % in RhB10, 25.6 % in MB5, 41.0 % in MB10, and slightly improved rice yield (2.41-4.21%) (Table 3). Similarly, Yang et al. (2019) demonstrated that biochar additions (20 - 40 t ha−1) under controlled irrigation in the Taihu Lake region, China mitigated both CH4 and N2O emissions by 35.7% and 21.5%, respectively, and simultaneously enhanced rice yield by 16.7-24.3%. Moreover, Wu et al. (2019b) reported that biochar additions (20 - 40 t ha−1) significantly decreased CH4 and N2O fluxes by 11.2-17.5% and 19.5-26.3%, respectively, and increased grain yield by 7.9-9.2%. In line with our findings, a long-term biochar application (5 – 10 t ha−1) in China's typical double rice plantation region also significantly decreased CH4 flux by 26.18% (Qin et al. 2016). Nevertheless, Wang et al. (2011) reported that the biochar incorporation (50 ton ha−1) into the soil significantly decreased N2O flux by 41.4-93.5% in lab-scale experiments. In parallel, a meta-analysis based on 30 studies with 261 experimental treatments (lab-scale and pilot-scale) from 2007 to 2013 demonstrated that the addition of biochar reduced N2O emissions by 54% (Cayuela et al. 2014). However, Koyama et al. (2015) reported that biochar application (10-40 t ha−1) reduced CH4 flux but did not N2O. In the case of Liu et al. (2014), biochar supplementation (24-48 t ha−1) significantly reduced CH4 flux by 33.9-40.2%, while N2O flux significantly increased by 150 to 190%. Overall, biochar amendment could reduce CH4 flux from a rice paddy field, but in some cases, the effect on N2O flux remains uncertain. Our study demonstrated that rice husk and melaleuca biochar applications with a range of 5-10 t ha−1 significantly reduced both CH4 and N2O fluxes within a Thionic Glycesol soil in the VMD. Albeit, the biochar application rate between 5 and 10 t ha−1 hardly obtained the disparity of CH4 and N2O emissions. Thus, a wide range of biochar application amounts should be evaluated to provide more tailored recommendations.
The CH4 mitigation by biochar application consistently pertains to the increasing soil oxidation rate and methanotrophs community. Although we did not determine the number of methanogens and methanotrophs, Nan et al. (2021) demonstrated that biochar application stimulates the abundance in either methanogens or methanotrophs, with a high amount of methanotrophs detected in most cases resulted in decreasing of CH4 flux. Moreover, Wu et al. (2019a) reported that biochar applications to fertilized paddy field soils increased the total type I pmoA (preferred the CH4 environment) and type II pmoA (more dynamic in low CH4 conditions) methanotrophs compared to non-amended biochar, indicating that CH4 flux mitigation by promoting potential CH4 oxidation. Thus, we adopted a hypothesis that the balance of activities between methanogens and methanotrophs in a site-specific environment results in either an increasing or decreasing CH4 flux. Feng et al. (2012) revealed the main mechanisms of CH4 flux reduction in a biochar-supplemented field were by (1) increased methanotrophic proteobacterial abundance significantly and (2) decreased the methanogenic to methanotrophic proportion substantially. Thus, an increase of methanotrophs dynamic in paddy field soil by biochar addition can be expected to play a vital role in mitigating CH4 fluxes. Our study demonstrated that rice husk and melaleuca biochar could promote low-GHG emissions in the rice production system in the VMD.
We achieved N2O flux reduction by incorporating biochar into the topsoil layer when compared to the non-amended biochar field. However, several hypotheses supposed that soil applied with biochar could not decrease the N2O flux (Koyama et al., 2015; van Zwieten et al., 2010). Similar to our field study, several findings achieved a total N2O flux reduction (Shaukat et al., 2019; Zhang et al., 2010). The mitigation of N2O flux in biochar-treated soils could be attributed to soil moisture contents and nitrification processes (Ameloot et al., 2016). In agreement with the hypothesis, Shaukat et al. (2019) demonstrated that fields with biochar added retained 9-14% higher moisture contents than fields without biochar amended and resulted in a significant reduction of the N2O flux. Supporting the idea, Wang et al. (2013) revealed the relationship between the denitrifying community and N2O flux change, where biochar supplementation significantly shifted the abundance of NO3-utilizing bacteria (carrying the nirK and nirS genes), leading to less N2O generation and more N2O-consuming bacteria (carrying the nosZ gene). Moreover, Cayuela et al. (2013) used 15N gas-flux to observe the reduction of N2O/(N2+N2O) and demonstrated that biochar facilitated the last step of denitrification. The key mechanisms of N2O flux reduction under biochar amendment were by (i) stimulated nitrification generation via electron donation, a decrease in total denitrification by serving as an alternative electron acceptor by acting as electron shuttle to soil NO3− consuming microorganisms (Cayuela et al., 2013), and (ii) based on the entrapment of N2O in water-saturated soil pores and co-occurrent stimulation of microbial N2O reduction deriving in an overall decrease of the N2O/(N2O + N2) ratio (Harter et al., 2016). Therefore, biochar could be attributed as a decisive factor to inhibit N2O production and simultaneously stimulate N2O utilization. As such, these findings and the above-discussed mechanisms strongly support our findings in suggesting N2O flux reduction from biochar amendment in the rice paddy field.
Our study showed that N2O emission was mainly concentrated during fertilization, which indicates fertilization provides more available N driving for soil N2O emission. Xie et al. (2013) observed 15N abundance significantly intensified by the application of 15N-enriched urea. Our study did not measure NH4+ or NO3− concentration during fertilizing, so the mechanism remains uncertain. N2O emission via the nitrification process directly pertains to soil physical, chemical, and biological properties (Huang et al., 2019). Thus, we speculate that N fertilizing increased the nitrification activities and stimulated the strong metabolism of potential N2O-producing bacteria. Minamikawa et al. (2021) reported that higher N availability levels in soil than rice plant uptake demands resulted in increasing N2O emissions. Although N-fertilizing obviously promoted N2O emissions for the majority of the time, N2O emission peaks of biochar-amended soil were lower than that of biochar-unamended soil. This would indicate that biochar potentially changed the functionality and diversity of denitrifiers within the soils and inhibited the conversion of NO2− and NO3− to N2O (Zhang et al., 2010).
Water management is a crucial factor in the strategy of GHGs reduction, although we achieved the GHGs reduction under typical water management when most of the time the soil was flooded. Multiple-flooded times in this study were due to the combination of high rainfall in the transition season (rainfall, Figure 2; water level, Figure 3) and the typical flooding water management practice of the farmers in the region. Uno et al. (2021) conducted a 2-year field experiment in An Giang province in the VMD and demonstrated that AWD (known as multiple drainages) significantly reduced CH4 by 35%, while found no difference in N2O emissions, but a 22% yield improved. Moreover, Minamikawa et al. (2021) registered that the intermittent irrigation technique is also a promising approach to mitigate CH4 emissions by reductive soil conditions. Thus, integrating AWD and intermittent irrigation by incorporating biochar into the soil under the MD’s edaphology, climate, and traditional practices could be feasible for further works.
There is a negative correlation between CH4 flux and RhB application rate (P < 0.001, r2 = 0.825) (Figure 4). It is indicated that CH4 flux decreased with the increase of rice-husk biochar application (Xiao et al. 2018). On the other hand, although increasing MB application rate could mitigate the CH4 emission, the relationship found a poor explanation (P = 0.095, r2 = 0.254). This contrast could be partly attributed to biochar-carbonized properties. MB was low in the specific surface area and total pore volume compared to RhB (Table 1). Ji et al. (2020) revealed that biochar structure intimately related to anaerobic CH4 oxidation and created a suitable environment for CH4-consuming bacteria.
Similarly, we found a negative correlation between the N2O flux reductions and the application rate of RhB (P = 0.012, r2 = 0.619) and MB (P = 0.002, r2 = 0.757). In agreement with our finding, a meta-analysis of Cayuela et al. (2014) showed a negative relationship between biochar application rates and reduced N2O flux, where sufficient N2O reduction was 1-2% biochar amendments, whereas, incorporating more than 10% of biochar into the soil was found to reach up to 80%. In line with our study, Huang et al. (2019) also showed a negative relationship between biochar application rates and N2O flux. Overall, the increase of biochar application rates could potentially stimulate the CH4 and N2O reduction. However, for CH4 and N2O fluxes, the application of 5 and 10 t ha−1 remains unclear.
Our study found that the negative linear relationship between soil Eh and hourly CH4 flux with RhB (P < 0.001; r2 = 0.552) and MB (P < 0.001; r2 = 0.502) (Figure 5). Similar results were also observed by Wang et al. (2018). This indicates that an increase of soil redox potential decreased CH4 emission, which is in line with the report by Towprayoon (2020). Moreover, soil Eh remained below −250 from 17 to 66 DAS in our study (Figure 4), implying a favorable condition for CH4 emission (Wang et al. 1993). Final drainage rapidly increased soil Eh and reduced CH4 flux (Figure 3), indicating the strong sensibility of soil Eh and CH4 flux under water management.
Biochar application increased soil Eh compared to non-amended soils (Table 4). This indicates that biochar was the critical factor contributing to the positive effects of anaerobic CH4 oxidation activities known as the electronic accepting capacities (EAC) of biochar (Nan et al., 2021). The supplementation of biochar intensifies oxygen-containing functional groups (carboxyl, carbonyl, quinone phenolic hydroxyl group) and positively improves biochar redox potential (Klüpfel et al. 2014; Wu et al. 2016). The increase of Eh and the reduction of CH4 emissions could also be explained by the porosity and absorbability characteristics of biochar, which enable robust CH4-utilizing bacteria activities and intensify the diffusion and metabolism process. In a similar way, biochar incorporation into soils improves soil aeration, creating a favorable environment for methanotrophic bacteria resulting in soil Eh amelioration and better reduction of CH4 oxidation (Feng et al., 2012).
Although biochar amendments could improve yield (2.41-4.21%) (Table 3), multiple comparison analyses found no significant difference between amended and unamended soils. Several studies have found similar results (Qin et al. 2016; Nguyen et al. 2016). The undistinctive grain yield could be partly attributed to spatial and temporal variations, i.e., climatic conditions, field practices, soil substrates (Xie et al. 2013).
Biochar-amended soil significantly decreased GWP by 21.1-30.0% and yield-scaled GWP by 24.5% - 31.8% (Table 3). It was indicated that RhB and MB application potentially mitigates total CH4 and N2O emissions without scarifying grain yield. Yang et al. (2019) performed a double-season field experiment on biochar applications ranging from 20 to 40 t ha−1 and found that the average GWP and yield-scaled GWP reduced by 18.7% - 16.4%, and 80.3% - 41.6%, respectively. Similarly, Zhang et al. (2019) observed a six-year field experiment on biochar-applied soils at rates of between 20-40 t ha−1 and showed a GWP and yield-scaled GWP reduction by 12.1-18.4% and 35.9-56.4%, respectively. Here we observed that CH4 flux was the key contributor in the GWP and yield-scaled GWP via the field experiment in the VMD’s transition season, while N2O flux was more neglectable. Thus, future works should emphasize on reducing the GWP, yield-scaled GWP, and concentrate on the CH4 mitigation technology solutions rather than N2O emissions.
Soil improvement under short-term and long-term biochar applications has been widely recognized. Our study showed that biochar amendment insignificantly increased soil pH (Table 4), which indicated no effect of biochar addition on soil pH perfection as suggested by previous studies (Yang et al., 2019). However, biochar amendment significantly decreased the soil bulk density and improved soil porosity in comparison to non-amended soils. Furthermore, higher applied biochar rates showed lesser soil bulk density and higher porosity indicating that biochar directly upgraded soil physiology. Amelioration of soil surface area and porosity by biochar amendment intensifies soil aeration and functions of aeration, such as CH4 oxidation, and provides habitat for methanotrophs (Nan et al., 2021). Moreover, it stimulates NH4+ absorbance ability resulting in suppressing nitrification processes and N2O flux reduction in the field (Wang et al., 2020).
It is evident that increasing biochar application boosted SOM and AN, with a slightly increased available P through the season (Table 4). The increase of SOM and AN showed a high nutrient availability in the soil. Notably, the soil improvement did not increase soil CH4 and N2O emissions as above-mentioned and discussed. AN could be used as a soil health indicator (García et al., 2020). The interdependence among AN, SOC, and particulate OC was demonstrated by a positive correlation (Domínguez et al., 2016). In connection with our study, Yang et al. (2019) observed that biochar amendment slightly increased SOC, significantly increased NH4+ by 47.7%, and significantly decreased NO3− by 30.4%. Incorporating biochar into soils could inhibit nitrification and produce more NH4+ than NO3− consisting of an anoxic environment (water level and redox potential; Figure 2). Increasing NH4+ concentrations and declining NO3− concentrations would partly explain the enhanced CH4-consuming figure and N2O oxidation (Xiao et al., 2018). Overall, biochar application offers benefits not only for nutrient availability but also for GHGs mitigation.
This study assessed the effects of rice husk biochar or melaleuca biochar amendment at 5 or 10 t ha−1 on CH4 and N2O emissions and the physiochemical soil properties after rice cultivation under typical water management and conventional practice regime in the VMD. Incorporating biochar into soils significantly mitigated CH4 and N2O emissions without reducing grain yield. Consequently, a lower GWP and yield-scaled GWP from biochar-amended soils were achieved. Although higher biochar applications decreased CH4 and N2O emissions, there was no significant difference between biochar-amended rates. Biochar significantly increased soil Eh conditions. There was a negative linear relationship between soil Eh and CH4 emission rate for biochar-applied fields. N2O emissions from biochar fields were relatively low and mostly concentrated during the fertilization period. Biochar amendments improved soil fertility via physical properties of soils by decreasing bulk density and intensifying porosity and the chemical characteristics of the soils by ameliorating SOM, AN and AP, but did not affect soil pH. Similar to GHG emissions, biochar application rates of between 5 and 10 t ha−1 could not obtain significant soil improvement. This study will help lower-GHG emissions from rice farming practices in the VMD. Further works should study the combination of biochar-application rates and effective water irrigation techniques on different soils in the VMD.
Figshare: Biochar reduces GHGs from paddy fields. https://doi.org/10.6084/m9.figshare.16625137.v1 (Tran Sy et al., 2021).
This project contains the following underlying data:
Data are available under the terms of the Creative Commons Zero “No rights reserved” data waiver (CC0 1.0 Public domain dedication).
| Views | Downloads | |
|---|---|---|
| F1000Research | - | - |
|
PubMed Central
Data from PMC are received and updated monthly.
|
- | - |
Provide sufficient details of any financial or non-financial competing interests to enable users to assess whether your comments might lead a reasonable person to question your impartiality. Consider the following examples, but note that this is not an exhaustive list:
Sign up for content alerts and receive a weekly or monthly email with all newly published articles
Already registered? Sign in
The email address should be the one you originally registered with F1000.
You registered with F1000 via Google, so we cannot reset your password.
To sign in, please click here.
If you still need help with your Google account password, please click here.
You registered with F1000 via Facebook, so we cannot reset your password.
To sign in, please click here.
If you still need help with your Facebook account password, please click here.
If your email address is registered with us, we will email you instructions to reset your password.
If you think you should have received this email but it has not arrived, please check your spam filters and/or contact for further assistance.
Comments on this article Comments (0)