Keywords
biplot, crime analysis, k-means clustering, multivariate analysis, principal coordinates analysis
biplot, crime analysis, k-means clustering, multivariate analysis, principal coordinates analysis
Lack of meaningful crime data has existed as a social problem for many years in Mexico City. However, there is a growing interest in extracting useful knowledge from data related to crime reports. Crime analysis is a major problem due to the lack of trust in authorities and insufficiency of data. Therefore, statistical methods and applications of pattern discovery are necessary to study the impact of crime on communities. In this regard, it would be necessary and advisable to provide important insights into data crime analysis (Chadee et al., 2019). Hence, it could conceivably be hypothesized that these results could be used to prevent crime and to develop tailored strategies to tackle crime and gradually build community trust.
It should be noted that this type of research involves a multidisciplinary approach i.e., different academic disciplines including social sciences, statistics, economics, and data science are combined to provide the necessary knowledge, skills, and confidence to analyze and compute data related to crime. Thus, statistics becomes a fundamental discipline to gain insights in terms of displaying, analyzing, interpretating, and presenting data.
This manuscript reviews the evidence for official crime data in Mexico City with the aim to determine the extent of crime occurrences and identify statistical features that permit us to establish variables that can provide the basis for quantitative characterization of crime reports (D’ancona and Ángeles, 1999). It is hoped that this research will contribute to a deeper understanding of crime analysis through the data availability provided by the government of Mexico City (Procuraduría, 2018).
Recently, researchers have shown an increased interest in data collection methods to predict and analyze criminal behavior (Aghababaei and Makrehchi, 2016; Malleson and Andresen, 2015; Wang and Gerber, 2015). However, most of these studies have been carried out in the U.S.A. (Chen, Cho, and Jang, 2015; Flores, 2017; Yadav et al., 2019; Yang et al., 2018). Another interesting study was based on methamphetamine-related crime using Google trends (Gamma et al., 2016). Similarly, there is a growing body of literature that recognizes the importance of using social networks analysis as data sources (D’Avanzo et al., 2017). Recently researchers have examined the effects of crime patterns and antisocial behavior in Mexico City through Big Data-driven models for predicting crime rates (Piña-García and Ramírez-Ramírez, 2019).
In Mexico City, there is an urgent need to address the safety problems caused by antisocial behavior. In this context, the main disadvantage of crime analysis in Mexico City is the lack of trust in authorities and insufficiency due to a lack of reliable data. Another common obstacle faced by many researchers is the inaccurate way in how crime reports in Mexico City have been recorded. Most of these records show a low-quality dataset that involves significant issues such as: missing data, human errors, and inconsistencies in crime information. Despite the limitations mentioned above, it is still possible to obtain and identify the variability of crime trends (Arango, 2003).
It is important to note that traditional surveys are still an acceptable and reliable proxy to explore opinion about crime occurrence among citizens. These studies are mainly carried out by the National Survey of Victimization and Perception on Public Safety1 [ENVIPE], the Victimization and Institutional Effectiveness Survey2 [ENVEI], the National Institute of Statistics and Geography3 [INEGI] and the Center for Educational Research and Development4 [CIDE] (Bergman and Sarsfield, 2009; Jasso López, 2013; Vilalta-Perdomo, 2010). In this regard, there is still uncertainty in these surveys-based studies as they may be biased due to inaccurate information e.g., false rumors, fake news, and hoaxes (Cisneros and Cunjama-López, 2011).
It was after the Mexico City elections in 2018 and the open data initiative proposed recently by the Mexico City government that it was possible to gain access to crime reports committed from Jan 2019 - Jun 2019 (Piña-García and Ramírez-Ramírez, 2019). This dataset shows a significant enhancement in terms of data structure, updated information, geolocated info, and computing performance. By providing a new approach mainly based on an open policy, the Mexico City government have released a significant amount of data related to crime reports that contain information such as date, location, and category of crime, among others.
Much of the previous research on crime analysis has been exploratory in nature. A significant analysis and discussion paper on the subject was presented by Fuentes-Flores and Sánchez-Salinas (2015). This research examined the use of institutional data to provide information on crime activity. Likewise, one longitudinal study found that homicide prevalence is associated to those places located around areas that are not occupied or lived in by people (Fuentes-Flores, 2015). Auto parts theft has been linked to social aspects such as: lack of scholars degree (lack of further education) and density of population (Sánchez-Salinas and Fuentes-Flores, 2016). In addition, Vilalta (2011) examined the trend in auto parts theft and described its regular fluctuations along short periods of time. In a previous study (Vilalta-Perdomo, 2009), it was observed that firearm carrying, the hour of the day, and offender prevalence were linked to the degree of violence displayed in criminal aggressions.
It is important to note that previous studies on crime exploration have highlighted several social factors such as: friendship networks on a local level, social relegation, ethnic and racial characteristics, and breakdown of parental relationships (Kubrin and Weitzer, 2003; Sampson and Groves, 1989; Felson and Clarke, 1998).
To better understand the mechanisms of crime patterns and its effects, Clarke (2016) analyzed data from the routine activity theory perspective to determine how crime occurs when three elements converge: (1) a motivated offender, (2) a suitable target, and (3) the absence of a capable guardian.
This study systematically reviews the Mexico City crime data with the aim to evaluate the impact of crime occurrence in an in-depth statistical analysis to identify spatio-temporal patterns of crime. In addition, this manuscript attempts to show that there are crime categories with a high rate of concentration. Thus, this research should make an important contribution to develop and encourage tailored strategies to tackle crime, and to evaluate government programs or policies related to crime prevention (Bandrés and Díez-Ticio, 2001).
The rest of the paper is structured as follows. The methods section is concerned with the techniques that are used in the statistical analysis for this study. Preliminary results will be given in a systematic and detailed way in the results section. Finally, a summary explaining the significance of these findings will be highlighted in the conclusions section.
One of the most well-known tools for identifying historic data, patterns, and trends is descriptive analytics. These analytic techniques are intended to identify measure of central tendency and statistical distribution. Moreover, there are methods such as principal co-ordinates analysis (PCoA) and K-means clustering that may be useful when a-priori knowledge is vague and cannot be fully described. These two techniques mentioned above will be our proposed framework for this study.
The biplot graph in the context of principal coordinates analysis is one of the more practical ways of displaying observations and variables of multivariate data in the same plot (Gabriel and Odoroff, 1990; Gower, 1966). In this regard, samples are displayed as points while variables are displayed either as vectors, linear axes, or nonlinear trajectories. In the case of categorical variables, category level points may be used to represent the levels of a categorical variable (Pambabay-Calero et al., 2018).
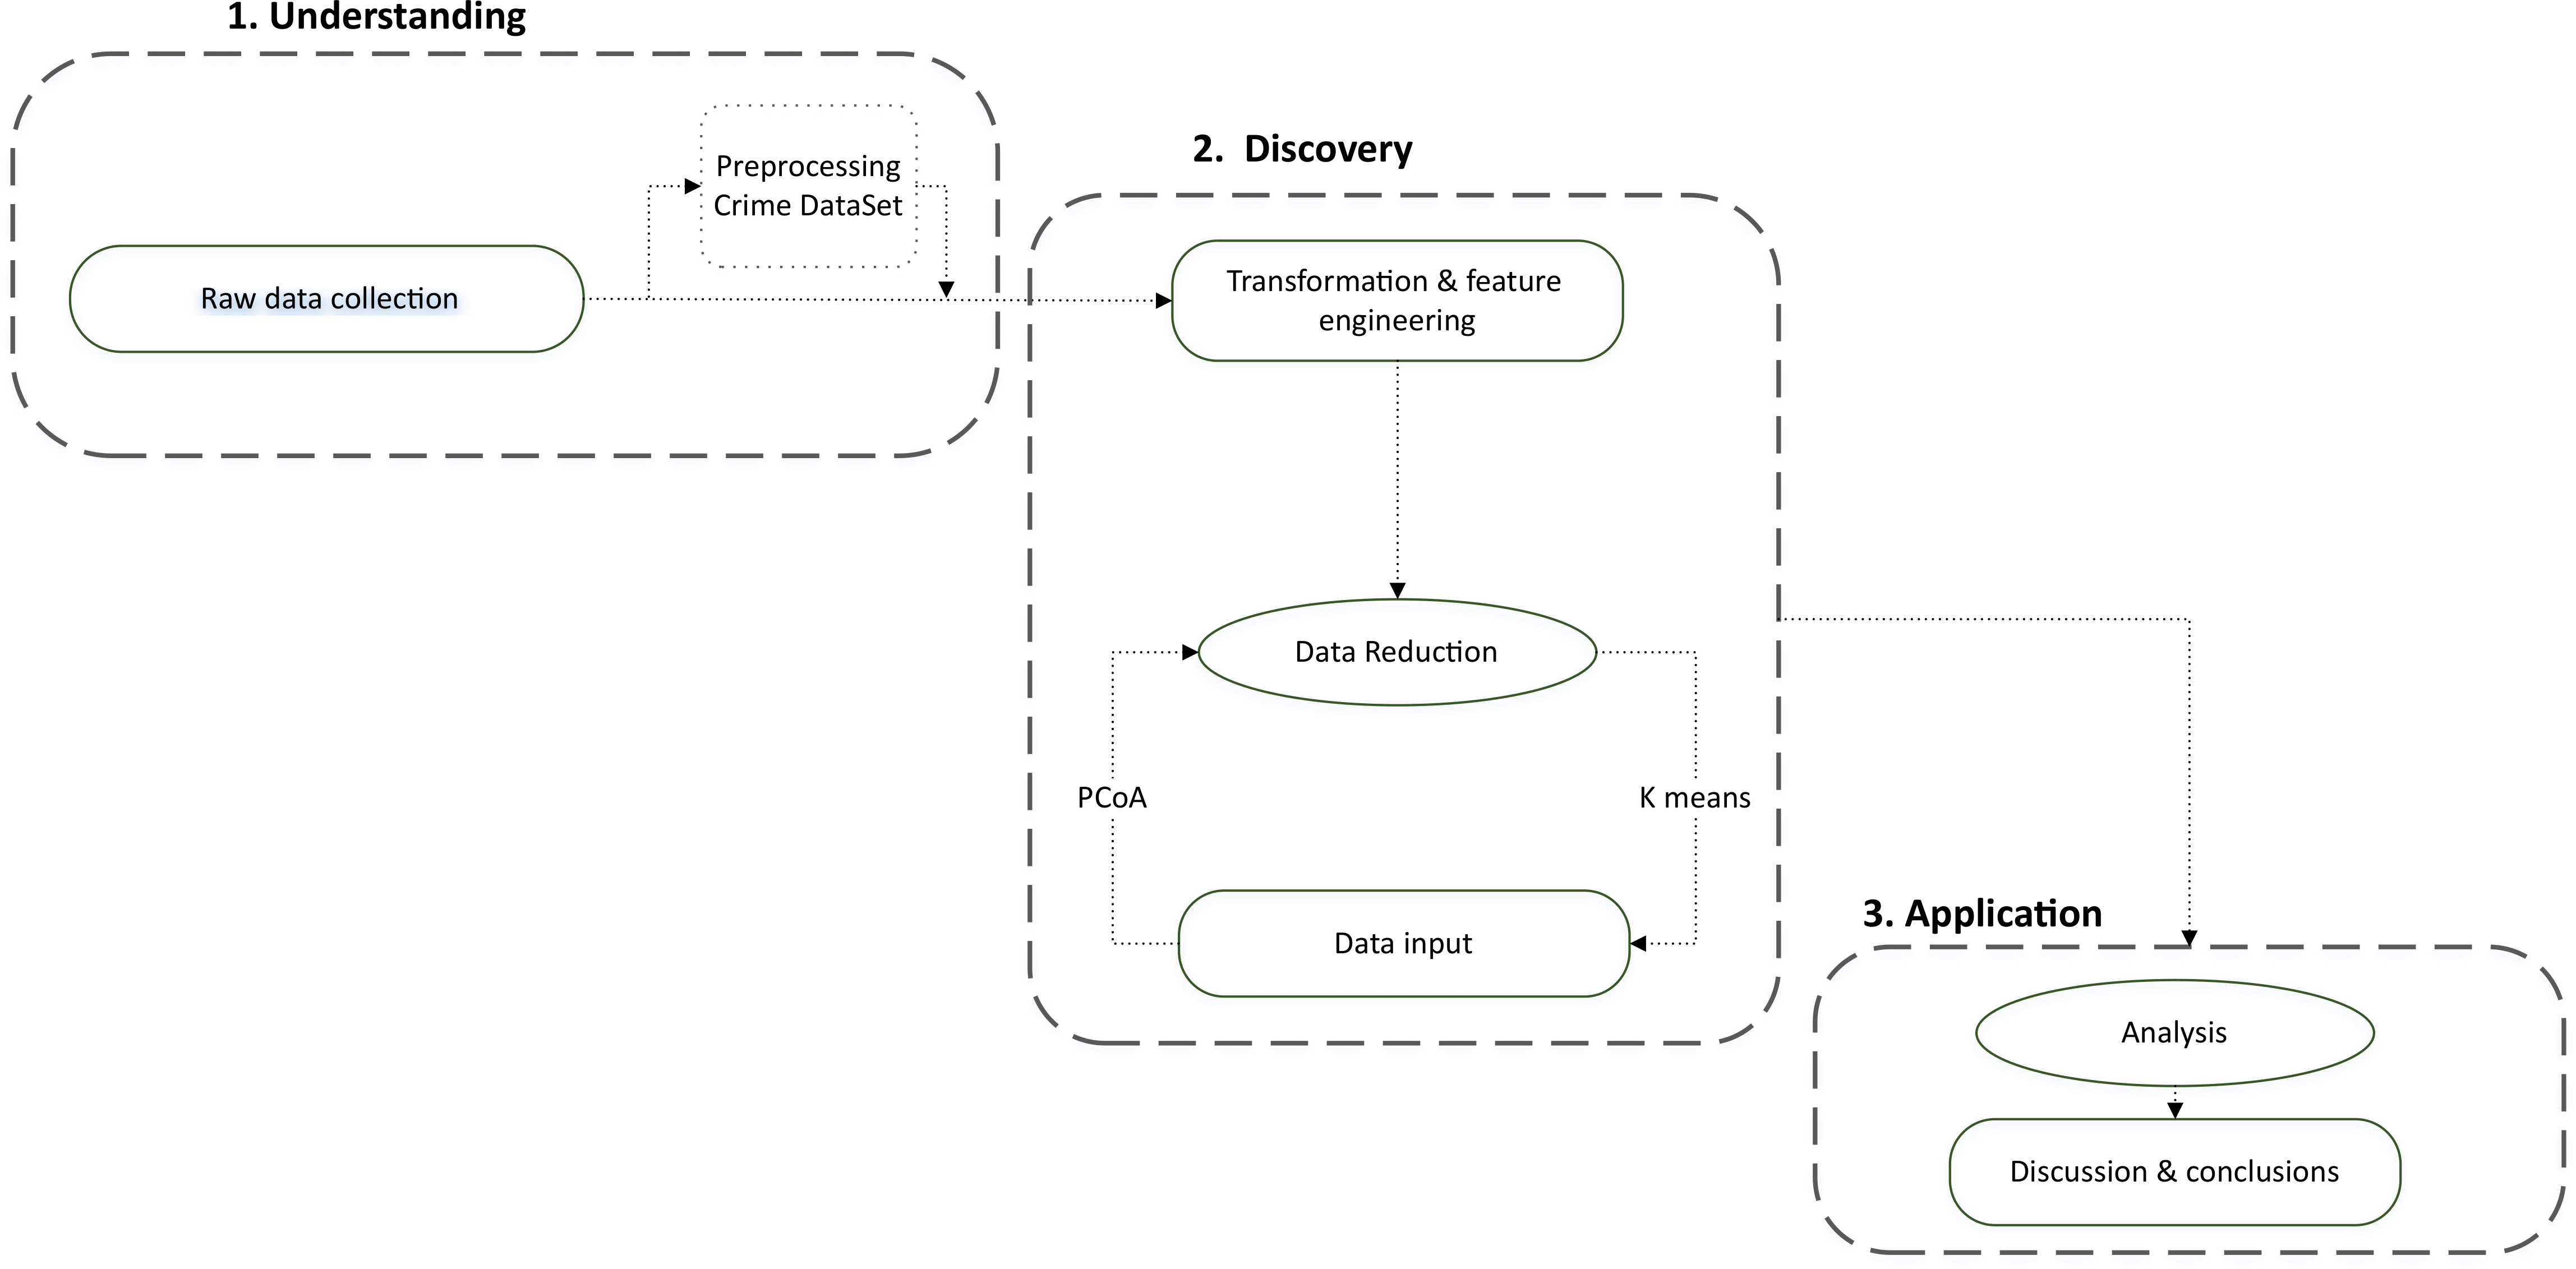
In order to identify antisocial behavior and crime patterns, the Mexico City Police Department recorded 115,209 offenses from January 2019 to June 2019 through the Portal de Delitos del Departamento de Policía de la Ciudad de México web page.5 This information related to crime reports was made accessible to the public and shared via (Procuraduría, 2018). The procedure for generating the data was as follows:
Figure 1 provides a flowchart about our three stages approach: 1. Understanding, data gathering, and preparation from the Portal de Datos de la Ciudad de México web site (in order to get the data in the best format for multivariate statistical analysis). The data were organized in such a way that the variables were the columns and the observations (crime report) as rows. The first row represented the variable titles. Also, the data set has an identifier (research folder code); 2. Discovery, data cleansing, filtering, and transformation (dealing with missing values, dealing with outliers, correcting typos, grouping sparse classes, dropping duplicates). In this step, the identified data errors are corrected to create complete and accurate data sets that are ready to be processed and analyzed. For example, faulty data was removed or manually fixed, missing values are filled in, and inconsistent entries are harmonized. 3. Application, analysis using PCoA and K-means, discussions, and conclusions (visually analyze the results of the clustering using the rstudio software (R Core Team, 2018) and drawing a rough conclusion on how k-means clustering and PCoA performs on dataset).
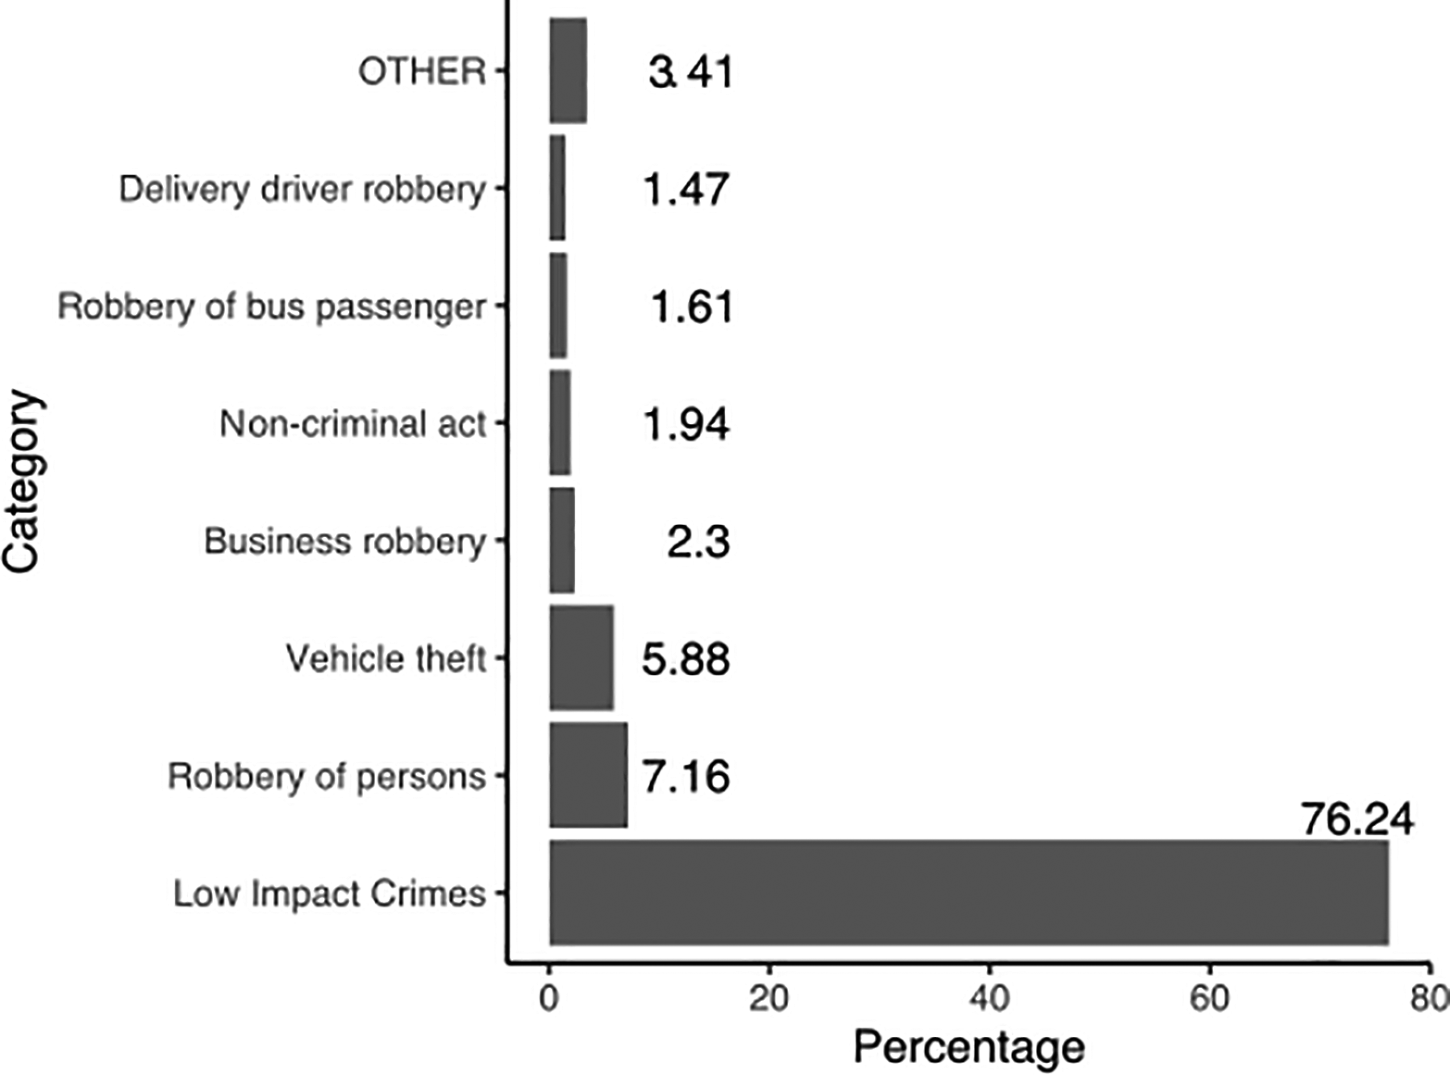
We analyze the impact of low impact crime in Mexico City based on 25 official categories identified from the Mexico City FGJ investigation reports: abuse of power (AOPOW), abuse of trust (AOTRU), assault and battery (AABAT), burglary of home (BOHOM), business burglary (BOBUS), dispossession (DISPO), domestic violence (DOVIO), extortion (EXTOR), forgery of public documents (FOPDO), fraud (FRAUD), identity theft (IDTHE), injuries caused by a crash due to negligent or reckless driving (ICDRV), low impact crime (LOW), malicious property damage (MPDAM), minor drug trafficking (MDTRA), sexual assault (not rape) (SEXAT), negligent or reckless damage of a vehicle while driving (DADRV), robbery of minor belongings (PTHEF), petty theft of property inside a vehicle (THOVE), robbery to passenger of public transport with violence (RPVIO), robbery to passenger or driver of a private vehicle with violence (RVVIO), theft of auto-parts (THAPA), theft of bicycle or similar (THBIC), threats (THREA), and other offenses (OTHER). 25 categories were selected as five categories had very low percentages and were therefore categorized together into other offences (OTHER). We compare and analyze how people report a crime through the traditional system of the Mexico City Police department K-means Clustering via Principal Component analysis and using multivariate statistical analysis (see extended data, Table 1 for abbreviations) (Pambabay-Calero, 2021).
Due to a large number of crime categories, in this study, we will use treemap graphs, which are perfect for displaying large amounts of hierarchical structure data (tree structure). This diagram is ideal for displaying hierarchies since it presents information in a compact and space-saving way.
A data set with 115,209 records was collected from the Mexico City police department reports were used for multivariate statistical analysis (Pambabay-Calero, 2021). The data set consisted of the following variables: year of the crime, month of the crime, day of the crime, crime, crime category, boroughs, prosecutor's office, time of the crime, sex of the victim, and age of the victim. The following variables were excluded from the analysis: agency, investigation unit, the neighborhood of the crime, street of the crime, longitude and latitude, as they did not provide relevant information for the present study.
PCoA provides a means of exploring and visualizing similarities or dissimilarities of data. One advantage of PCoA is that it starts with a similarity matrix or dissimilarity matrix and assigns for each item a location in a low-dimensional space (Kruskal, 1964a, 1964b) by means of a biplot. For this study, axis 1 (PCoA1) characterizes the municipalities where the highest number of crimes occur, and axis 2 (PCoA2) shows the municipalities where the occurrence of crimes is very low. The term biplot refers to the simultaneous consideration of both the column space and the row space of the data matrix X. In general terms, the PCoA algorithm is mainly based on a classical approach related to multidimensional scaling (MDS) (Wickelmaier, 2003), where the main purposes are the following.
• To represents the similarities of data as distances in space (coordinates) to make them accessible to visual inspection and exploration.
• To verify if the differences, which distinguish some objects from others, are reflected in the representation obtained.
• To discover the relevant dimensions, present in the similarities.
• To explain the criteria of the similarities in terms of a rule that "emulates" a particular type of distance.
In this regard, we follow the traditional algorithm where matrix X (data matrix) can be derived into B = XX′ = LΛL′ through singular value decomposition, where Λ represents the diagonal matrix of the eigenvalues of B, and L the normalized eigenvector matrix. The procedure can be summarized in the following steps
• Compute the distance matrix D and D2 (or also the dissimilarity matrix ∆ and ∆2).
• Apply the double centering on the matrix to obtain the matrix B, i.e.,
• Obtain the eigenvalues of B, according to the spectral decomposition, i.e., B = XX′ = LΛL′.
• Let r be the dimensionality of the solution. The matrix ∆1 denotes the diagonal matrix with the first r positive eigenvalues and L1 the first r columns of L. Then the coordinate matrix, from the scaling, is given by
Traditionally, crime data has been assessed by measuring clustering analysis. Thus, we carried out a k-means clustering method with the aim to find clusters of comparable spatial extent. In this context, this manuscript followed the algorithm proposed in Joshi, Sabitha, and Choudhury (2017). The procedure consists of finding the partition with the smallest error, moving individuals from one cluster to another until the reduction of the partition error stabilizes. In short, it is a matter of relocating the individuals so as to obtain clusters with the lowest possible variability. The following is the strategy followed by k-means.
• Choose the first k objects in the sample as the initial k sets of mean vectors.
• Choose the most distant objects.
• Start with a value of k as large as necessary and proceed to form centroids of the groups spaced at a multiplot of standard deviation on each variable.
• Label the objects from 1 to n and choose the ones marked with the following numbers .
• Choose k and the initial group configuration based on prior knowledge of the problem.
The following variables were used for this algorithm: days of the week, sex of the victim, category of the crime, and age group. For the selection of the number of clusters, we analyzed the silhouette coefficient (Yuan and Yang, 2019), which shows that, with six clusters, the data are correctly adjusted.
In order to understand how crime patterns occur in Mexico City, a series of measurements were performed. First, a percentage analysis on the principal official crime categories was depicted in Figure 2, where low impact crime (LOW) showed the highest percentage (see extended data, Table 1 for abbreviations) (Pambabay-Calero, 2021).
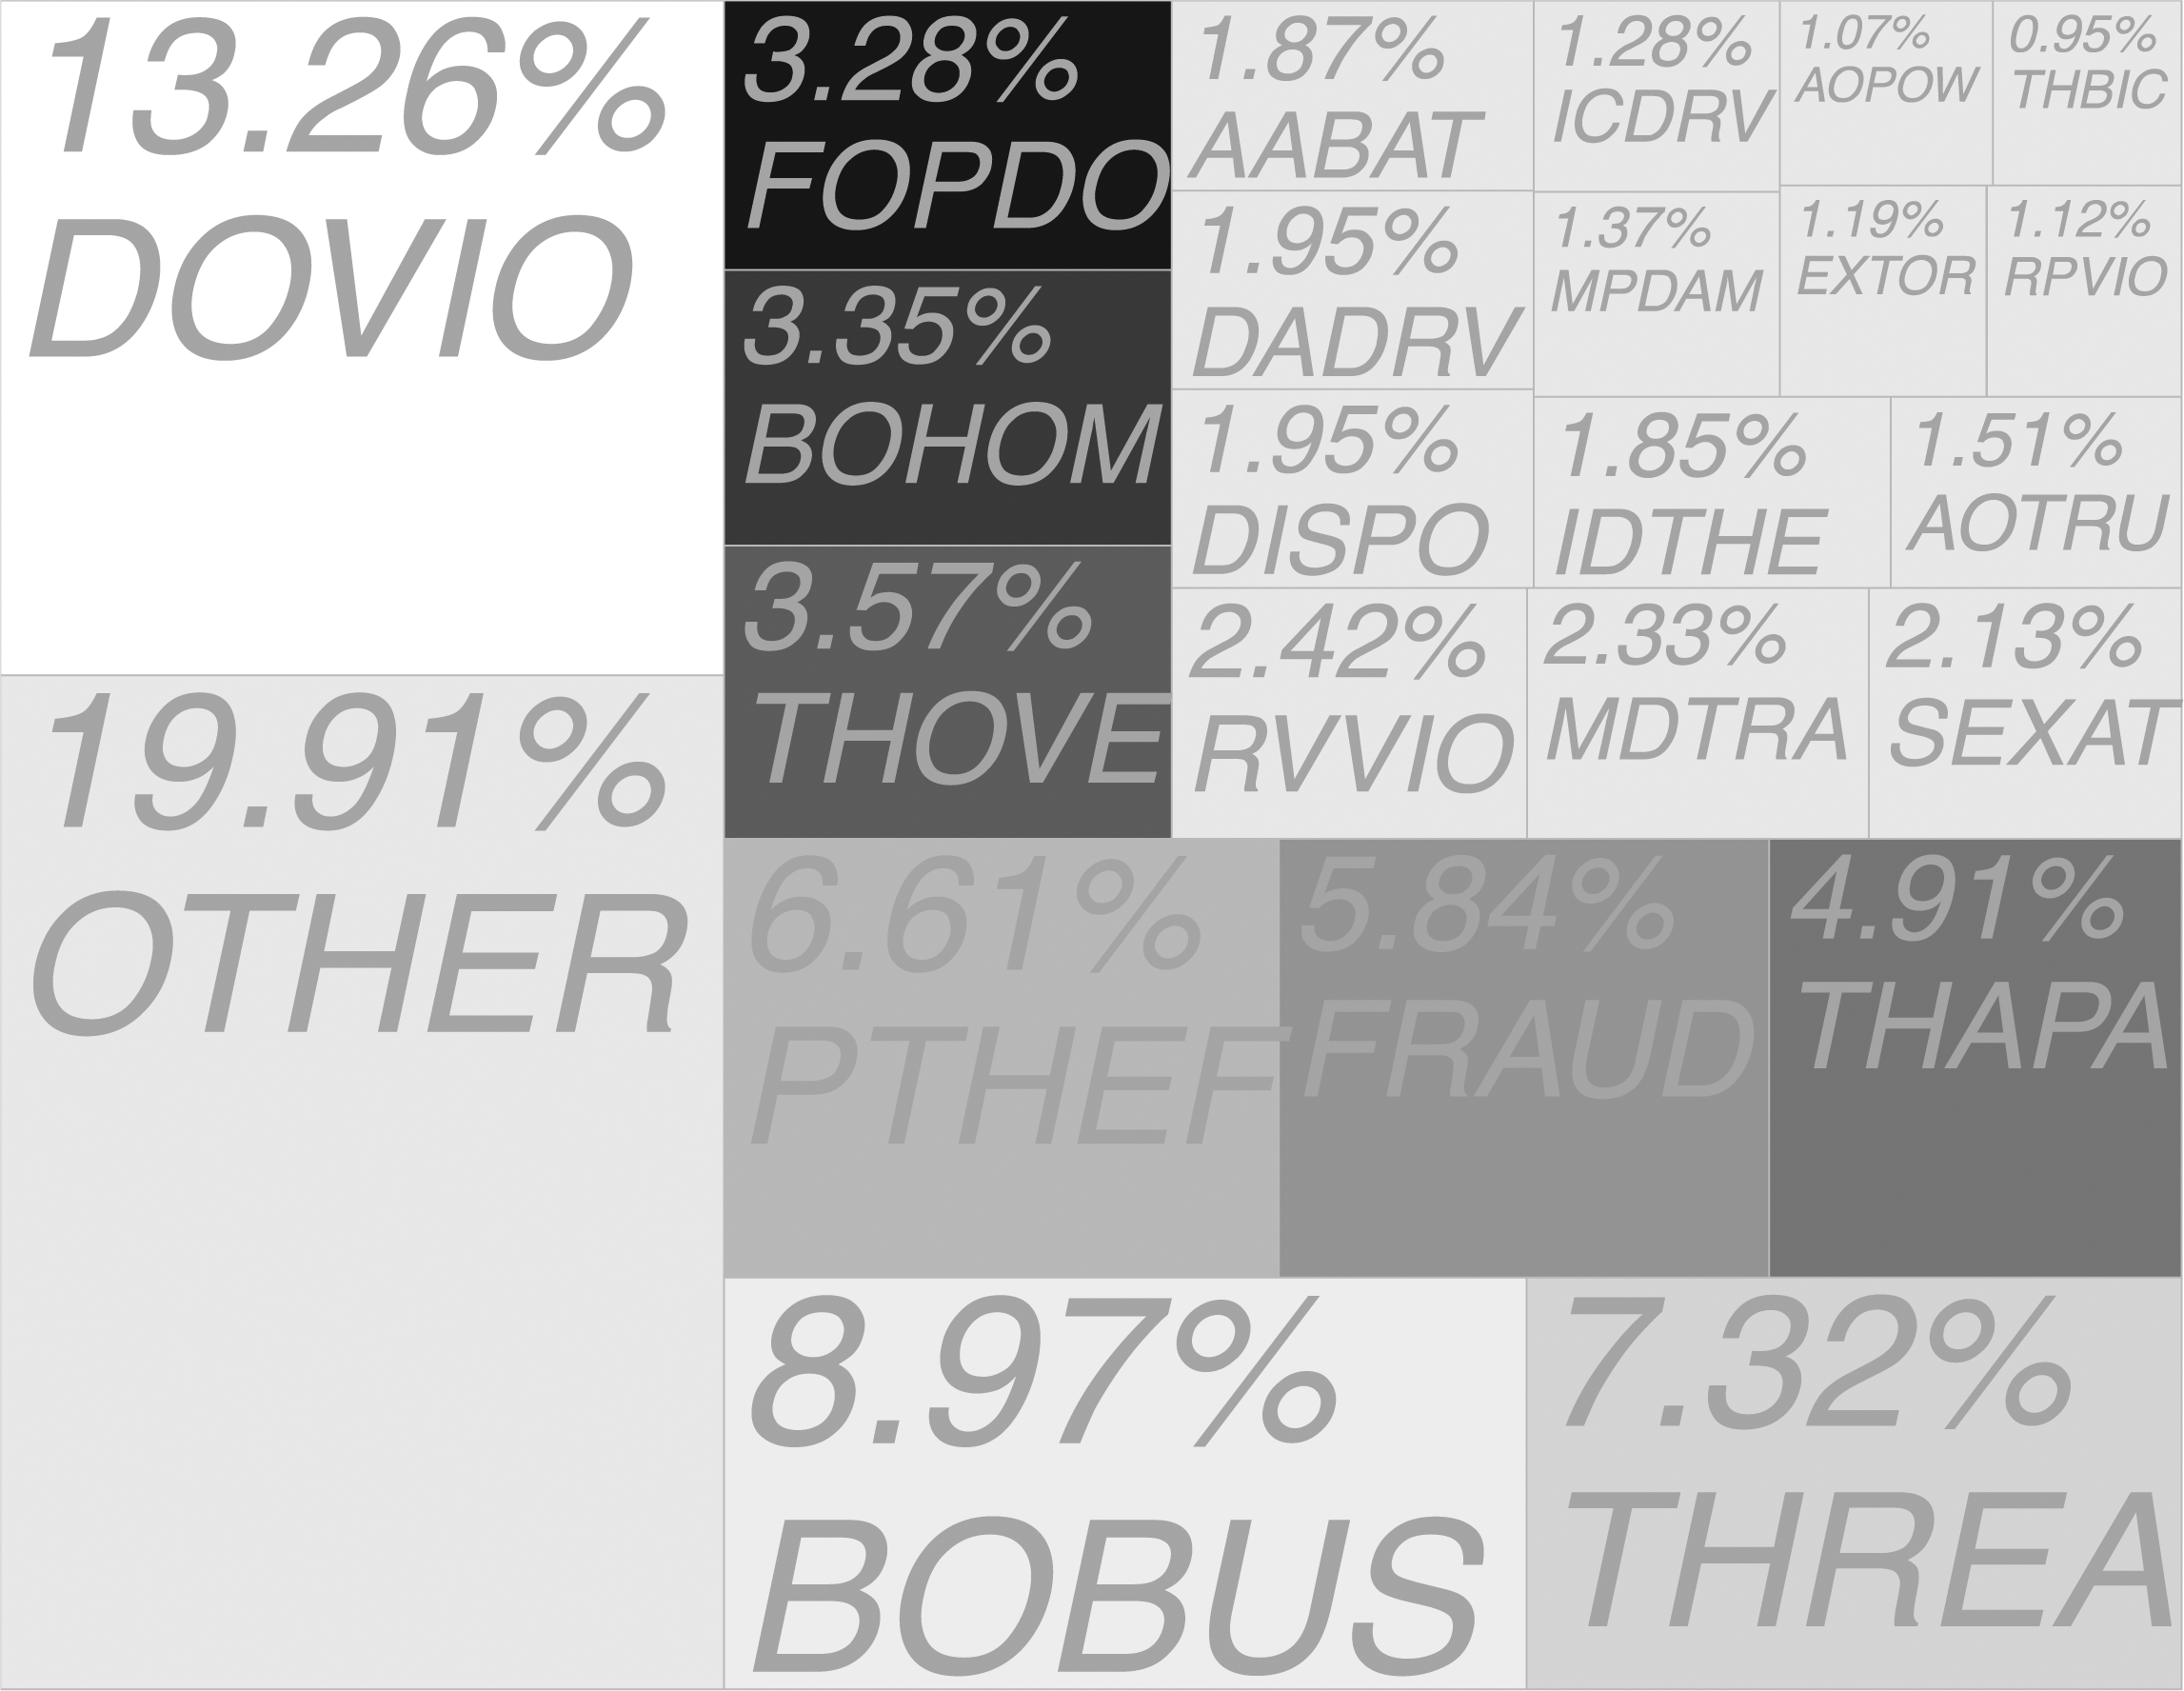
Given that the LOW category is the greatest with 76%, it becomes necessary to study this category with a different level of granularity. Figure 3 shows these sub-categories for LOW as determined by the laws of the country of Mexico.and their percentages (Table 1). It should be noted that OTHER - other offenses (unclassified information) has the highest proportion with nearly 20%, followed by DOVIO - domestic violence at 13.26%, BOBUS - business burglary at 8.97%, and THREA - threats at 7.32%.
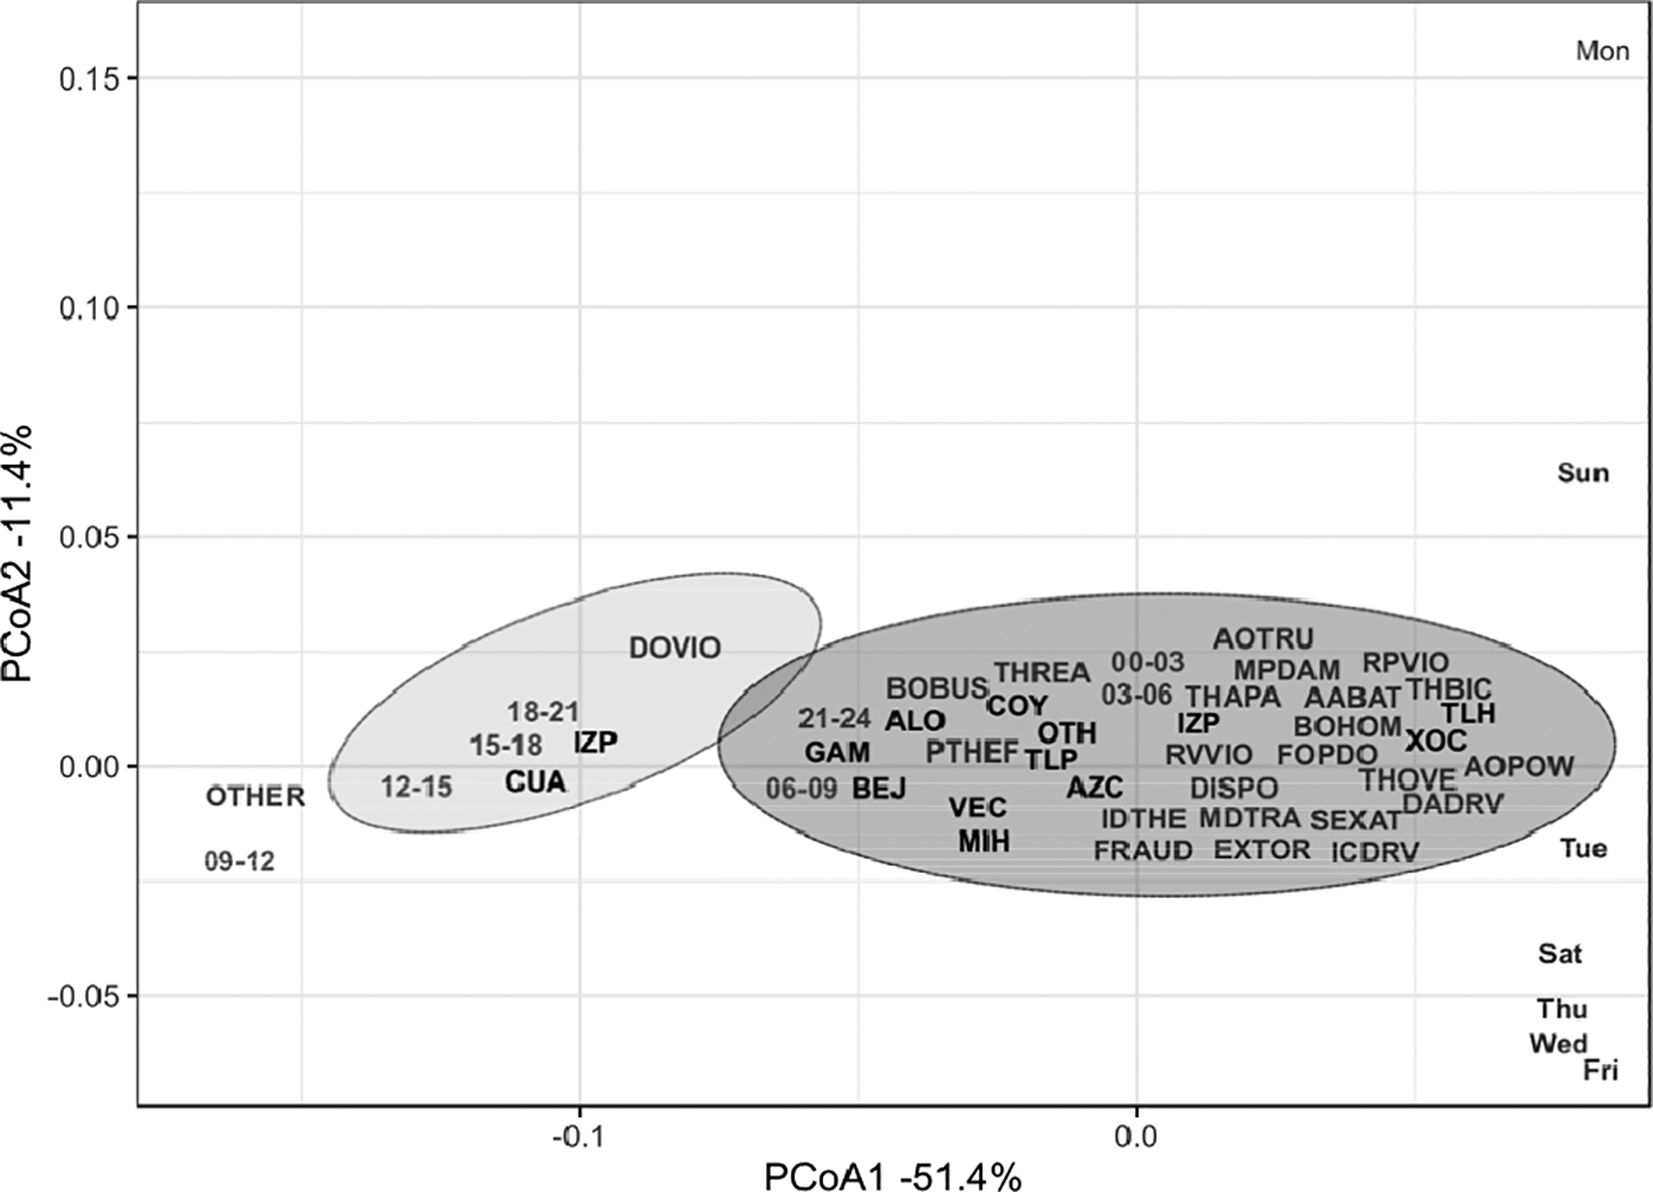
Moreover, by using principal co-ordinates analysis (PCoA) in a low dimensional space, we carried out a PCoA on the following variables: crime, time, and location (see extended data, Table 2 for abbreviations) (Pambabay-Calero, 2021). This analysis permits to observe similarities between those variables. Thus, it can be seen in Figure 4 that DOVIO - domestic violence is well clustered with locations as Cuauhtémoc and Iztapalapa in the following time (in hours): 12pm - 15pm, 15pm - 18pm and 18pm - 21pm. The other cluster is formed by the rest of the 24 crime categories, i.e., AOPOW, AOTRU, AABAT, BOHOM, BOBUS, DISPO, EXTOR, FOPDO, FRAUD, IDTHE, ICDRV, LOW, MPDAM, MDTRA, SEXAT, DADRV, PTHEF, THOVE, RPVIO, RVVIO, THAPA, THBIC, THREA and OTHER.
With the aim to gain insights about between the aforementioned crime categories; we display a biplot graph in Figure 5; in this figure it can be noted that the crimes for domestic violence, negligent or reckless damage of a vehicle while driving, and malicious property damage, present the highest level of correlation. Similarly, these categories are highly correlated with the time window of 21pm to 6am, mostly on Sundays. These results were obtained with the databases (see underlying data database_of_victim_complaints.xlsx, Pambabay-Calero, 2021).
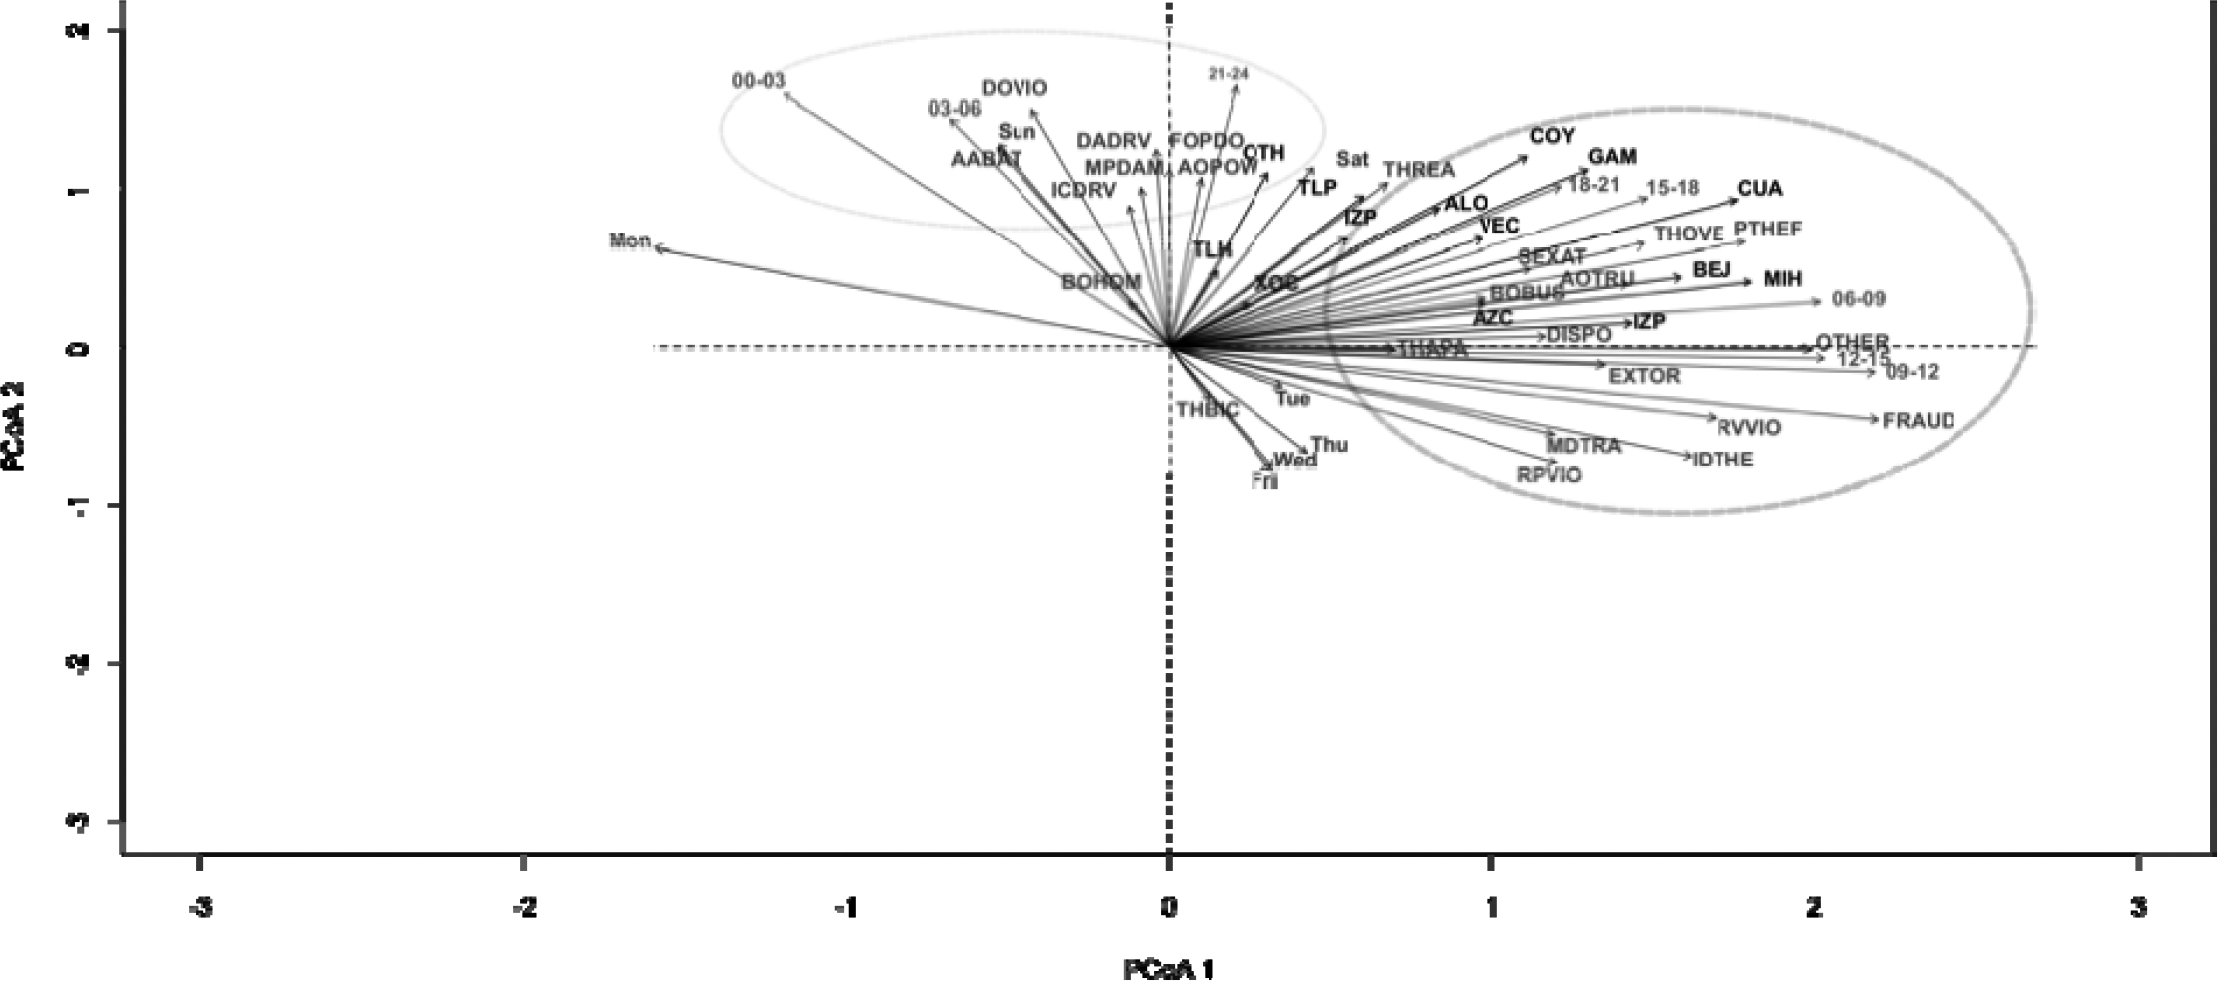
It is important to note that locations with the highest rate of crime are depicted on axis 1 (PCoA1) at these locations; Cuauhtémoc, Iztapalapa, Gustavo Madero, Benito Juárez, Coyoacán, and Miguel Hidalgo.
In addition, Figure 5 on axis 2 (PCoA2) reveals that domestic violence and assault and battery crimes increase on Sundays between 3am to 6am. In the same Figure, about axis 1 (PCoA1), it is noted that the time of highest crime incidence is between 18 and 21 hours in Gustavo Madero and Coyoacán.
In Cuauhtémoc the most frequent crime is petty theft of property inside a vehicle in the period 15pm - 18pm. Meanwhile, the same crime increases in Benito Juárez and Miguel Hidalgo from 6am - 9am. Finally, Iztapalapa shows that the highest occurrence of crime is cases of dispossession between 6am - 9am.
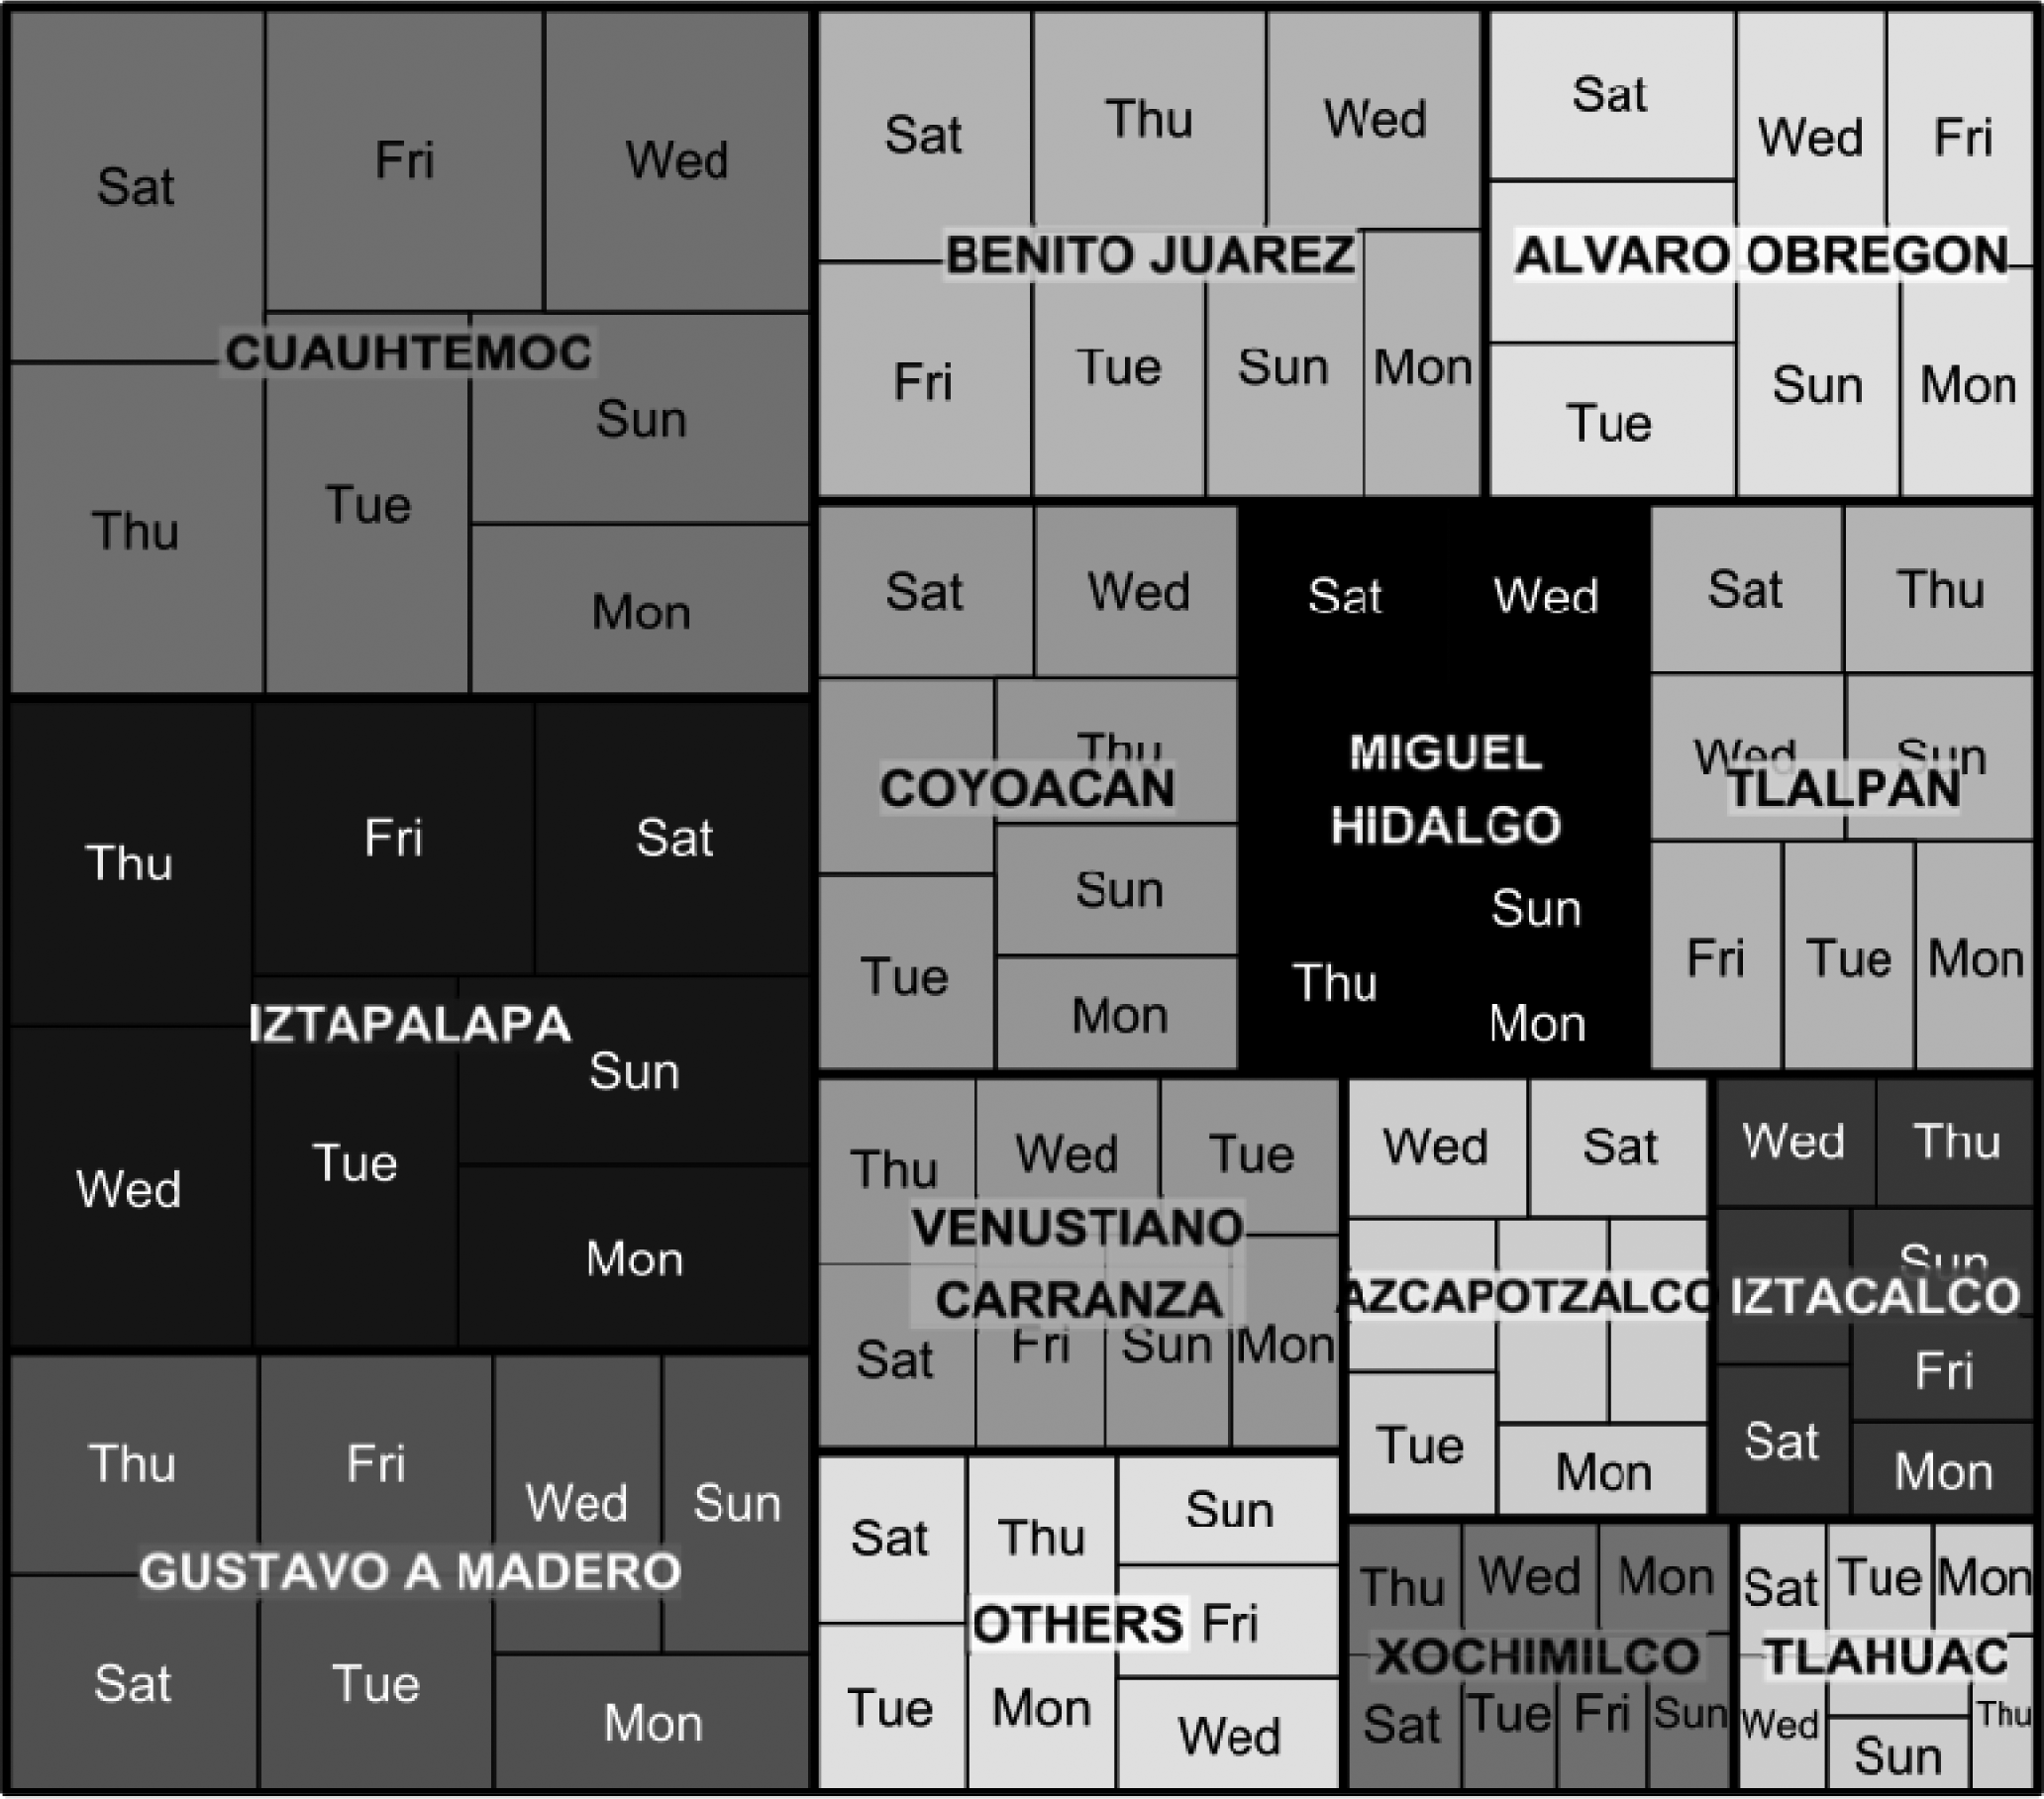
It should be highlighted that LOW behavior might be measured in terms of locations and time as well. The correlation between location and time is showed in a tree map with the aim to provide a comparative analysis based on proportions. Figure 6 compares the results of the correlational analysis based on weekdays and locations. As can be seen from the figure, Cuauhtémoc, Iztapalapa, and Gustavo A Madero, have the highest number of low impact crimes. A closer inspection of the tree map shows that proportionally speaking these crimes take place from Wednesdays to Saturdays.
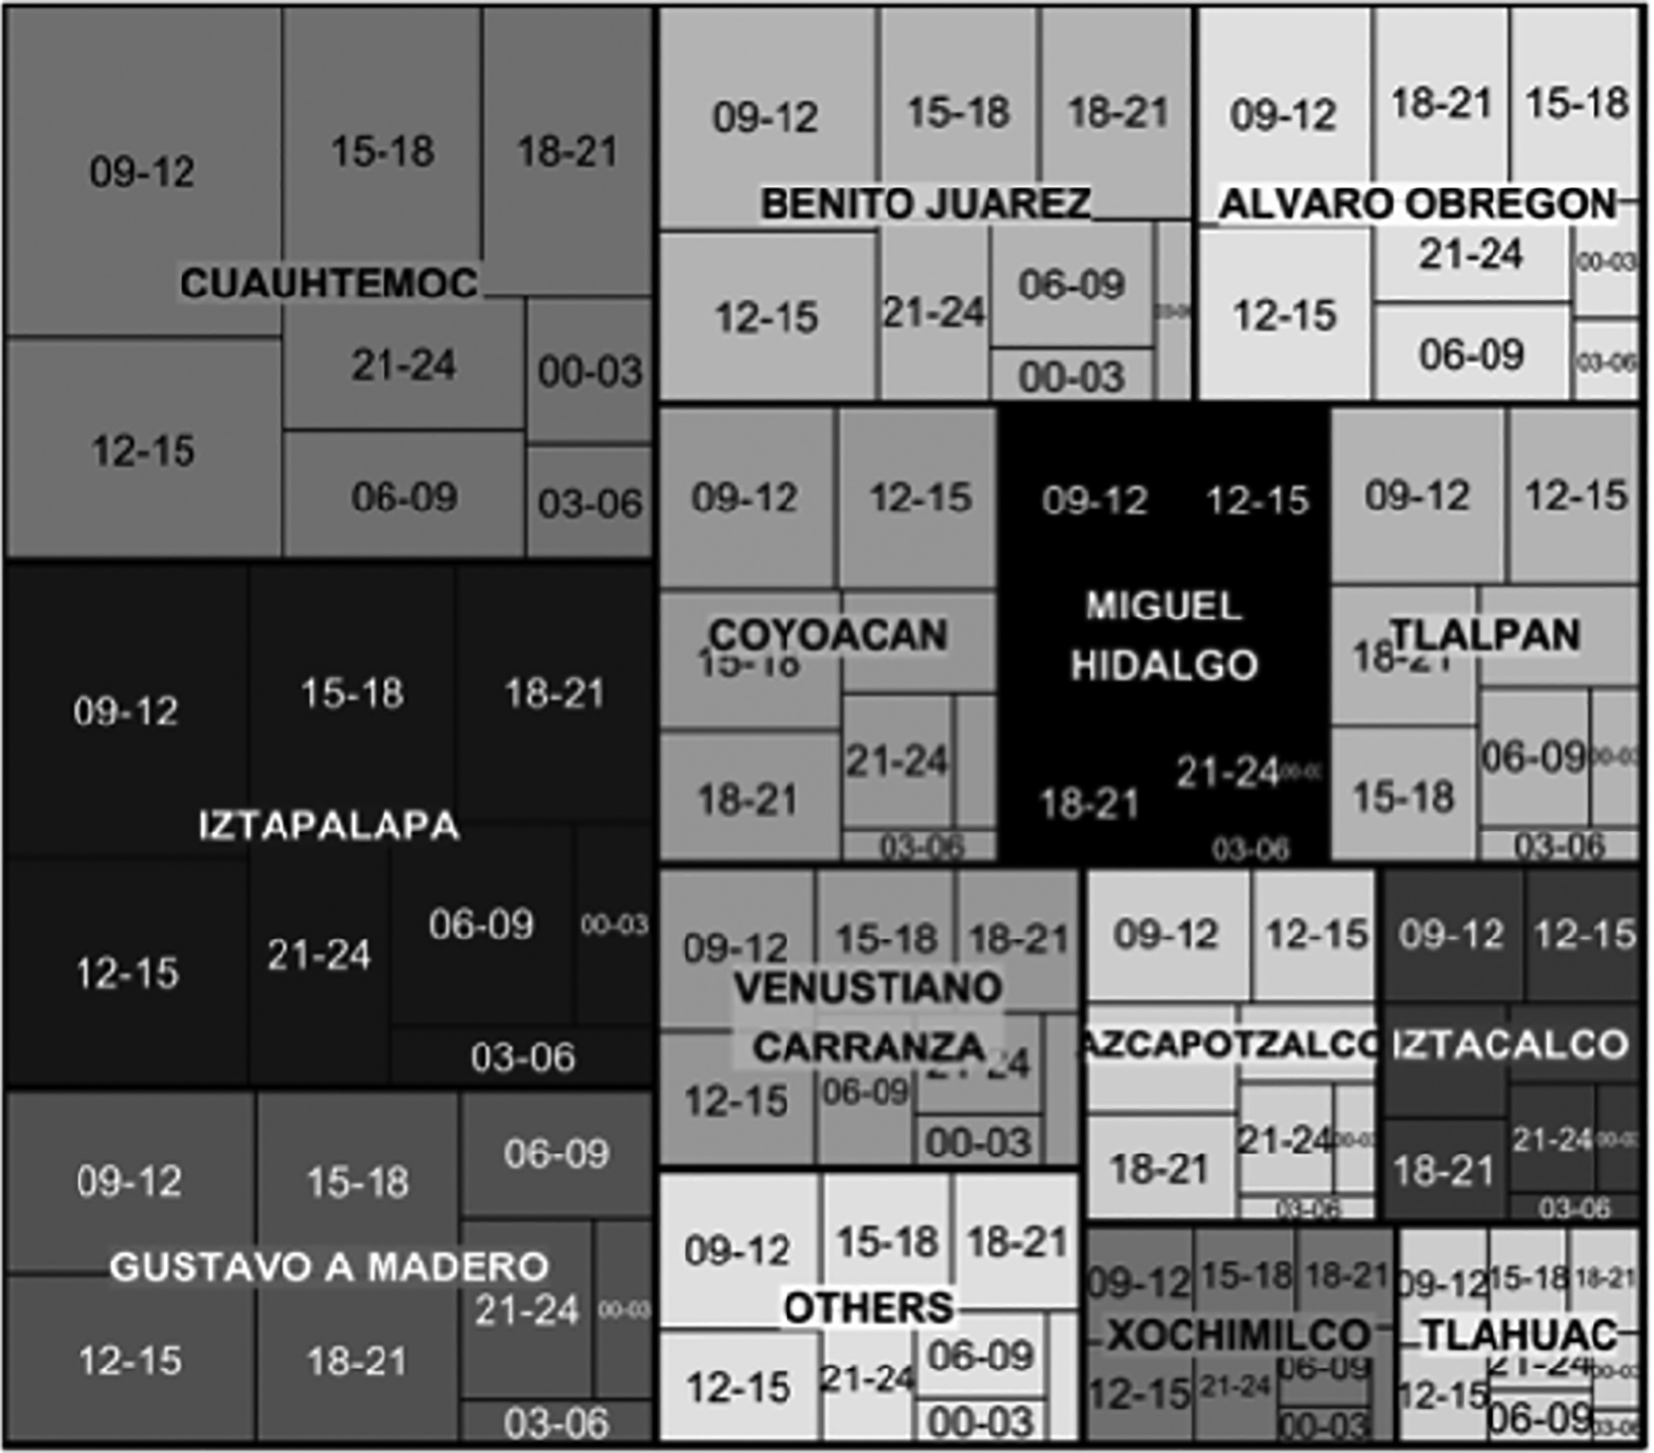
Similarly, Figure 7 shows a tree map with the time interval for the top three locations: Cuauhtémoc, Iztapalapa, and Gustavo A. Madero. From this data, we can see that the number of low impact crimes committed has the highest proportion from 9am to 15pm.
The results of this study indicate that it is possible to find correlations in terms of crime, time, and day across all locations included in this study. Through a k-means clustering analysis, six clusters were proposed to group LOW categories into coherent themes depicted in Figure 8. Themes were defined by the authors after the clustering analysis was performed and a discussion was held about the common characteristic of crime categories in each cluster. In theme one it is possible to find those categories related to ‘mobility’ from 12pm to 15pm across all regions: injuries caused by a crash due to negligent or reckless driving, robbery to passenger of public transport with violence, robbery to passenger or driver of a private vehicle with violence, theft of auto-parts, theft of bicycle or similar, extortion, and abuse of power. Though extortion and abuse of power are not mobility crimes per se, they could be related to misbehavior by police officers in charge of mobility surveillance. These crimes are mostly associated to men and women between 15 and 24 years old. There is no evidence of a particular day of the week where these crimes occur more frequently.
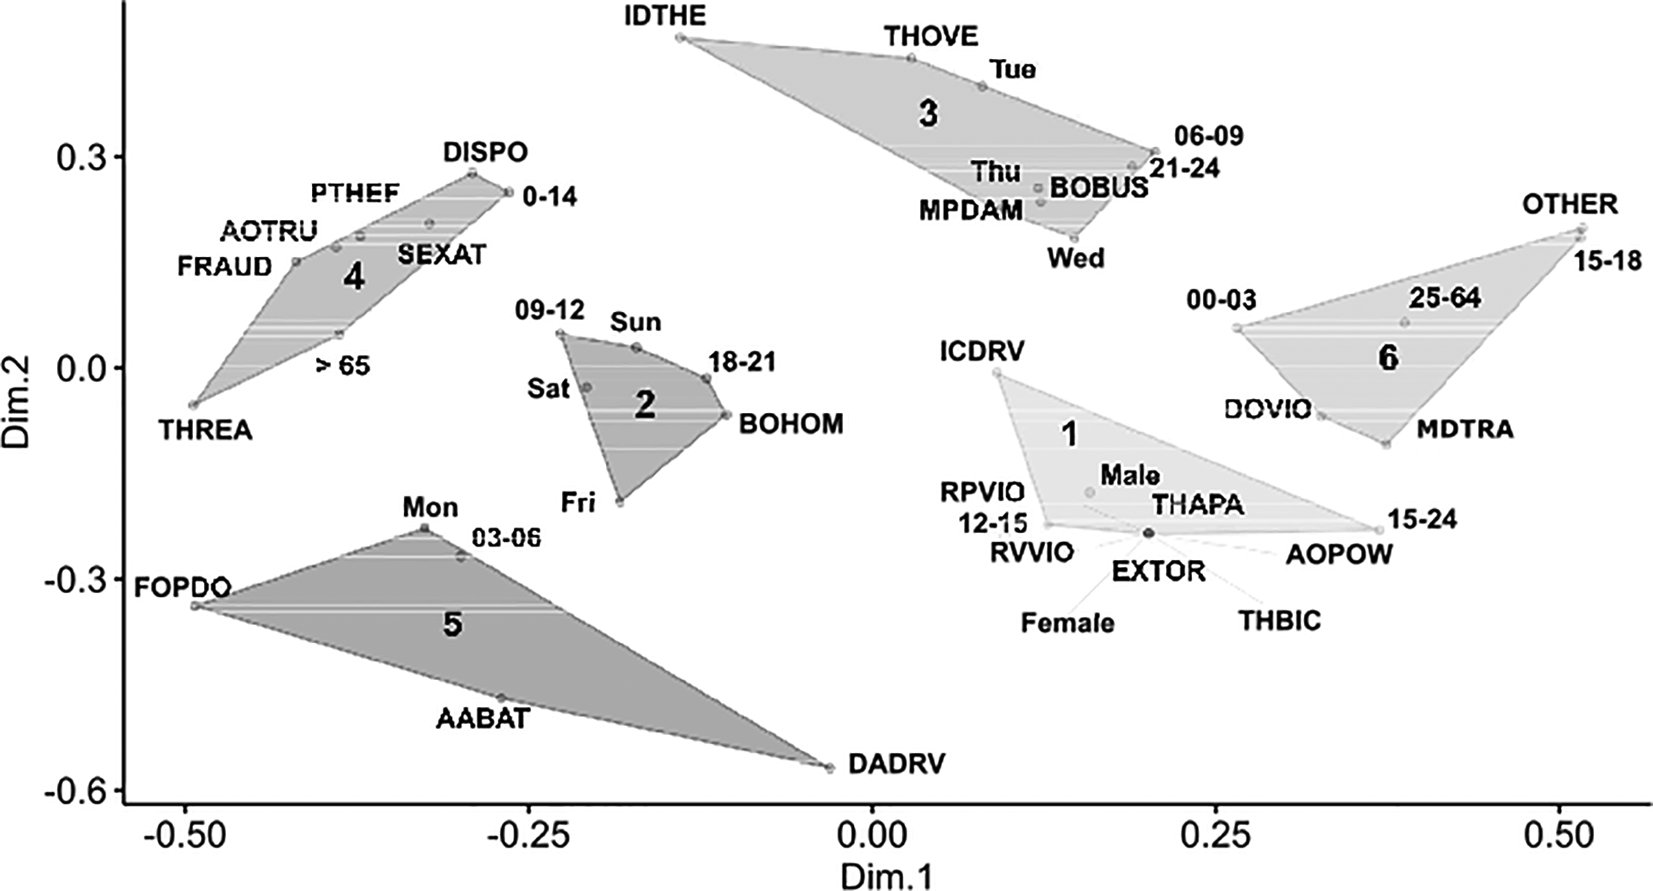
In theme two, most of the crimes are linked to the ‘burglary of home’ category. In this context this crime presents the highest number of occurrences around 9am-12pm mostly on Fridays, Saturdays, and Sundays. There is no association between the sex and age of the victim and the crime. Theme three ‘theft from stores or parked vehicles’ consisted of the crimes of business burglary, identity theft, petty theft of property inside a vehicle, and malicious property damage.
These crimes present the highest number of occurrences mostly on Tuesdays, Wednesdays, and Thursdays between the hours of 6am-9am. There is no association between the sex and age of the victim and the crime.
Regarding to theme four, ‘crimes against vulnerable people’, the crimes of sexual assault (not rape), threats, fraud, abuse of trust, dispossession, and petty theft are the most frequent crimes. The most frequent victims are in between 0-14 years old and greater than 65 years old. There is no evidence of a particular day of the week where these crimes occur more frequently.
With respect to theme five, ‘weekend crimes’, the most frequent crimes are as follows: negligent or reckless damage of a vehicle while driving, forgery of public documents, and assault and battery; these crimes have the greatest occurrence on Mondays from 3am-6am. There is no association between the sex and age of the victim and the crime
Finally, theme six provides those crimes related to ‘minor drug trafficking, and domestic violence’. In this case, most of the victims are in between 25 and 64 years old and the highest rates of these crimes happen between the hours of midnight to 3am. There is no association between the sex of the victim and the day of the week with the crime.
The present results are another test of the routine activity theory of crime. In a city as large as Mexico City, stereotyped situations that facilitate minor crime are produced in a routine fashion related to well scheduled mass activities such as work or leisure. There is a clear difference in crime occurrence between the central city district Cuauhtémoc —which concentrates offices, malls, restaurants, and touristic locations (Gasca-Zamora, 2017; Salas-Benítez and López-López, 2019) — and a peripheral district, Iztapalapa, which houses about a fifth of the city dwellers, in conditions of social vulnerability (Rodríguez-Cortés, 2017). As the weekend sets in, a sort of wave of crime moves from the peripheral areas towards the central areas of the city.
These findings support the literature that relies on routine activities theory to explain why crime concentrates in particular spaces at particular times (e.g., Campedelli, Aziani, and Favarin (2021); Schnell, Grossman, and Braga, 2019; Vilalta et al., 2018). Explanations are reduced to the interaction of three main factors, the presence of victims, the presence of offenders, and the absence of authority. Yet, the spatial location of victims and offenders is not static and so, the matter of mobility of victims and perpetrators is a field of study that has not been thoroughly explored.
In relation to mobility, the characterization developed in this study, may mean one of two things: either offenders follow the displacements of victims, or different offenders target victims as they develop different activities within the city. Also, the activities of victims follow a general work-leisure cycle. Song et al., (2019) state that though the mobility of law-abiding citizens determines the characteristics of crime location, offenders seem to act not far from their neighborhoods, thus supporting the hypothesis of victims falling to offenders living in different parts of the city. However, further studies are needed to assess the matter.
In terms of public policy, our research envisions the possibility to use recent data to organize crime in situational categories which could help improve police efficiency.
The divulgation of these situational categories could also help non-governmental organizations (NGOs) that help victims of crime or that stand for a better access to justice, to push for changes in prevention policies and to inform citizens about situational risks and possible preventive measures.
A deep sociological analysis of the cost-benefit of placing a complaint is required to disentangle the true characteristics of crime from those characteristics related to the operation of prosecuting offices in Mexico; for example: schedules of prosecution offices, location of prosecution offices, documentation needed to file a complaint, availability of prosecution clerks, and other considerations that may tamper the quality of the data available for analysis. In this study, sociological considerations of routines related to crime reporting are not considered, and that is a serious limitation of this and other similar studies.
The National Victims Survey in Mexico (ENVIPE) states that an investigation folder (such as the ones used in this research to get data) filed in a prosecution office has only in 7.9% of the actual offenses committed (INEGI, 2020). Thus, data gathered from prosecution offices must be combined with data from surveys in order to obtain a more accurate panorama of crime, particularly in highly underreported offenses, such as domestic violence and extortion (INEGI, 2020; Saavedra-Hernández, 2009).
This situational categorization, however, is incomplete without data about police behavior or observations about security measures taken by the state in specific locations to prevent minor crime. Such observations would cover the “absence of a capable guardian” part stated by the routine activities theory. Some reflections on the matter have been made with regards to the effectiveness of the use of video cameras against non-violent crime (Vilalta et al., 2018). Yet, considering the amount of crime observed and its regularity, the absence of capable guardians may be the rule and not the exception in the city.
The aim of the present research was to examine how crime reports can be used as an acceptable proxy measure of antisocial behavior, this data was captured in the database (database_of_victim_complaints.xlsx) and graphs 4 through 8 were generated from the file (victim_data_figures_4_8.xlsx) (Pambabay-Calero, 2021). It should be noted that by using this sort of information it is possible to find unsafe areas in Mexico City; and to estimate crime occurrence peaks as well.
This study has identified those city boroughs that show the highest number of reported crimes in terms of low impact crime. In this context, our preliminary results can be helpful to develop tailored strategies to tackle crime.
The findings of this study suggest that Cuauhtémoc and Iztapalapa show high rate of criminal acts due to their demographic factors. This observation may support the hypothesis as Iztapalapa has the highest population density and social relegation. On the other hand, despite the fact that Cuauhtémoc presents a similar population density, its levels in growth and change in terms of human development are more than acceptable in comparison with Iztapalapa (Ángeles-Castro, 2013; Caudillo and Flores, 2016).
Open Science Framework (OSF). charactLowImpact. https://doi.org/10.17605/OSF.IO/PT3GV. (Pambabay-Calero, 2021).
This project contains the following underlying data:
- Data file 1. database_of_victim_complaints.xlsx, (data on complaints collected from source including dates, age, gender, type of crime, crime description and location)
- Data file 2. victim_data_figures_4_8.xlsx, (data to generate graphs in figures 4, 5, 6, 7, 8)
Data are available under the terms of the Creative Commons Zero “No rights reserved” data waiver (CC0 1.0 Public domain dedication).
Open Science Framework (OSF): charactLowImpact. https://doi.org/10.17605/OSF.IO/PT3GV. (Pambabay-Calero, 2021).
This project contains the following extended data:
• Table 1. (Description and abbreviation of low impact crimes).
• Table 2. (Abbreviations of municipalities).
• Figure 1. (Methodology flowchart).
• Figure 2. (Percentage of crime categories).
• Figure 3. (Sub-categories related to low impact crime category).
• Figure 4. (Principal Coordinates Analysis in two dimensions on the following variables: crime, time and location).
• Figure 5. (Biplot in two dimensions of the variables: crime, time, and location).• Figure 6. A comparative analysis based on the proportions of low crime occurrence according to location.
• Figure 7. A comparative analysis based on the proportions of low crime occurrence according to the time.
• Figure 8. K-means cluster analysis.
Data are available under the terms of the Creative Commons Zero “No rights reserved” data waiver (CC0 1.0 Public domain dedication).
| Views | Downloads | |
|---|---|---|
| F1000Research | - | - |
|
PubMed Central
Data from PMC are received and updated monthly.
|
- | - |
Provide sufficient details of any financial or non-financial competing interests to enable users to assess whether your comments might lead a reasonable person to question your impartiality. Consider the following examples, but note that this is not an exhaustive list:
Sign up for content alerts and receive a weekly or monthly email with all newly published articles
Already registered? Sign in
The email address should be the one you originally registered with F1000.
You registered with F1000 via Google, so we cannot reset your password.
To sign in, please click here.
If you still need help with your Google account password, please click here.
You registered with F1000 via Facebook, so we cannot reset your password.
To sign in, please click here.
If you still need help with your Facebook account password, please click here.
If your email address is registered with us, we will email you instructions to reset your password.
If you think you should have received this email but it has not arrived, please check your spam filters and/or contact for further assistance.
Comments on this article Comments (0)