Keywords
allergic diseases, atopic inflammatory pathway, immunoglobulin, periodontal pathogen, Porphyromonas gingivalis LPS
allergic diseases, atopic inflammatory pathway, immunoglobulin, periodontal pathogen, Porphyromonas gingivalis LPS
Editorial Note (20th October 2023): The F1000 Editorial Team has not yet received a new version of this article, as detailed in the Editorial Notes published on 16th June and 4th August 2023. The F1000 Editorial Team will no longer be requesting a new version from the authors. Readers should be aware that there is key information missing from the article regarding adverse events, anaesthetic and euthanasia procedures, and ethical approval; this information had been previously given to and verified by the F1000 Editorial Team, but the authors have not yet updated their article. Peer review activity remains suspended until the authors publish a new version of this article.
Editorial Note (4th August 2023): The F1000 Editorial Team has not yet received a new version of this article, as detailed in the Editorial Note published on 16th June 2023. The F1000 Editorial Team is actively contacting the authors to request the new version of the article. Peer review activity remains suspended until the authors publish a new version of this article.
Editorial Note (16th June 2023): Since publication, it has been brought to the attention of the Editorial Team that the article was missing key information regarding adverse events, anaesthetic and euthanasia procedures, and ethical approval. The Editorial Team requested further detail and an explanation from the authors in March 2023. The authors provided an adequate response and were requested by the Editorial Team to create a new version of the article to include the additional details. Peer review activity has been suspended until the authors publish a new version of this article.
The oral cavity is the habitat of numerous bacteria, including Porphyromonas gingivalis (Pg). Pg is a gram negative, facultative anaerobic pathogen, which is responsible in causing gingivitis or periodontitis.1 In low-income countries, gingivitis and periodontitis can affect up to 90% of the adult population.2 Rather than alveolar bone and ligament destruction, Pg is believed to be involved with the development of atopic responses in a susceptible host.3 Following Pg infection, hosts’ adaptive immune response (both cell-mediated and humoral-mediated) could induce a systemic inflammatory reaction, not only just local destruction of tooth-supporting tissues.4–5 Although periodontal pathogens, such as Pg, play a major role in the initiation of local and systemic inflammatory reaction,6 the host aberrant immune responses require further study. Since humoral immune responses are stimulated following Pg infection, there might be a link to the occurrence of atopy.
Despite long-standing research about hygiene hypothesis for several decades, there is an unequivocally accepted fact that the prevalence of atopy increases more among children who have periodontal pathogen colonization or infection.7 While endorsing these hygiene hypothesis approaches, there is an alternative hypothesis in which exposure to some periodontal pathogens will exclusively trigger an “immunoglobulin-E skew” rather than reducing it.8 Within the context of the hygiene hypothesis, the most essential microbial exposures needed to be studied is the biomolecular relationship between host antibody and regulatory T-cell with lipopolysaccharide (LPS), an endotoxin released by Pg to affect host immune reaction.
Hygiene hypothesis principles might not be able to answer all phenomenon of increasing incidence of atopy among children with poor oral hygiene.9 Some studies report a positive association between the colonization/infection of Pg with the development of allergic diseases,10–15 whereas some studies report no association.16–21 Due to lack of conclusive evidence about the association between Pg and allergic diseases,22 we try to measure the level of atopic biomarkers following Pg infection.
To the best of our knowledge, measuring IgG4 and IgE antibody may have a closer association to atopic profiles, since IgG4 and IgE are released after activation of mature B cells following the modulation of IL-4 and IL-5 released by Th-2 cells during type I hypersensitivity.23 By looking at the alteration of IgG4 and IgE antibodies level after exposure to these selected components of Pg in a rat model, we hope to understand more deeply the biological mechanism of B-cell production antibodies pattern and humoral immune responses before the clinical manifestation of atopy. We chose a rat model since they are inbred so they are almost identical genetically and their genetic, biological and behavior characteristics closely resemble those of humans.
This article was reported in line with the ARRIVE guidelines. Animal experimental study was conducted under the approval of the Institutional Animal Research Ethics Committee of Universitas Airlangga (UNAIR), Surabaya, Indonesia (animal approval no:50/KKEPK.FKG/IV/2015) under the name of Sindy Cornelia Nelwan as the Principal Investigator. The study was carried out in strict accordance to internationally accepted standards of the Guide for the Care and Use of Laboratory Animals of the National Institute of Health. All efforts were made to ameliorate any suffering of animals through using anaesthetic to euthanize the rats at the end of the experimental procedure.
Sample size
N = (Zα/2)2 s2/d2, where s is the standard deviation obtained from previous study or pilot study, and d is the accuracy of estimate or how close to the true mean. Zα/2 is normal deviate for two- tailed alternative hypothesis at a level of significance. Suppose sample size calculated by software is 3 animals per group and researcher is expecting 10% attrition then his final sample size will be 4 animals per group or 16 animals in total.
Rats
The present study used 16 male Wistar rats (Rattus novergicus) between eight and ten weeks of age (average body weight 120-150 grams). The rats were housed in microisolator cages and maintained in a constant room temperature ranging from 22°C to 25°C, with a 12-h light/12-h dark cycle, under artificially controlled ventilation, with a relative humidity ranging from 50% to 60%. The rats were fed a standard balanced rodent diet (NUTRILAB CR-1®) and water were provided ad libitum.
Inclusion criteria was male Wistar rats, age 8-10 weeks, with body weight 120-150 grams. Female Wistar rats, diseased, sick, and lazy male Wistar rats were strictly excluded.
The present study design was a pre-test post-test-controlled unblinded group design using quantitative method. The 16 male Wistar rats were randomized using randomized block sampling and classified into four groups. Each group consisted of 4 matched Wistar rats (age, weight, IgE and IgG4 baseline characteristic). Group 1 were given placebo (0.9% normal saline solution). Group 2 were given lipopolysaccharide (LPS) of Porphyromonas gingivalis (Pg) (American Type Culture Collection, Rockville, Md.) at dose 0.3 μg/mL. Group 3 were given LPS Pg at dose 1 μg/mL. Group 4 were given LPS Pg at dose 3 μg/mL.
The rats received LPS by an intra-sulcular injection. Intra-sulcular injection has an advantage due to the its direct delivery of LPS to oral cavity in which the tip of needle is injected slowly at the crestal bone. Longitudinal quantitative measurement was performed; IgE level, IgG4 level, and IgG4/IgE ratio in both groups on day-0 (before treatment), day-4, and day-11. An average of 0.2 ml peripheral blood sera was obtained by Pasteur pipette from retro-orbital plexus, using a lateral approach on each of these days from each rat. The potential expected adverse events were anaphylactic shock, allergic reaction, bleeding and infection. However, to the best our knowledge, there were no expected nor unexpected adverse events in the experimental procedures. Following the end of the experiments, all efforts were made to ameliorate any suffering of animals through injection of sodium pentobarbital anesthetic to euthanize the rats at the end of the experimental procedure.
Sample of the sera were collected and stored at −70°C (−94°F) at Institute of Tropical Diseases Universitas Airlangga (UNAIR). All sera were assessed by direct-sandwich enzyme-linked immunosorbent assay (ELISA) with mouse IgE antibody (MAB9935) and IgG4 antibody (MAB9895) under the manufacturer's (R&D System Europe Ltd, Abingdon, UK) protocol. Briefly, the sera were examined using microtiter plates using 25 ml of 3,3’,5,5’-tetramethylbenzidine to 1 ml of phosphate-citrate buffer plus perborate in a mildly acidic buffer (adjust pH 5.7). Levels of IgG4 were detected using monoclonal antibody anti-IgG4, transferring it to microtiter plates, adding the supplied conjugate, adding blocking solution, diluting plasma sample (1:100,000), and washing between the steps. Level of IgE was detected using monoclonal antibody anti-IgE, following similar steps until diluting the plasma sample (1:200). A minimum value of 0.01 pg/mL for IgE and 0.01 ng/mL for IgG4 were assigned for below the limit of detection. We used 3,3’,5,5’-tetramethylbenzidine as chromogenic substrate, which allows direct visualization of signal development through spectrophotometer.
All measurements were performed at least three times. Results were presented as means ± standard errors (SEM). The assumption of the normality for the complete data was assessed by Shapiro-Wilk test. Test of homogeneity of variances was assessed by Levene Statistics. Statistical significance was examined by one-way ANOVA and repeated measure ANOVA using SPSS version 17.0 for Microsoft (IBM corp, Chicago, USA).
Table 1 show the baseline characteristics of the 16 Wistar rats (Rattus norvegicus). No significant differences were found for mean age (p = 0.774), body weight (p = 0.700), baseline IgE (p = 0.071), baseline IgG4 (p = 0.770), and baseline IgG4/IgE ratio (p = 0.053) among the four groups.
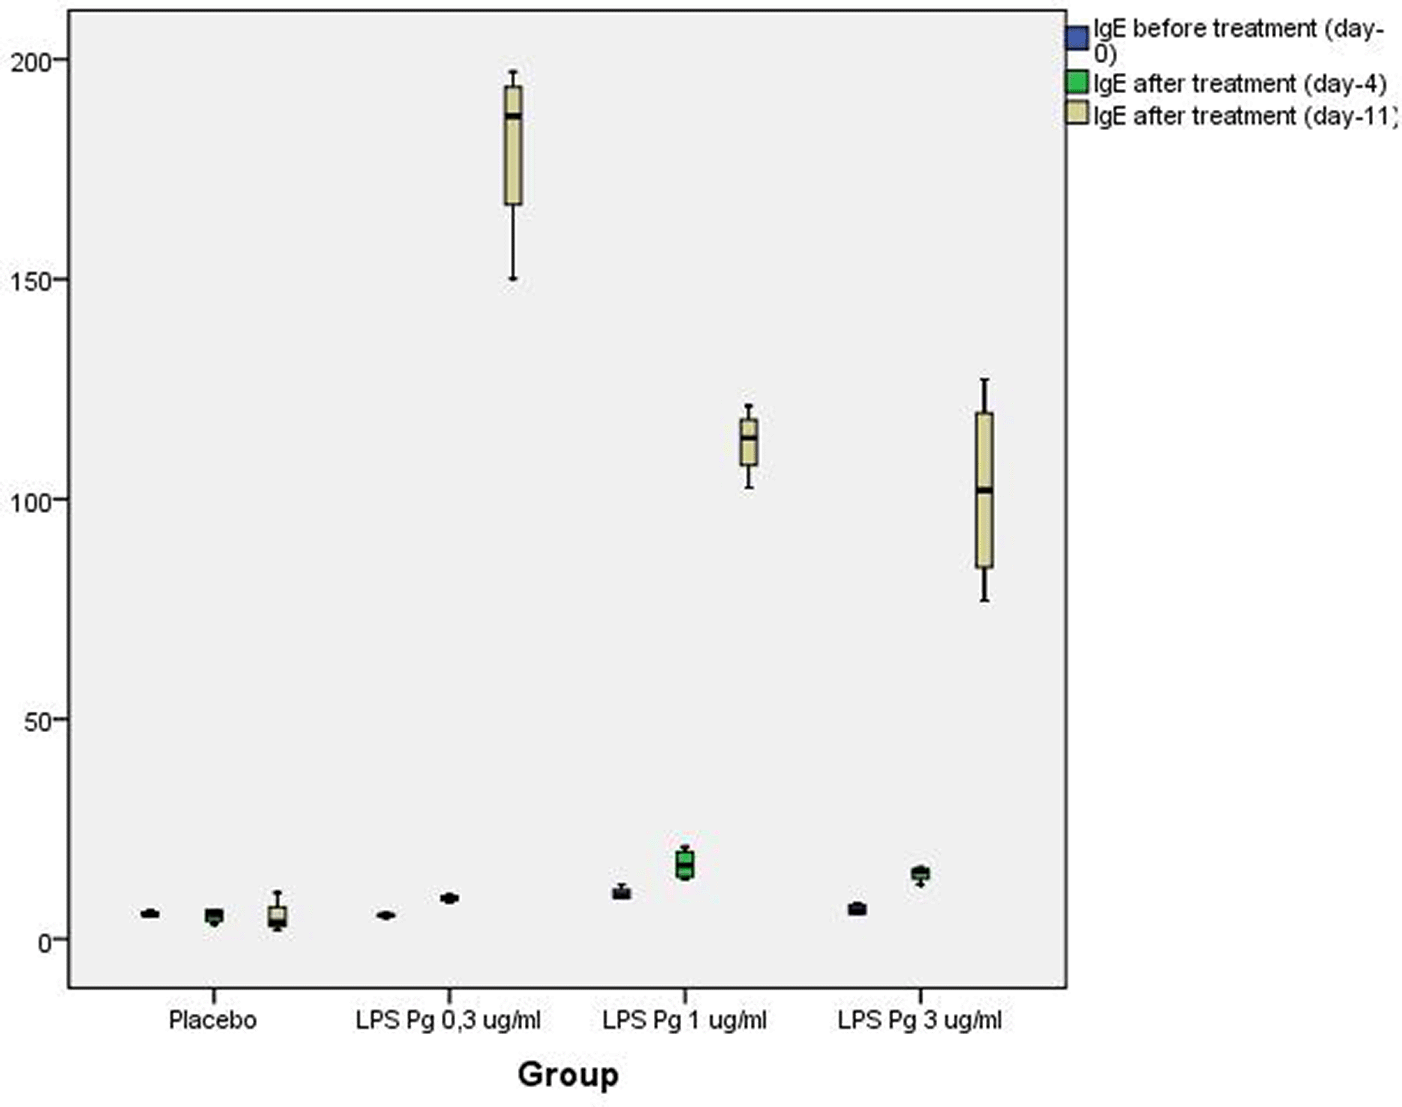
Prior to experiments (day-0), there was no difference of serum IgE level between the four groups (p > 0.05). On day-4, there was a significance difference of serum IgE level between all groups (p = 0.006). At day-4, the highest average IgE level could be found in Group 3 treated with LPS Pg 1 μg/ml (17.00 ± 1.69 pg/ml) and the lowest average IgE level could be found in Group 1 (control) (5.31 ± 0.76 pg/ml). On day-11, there was also a significance difference of serum IgE level between both groups (p = 0.047). At day-11 the highest average IgE level could be found in Group 2 treated with LPS Pg 0.3 μg/ml (180.34 ± 10.42 pg/ml) and the lowest average IgE level could be found in Group 1 (5.06 ± 1.86 pg/ml) (Table 2).
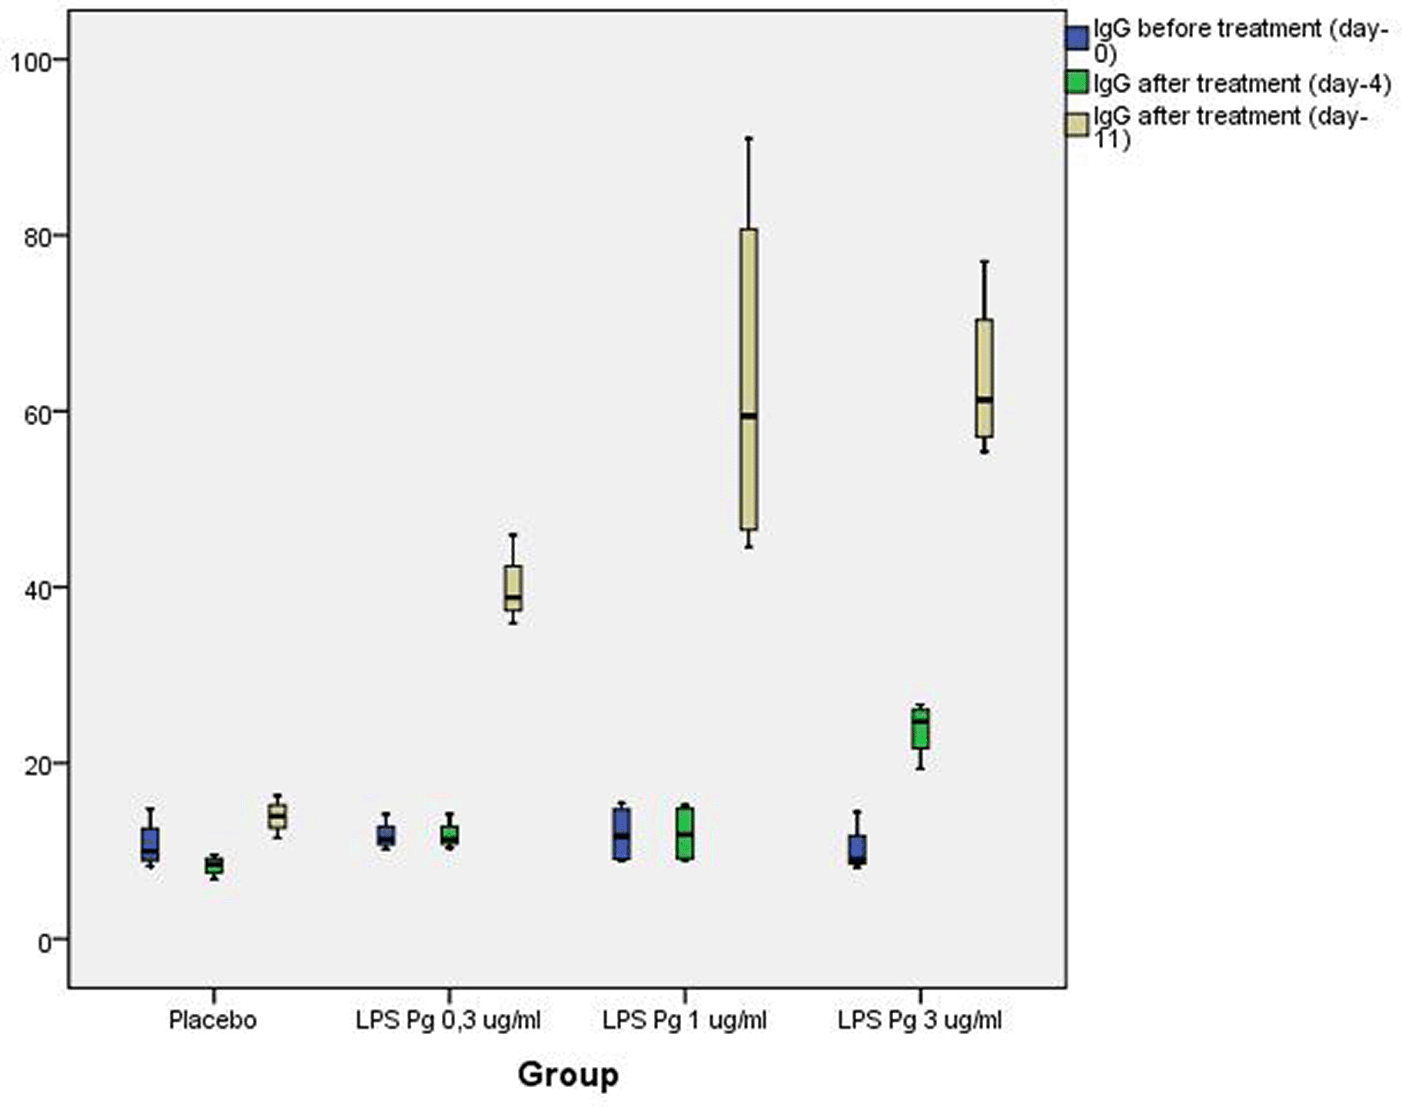
Prior to experiments (day-0), there was no difference of serum IgG4 level between the four groups (p > 0.05). On day-4, there was a significance difference of serum IgG4 level between all groups (p = 0.008). At day-4, the highest average IgG4 level could be found in Group 4 (LPS Pg 3 μg/ml; 23.86 ± 1.59 ng/ml) and the lowest average IgG4 level could be found in Group 1 (8.34 ± 0.58 ng/ml). On day-11, there was a greater difference of serum IgG4 level between all groups (p = 0.005). At day-10, the highest average IgG4 level could be found in Group 4 (LPS Pg 3 μg/ml; 63.74 ± 4.74 ng/ml) and the lowest average IgG4 level could be found in Group 1 (13.91 ± 0.99 ng/ml) (Table 3).
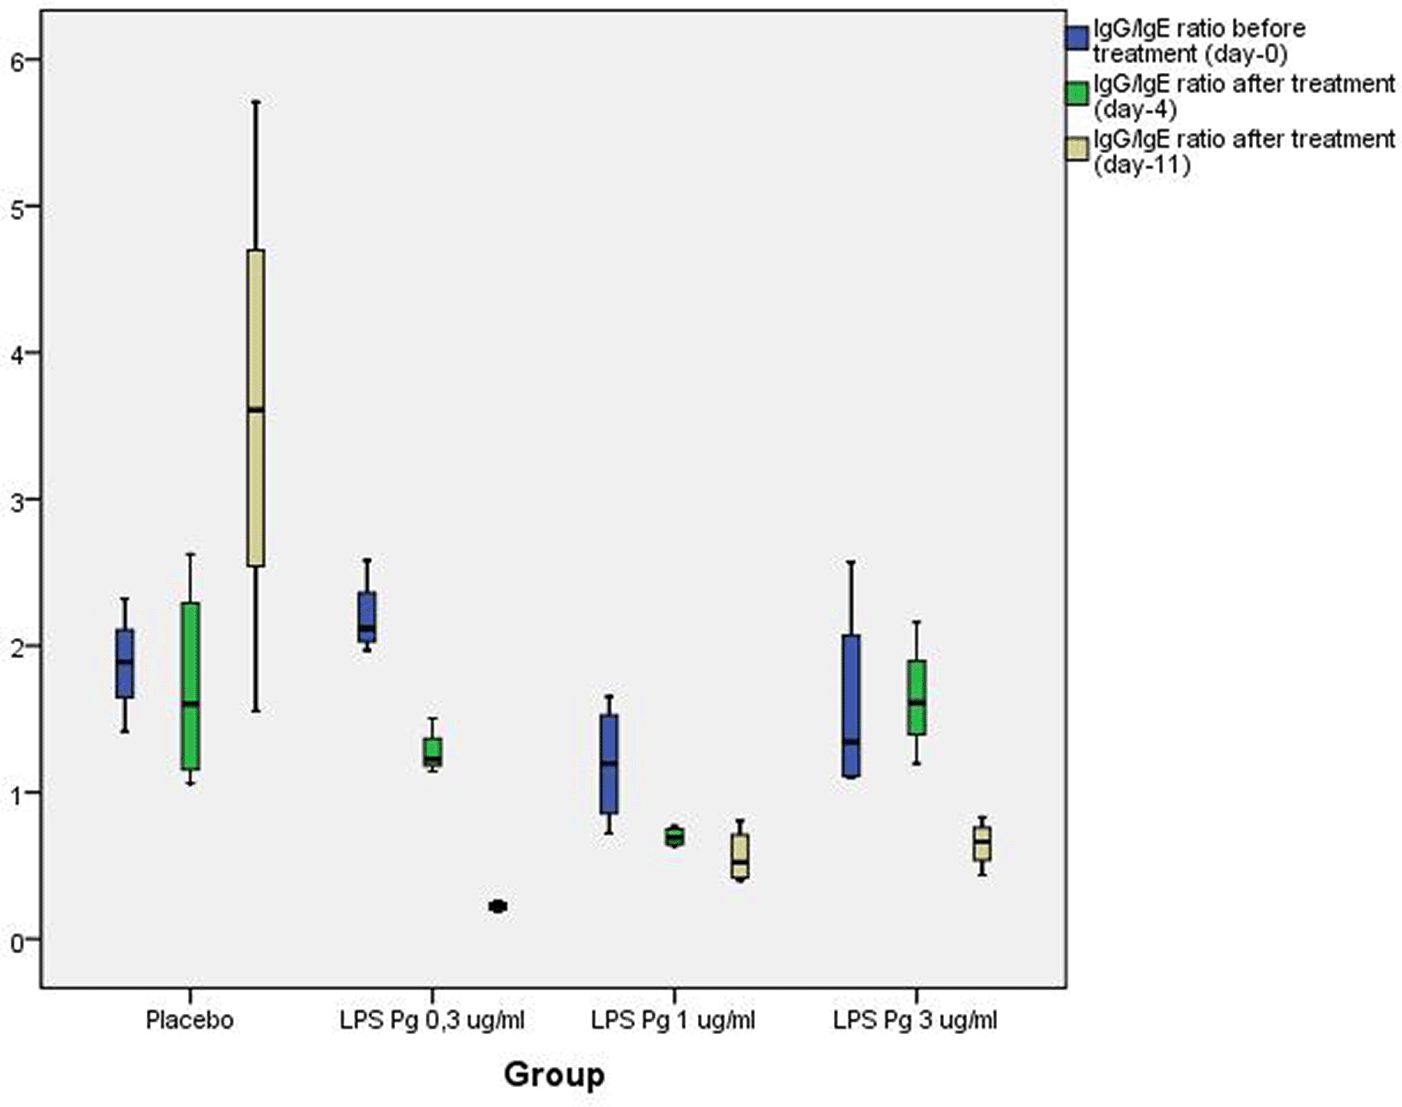
The average IgG4/IgE ratio for the control group at day-0, day-4, and day-11 was 1.87 × 10³, 1.72 × 10³, and 3.62 × 10³. In Group 2 (low-dose LPS group; 0.3 μg/ml), the average IgG4/IgE ratio was 2.20 × 10³, 1.27 × 10³, and 0.22 × 10³, respectively. In Group 3 (medium-dose LPS group; 1 μg/ml), the average IgG4/IgE ratio was 1.19 × 10³, 0.69 × 10³, and 0.56 × 10³, respectively. In Group 4 (high-dose LPS group; 3 μg/ml), the average IgG4/IgE ratio was 1.59 × 10³, 1.64 × 10³, and 0.65 × 10³, respectively. All groups exhibited significant differences of IgG4/IgE ratios, except at day-0. The highest IgG4/IgE ratio at day-4 and day-11 could be found in Group 1. The lowest IgG4/IgE ratio at day-4 could be found in Group 3, whilst the lowest ratio at day-11 could be found in Group 2 (Table 4).
Group 2 (0.3 μg/ml LPS Pg)
Level of IgE were increased dramatically from day-0 to day-11 after experiments (5.36 ± 0.19 pg/ml to 180.34 ± 10.42 pg/ml; p = 0.011). Level of IgG4 also increases significantly from day-0 to day-11 after experiments (11.76 ± 0.85 ng/ml to 39.85 ± 2.14 ng/ml; p = 0.006). On the other hand, IgG4/IgE ratio were decreased following experiments (2.20 ± 0.13 × 10³ to 0.22 ± 0.01 × 10³; p = 0.014) (Table 5).
Group 3 (1 μg/ml LPS Pg)
Level of IgE were raised dramatically from day-0 to day-11 after experiments (10.27 ± 0.70 pg/ml to 112.90 ± 3.87 pg/ml; p = 0.003). Level of IgG4 also increased significantly from day-0 to day-11 after experiments (11.91 ± 1.66 ng/ml to 63.6 ± 10.76 ng/ml; p = 0.027). On the other hand, IgG4/IgE ratio declined following experiments (1.19 ± 0.20 × 10³ to 0.56 ± 0.09 × 10³; p = 0.362) (Table 6).
Group 4 (3 μg/ml LPS Pg)
Level of IgE were raised dramatically from day-0 to day-11 after experiments (6.69 ± 0.61 pg/ml to 102.01 ± 11.04 pg/ml; p = 0.009). Level of IgG4 were also increase significantly from day-0 to day-11 after experiments (10.14 ± 1.44 ng/ml to 63.74 ± 4.74 ng/ml; p = 0.029). On the other hand, IgG4/IgE ratio declined following experiments (1.59 ± 0.34 × 10³ to 0.65 ± 0.08 × 10³; p = 0.113) (Table 7).
Several mechanisms have been suggested to alter atopic inflammatory responses following LPS Pg infection. One of the mechanisms proven in this study is an elevation of IgE antibody and reduction of IgG4/IgE ratio.24 As far as we have known, Th-1 and Th-2 cells are not two different CD4+ T-cell subsets, but it represents polarized forms of the highly heterogenous CD4+ Th cell–mediated immune response. Host genetic and microenvironmental factors could have contributed with series of modulatory factors including:1 the ligation of T-cell receptor (TCR);2 the activation of costimulatory molecules and its particular components;3 the predominance of an inflammatory cytokine in the local environment; and4 the number of postactivation cell divisions following exposure to antigens. Down-regulation of the Th-1 cell is associated with depression of cell-mediated immune response and stimulation of humoral immune response, thus pathogens are able to evade immune clearance.25
Porphyromonas gingivalis possess very sophisticated defense mechanisms against host immune responses. These pathogens produce capsules containing long chain LPS which is designed effectively to counter membrane attack complex. These long chain LPS can also downgrade cell-mediated immunity by shifting Th-1 into Th-2 which less dangerous to pathogens.26 LPS may have an essential role in switching cell-mediated to humoral-mediated immune responses.27 LPS Pg antigen is processed and presented on its surface with MHC-II molecule. Recent studies suggest an activation of alternative complement pathway, disruption of classical complement pathway, modulation of antigen presenting cells, and downregulation of anti-inflammatory cytokines are responsible for the Th2-skewed immune response following exposure to LPS Pg. Predominance shifting from Th-1 into Th-2 occurs in several extra-lymphoid tissues; the ideal site for Porphyromonas gingivalis is the oral cavity.28
Interleukin-4 (IL-4), which is produced by naive T cells, acts as autocrine manner known to be responsible for the differentiation and activation of Th-2 phenotype.29 Guo et al (2014) shows upon the occurrence and development of allergic diseases, there is a complex pathobiology which results in an imbalance of Th-1/Th-2.30 In an atopic disease such as bronchial asthma or urticaria, naive T cell can differentiate into Th-2 under IL-4–induced STAT6 and GATA-3 transcription factors.30 Th-2 predominant immune response will automatically stimulate plasma cell to release IgE and IgG4.31 Upon re-exposure of antigen or allergen, binding of the allergen to IgE orchestrates the adaptive immune system to initiate rapid sensitization. Frequent sensitization is a major risk factor for the development of allergic diseases such as urticaria, bronchial asthma, hay fever or atopic dermatitis/eczema.32
Our previous study used whole-cell body of Porphyromonas gingivalis to study different molecular responses in Wistar rats. Our first project studied the association between periodontal pathogen and host innate immunity. Exposure to Porphyromonas gingivalis had been shown to stimulate level of TLR2 and depress level of TLR4.33 Our findings might indicate that several bacterial properties can turn-off host innate immunity and host inflammatory response. Our second project studied the association between periodontal pathogen and host adaptive immunity. We summarized that high dose CFU of Pg stimulates fold increase of Th-2 cytokines (IL-4, IL-5 and IL-13) and decrease of Th-1 cytokines (IFN-γ and IL-17).34 These were the cornerstone to continue our project in studying LPS as the most important component of these bacteria.
At this moment, both total IgE or specific IgE antibodies have little diagnostic value in the occurrence of allergic manifestation. Even total or specific IgE is increasing, yet the manifestation of allergy doesn’t usually develop, since IgG4 level also increases as a counter-regulator.35 It means that even human or rat become susceptible to atopic allergy due to the increasing level of IgE, body mechanism is able to provide protection, with increased IgG4 as a counter response to prevent manifestation of allergic diseases and immediate hypersensitivity. Thus, exposure of LPS Pg will develop chance of atopic and hypersensitivity markers, but manifestation of allergic reaction is a complex pattern.36 IgG4/IgE ratio has closer accuracy to detect any alteration of atopic inflammatory pathway. Increase level of IgE, which isn’t accompanied by IgG4, can be seen in patients with urticaria or atopic dermatitis.37 IgE-switched B cells are much more likely to differentiate into plasma cells, whereas IgG4-switched B cells are less likely to differentiate.38 This reason would explain why IgE antibody is the most dominant antibody in the development of atopic inflammatory pathway, whereas IgG4 antibodies become prominent later during chronic non-atopic stimulation.39 According to this reason, IgG4/IgE ratio may predict atopic responses more accurately than total or specific IgE level.
Several limitations should be highlighted. First, this study had limitations with regard to very small number of samples which can increase the likelihood of error and imprecision. Second, results from animal models often do not translate into replications in humans.40 IgE antibody responses in Wistar rats are typically transient, whereas the atopic IgE response in human persists for many years.41 Other crucial difference is IgG4/IgE ratio, which is usually much higher in the Wistar rats than humans.42–43 These factors may have an impact on the interpretation of our results. Thus, the findings should be interpreted within the context of this study and its limitations. The strengths of the study were its high statistical power and the homogeneity of each group to enable comparison between groups and periods.
Several experiments in rats indicate that exposure to LPS Pg may have a tendency to increase levels of IgE and IgG4. On the contrary, declining IgG4/IgE ratio following exposure to LPS Pg suggests the potential role of LPS Pg for isotype switching from IgG4 to IgE. The results of the present study favor indirect isotype switching route for most IgE as secondary responses from LPS Pg infection that leads to systemic atopic inflammatory pathway.
Figshare: Raw Data - Atopic Biomarker Changes after Exposure to Porphyromonas gingivalis Lipopolysaccharide: A Small Experimental Study in Wistar Rat, https://doi.org/10.6084/m9.figshare.14350271.v1.44
This project contains the following underlying data:
- Data fixed LPS grup A.sav (Group 1 results)
- Data fixed LPS grup B1.sav (Group 2 results)
- Data fixed LPS grup B2.sav (Group 3 results)
- Data fixed LPS grup B3.sav (Group 4 results)
Data are available under the terms of the Creative Commons Attribution 4.0 International license (CC-BY 4.0).
| Views | Downloads | |
|---|---|---|
| F1000Research | - | - |
|
PubMed Central
Data from PMC are received and updated monthly.
|
- | - |
Provide sufficient details of any financial or non-financial competing interests to enable users to assess whether your comments might lead a reasonable person to question your impartiality. Consider the following examples, but note that this is not an exhaustive list:
Sign up for content alerts and receive a weekly or monthly email with all newly published articles
Already registered? Sign in
The email address should be the one you originally registered with F1000.
You registered with F1000 via Google, so we cannot reset your password.
To sign in, please click here.
If you still need help with your Google account password, please click here.
You registered with F1000 via Facebook, so we cannot reset your password.
To sign in, please click here.
If you still need help with your Facebook account password, please click here.
If your email address is registered with us, we will email you instructions to reset your password.
If you think you should have received this email but it has not arrived, please check your spam filters and/or contact for further assistance.
Comments on this article Comments (0)