Keywords
Pancreatic cancer, SEER database, PNETs, pancreatic neuroendocrine tumors, pancreatic cancer risk factors, Pancreatic cancer incidence, SEER 18
This article is included in the Oncology gateway.
Pancreatic cancer, SEER database, PNETs, pancreatic neuroendocrine tumors, pancreatic cancer risk factors, Pancreatic cancer incidence, SEER 18
As per global reports in 2018, pancreatic cancer remains the twelfth most common cancer in men and the eleventh in women1. Cancer-related deaths have pancreatic cancer as the seventh leading cause1. In the United States of America (USA), pancreatic cancer (PC) incidence has been increasing as previously reported1,2. PC mortality is estimated to rise as time progresses, and recent projections estimate that it might overpass colorectal cancer to become the second leading cancer-related cause of death after lung cancer3. In 2020 reports showed 57,600 new cases and 47,050 PC related deaths3. The PC risk increases with age, and the median age of diagnosis is 71 years4. Previously the increases were most significant for non-secretory endocrine cancers, followed by ductal adenocarcinomas and adenocarcinoma5.
The results were obtained from the analysis of the Surveillance Epidemiology and End Results (SEER) cancer registry database. SEER 18 includes 28% of the U.S. population as of the 2010 census6. The rates are available by expanded race/ethnicity of cases diagnosed, including white, black, Asian/Pacific Islander, and American Indian/Alaskan Native and Hispanic ethnicity. SEER 18 also includes adjustments for areas impacted by hurricanes Katrina and Rita. It contains a record for each of 8,131,919 tumors. 19 age groups are available and can be classified as < 1 year, 1–4 years, 5–9 years to 85+ years, or unknown. The registries included in SEER 18 are San Francisco-Oakland SMSA, Connecticut, Detroit (Metropolitan), Hawaii, Iowa, New Mexico, Seattle (Puget Sound), Utah, Atlanta (Metropolitan, San Jose-Monterey, Los Angeles, Alaska Natives, Rural Georgia, California excluding San Francisco, San Jose Monterey, Los Angeles, Kentucky, Louisiana, New Jersey, Greater Georgia. SEER 18 encompasses the SEER 13, which itself includes seer 9 in addition to supplementary registries6.
Within the SEER database, International Classification of Diseases (ICD)-0–2 was used through 20007, and ICD-0–3 following 2001 for coding the primary site and histologic type of diagnosed pancreatic cancer cases8. Site recode ICD-0–3/WHO 2008: Pancreas (ICD-O-3 site C25) was used via SEER*Stat software to select cases pancreatic cancer9. Only cases that were malignant and had a microscopically confirmed diagnosis were included. The ages below 30 years were filtered out due to reportedly low incidence per previous literature5. Cases were characterized into exclusive groups based on morphological classification of pancreatic cancer in the ICD (Numbers given below) for Oncology and previous similar study5,8. In addition to the undermentioned cases, all other cases were classified as poorly specified types.
• Adenocarcinoma, not otherwise specified (NOS) (8140)
• Mucinous adenocarcinoma (8480, 8481)
• Ductal adenocarcinoma excluding cystic or mucinous (8507, 8510, 8514, 8521, 8560, 8570, 8523, 8255, 8490, 8500)
• Cystic adenocarcinoma (8440, 8470, 8504)
• Intraductal papillary mucinous neoplasm (IPMN) (8453, 8471, 8503, 8144, 8450)
• Non-secretory endocrine (8150, 8246)
• Secretory endocrine (8151, 8152, 8156, 8153, 8155)
• Carcinoid tumors (8243, 8244, 8245, 8240, 8241)
• Acinar cell adenocarcinomas (8550, 8551),
• Solid pseudopapillary tumors (8452),
• Other adenocarcinoma (8145, 8260, 8441, 8154, 8574, 8460)
• Non-carcinomas (8680–9999)
SEER*Stat9 was utilized to calculate the incidence and age-adjusted rates, grouped by histologic subtype, gender, ethnicity, and age group. SEER 18 registry was used for analyzing tends with detailed racial group categories from 2000 to 2017 using yearly diagnosis. The period-specific rates were plotted and utilized temporal trend figures at two-year intervals and utilized a logarithmic scale with a base of 10 degrees portrayed rate per 100,000 person-years10. The annual percent changes (APCs) were quantified using annual rates for temporal trends (Table 1 & Table 2), and 95% confidence intervals (CIs) were included. SEER*Stat9 was used for all analyses6. Incidence Rate Ratios (IRRs) based on gender and ethnicity/race were calculated; these were further classified based on age groups and histological types. 95% CIs for the IRRs was calculated using the Tiwari method, and the figures were generated using Microsoft excel. Potential sources of bias include concern of patient migration across seer registries. Data is de-identified by SEER, and this potential for sample bias cannot be intervened but mentioned in this study's limitations.
| Males | ||||
|---|---|---|---|---|
| Race | Count | APC | LCI | UCI |
| White | 56991 | 3.4* | 3.3 | 3.6 |
| Black | 8807 | 4.2* | 3.8 | 4.6 |
| American Indian/Alaska Native | 396 | 7.4* | 4.7 | 10.1 |
| Asian or Pacific Islander | 5138 | 6.1* | 5.6 | 6.7 |
| Hispanic (All Races) | 7616 | 6.5* | 6 | 7 |
| Non-Hispanic unknown races | 133 | 17.1* | 12.2 | 22.2 |
| Females | ||||
| Race | Count | APC | LCI | UCI |
| White | 50344 | 2.9* | 2.7 | 3 |
| Black | 9489 | 4.2* | 3.8 | 4.6 |
| American Indian/Alaska Native | 383 | 2.7* | 0.7 | 4.7 |
| Asian or Pacific Islander | 5404 | 6.1* | 5.6 | 6.7 |
| Hispanic (All Races) | 7751 | 6.4* | 5.8 | 7 |
| Non-Hispanic unknown races | ~ | ~ | ~ | ~ |
APC = Annual percent change; UCI, LCI = Upper, Lower 95% confidence interval.
Confidence intervals are 95% for trends.
Percent changes were calculated using 1 year for each end point; APCs were calculated using weighted least squares method.
~ Statistic could not be calculated due to lower number of cases or at least one year with no reported cases.
* The APC is significantly different from zero (p<0.05).
Cases and annual percentage changes were only mentioned if there were enough cases to yield results after temporal trends analysis.
| Males | ||||
|---|---|---|---|---|
| Age groups | Count | APC | LCI | UCI |
| White | ||||
| 30–34 years | 112 | 3.3* | 0.2 | 6.4 |
| 35–39 years | 359 | 0.2 | -2.1 | 2.5 |
| 40–44 years | 869 | -2.3* | -3.7 | -0.9 |
| 45–49 years | 1,989 | -0.7 | -1.5 | 0.2 |
| 50–54 years | 3,931 | 0.9* | 0.2 | 1.6 |
| 55–59 years | 6,201 | 3.1* | 2.3 | 4 |
| 60–64 years | 7,997 | 4.7* | 4 | 5.4 |
| 65–69 years | 9,271 | 5.7* | 5.1 | 6.4 |
| 70–74 years | 8,978 | 3.8* | 3.1 | 4.5 |
| 75–79 years | 7,959 | 2.4* | 1.8 | 2.9 |
| 80–84 years | 5,871 | 2.7* | 1.9 | 3.4 |
| 85+ years | 3,454 | 5.4* | 4.4 | 6.4 |
| Black | ||||
| 30–34 years | ~ | ~ | ~ | ~ |
| 35–39 years | 84 | -1.3 | -5.4 | 3 |
| 40–44 years | 199 | -0.5 | -3 | 2 |
| 45–49 years | 484 | 0.3 | -1.6 | 2.3 |
| 50–54 years | 945 | 2.0* | 0.1 | 3.9 |
| 55–59 years | 1,333 | 4.4* | 2.9 | 6 |
| 60–64 years | 1,534 | 7.0* | 5.8 | 8.3 |
| 65–69 years | 1,384 | 4.9* | 3.6 | 6.2 |
| 70–74 years | 1,180 | 4.3* | 3.1 | 5.5 |
| 75–79 years | 847 | 4.0* | 2.2 | 5.9 |
| 80–84 years | 505 | 2.8* | 1.3 | 4.4 |
| 85+ years | 264 | 7.5* | 4.9 | 10.3 |
| Asian or Pacific Islander | ||||
| 30–34 years | ~ | ~ | ~ | ~ |
| 35–39 years | ~ | ~ | ~ | ~ |
| 40–44 years | 125 | 2.2 | -1.8 | 6.4 |
| 45–49 years | 221 | 5.3* | 1.8 | 9 |
| 50–54 years | 353 | 6.0* | 3.4 | 8.6 |
| 55–59 years | 513 | 4.6* | 3.1 | 6.1 |
| 60–64 years | 699 | 5.7* | 4.3 | 7.1 |
| 65–69 years | 788 | 6.9* | 5.3 | 8.5 |
| 70–74 years | 768 | 6.4* | 5.1 | 7.7 |
| 75–79 years | 690 | 5.8* | 4 | 7.7 |
| 80–84 years | 523 | 6.3* | 4.5 | 8.3 |
| 85+ years | 353 | 7.5* | 5.2 | 9.9 |
| Hispanics | ||||
| 30–34 years | ~ | ~ | ~ | ~ |
| 35–39 years | 123 | 1.9 | -2.4 | 6.4 |
| 40–44 years | 252 | 5.7* | 2.8 | 8.6 |
| 45–49 years | 454 | 3.9* | 1.5 | 6.4 |
| 50–54 years | 745 | 6.3* | 5 | 7.6 |
| 55–59 years | 914 | 7.2* | 5.6 | 8.8 |
| 60–64 years | 1,152 | 7.9* | 6.6 | 9.2 |
| 65–69 years | 1,119 | 7.3* | 6 | 8.6 |
| 70–74 years | 1,090 | 5.5* | 4.1 | 6.9 |
| 75–79 years | 866 | 5.3* | 3.9 | 6.7 |
| 80–84 years | 545 | 6.3* | 3.9 | 8.8 |
| 85+ years | 307 | 8.2* | 4.6 | 11.8 |
| Females | ||||
| White | ||||
| 30–34 years | 138 | 0.8 | -2.6 | 4.3 |
| 35–39 years | 284 | 0.3 | -2.4 | 3.1 |
| 40–44 years | 672 | 0 | -1.6 | 1.6 |
| 45–49 years | 1,427 | -0.2 | -1.6 | 1.3 |
| 50–54 years | 2,697 | 1.6* | 0.6 | 2.6 |
| 55–59 years | 4,402 | 3.6* | 2.6 | 4.6 |
| 60–64 years | 5,793 | 4.7* | 4.1 | 5.4 |
| 65–69 years | 7,150 | 5.0* | 4.3 | 5.8 |
| 70–74 years | 7,806 | 2.5* | 1.7 | 3.2 |
| 75–79 years | 8,183 | 1.3* | 0.8 | 1.7 |
| 80–84 years | 6,672 | 1.7* | 0.9 | 2.5 |
| 85+ years | 5,120 | 4.2* | 3.6 | 4.8 |
| Black | ||||
| 30–34 years | ~ | ~ | ~ | ~ |
| 35–39 years | ~ | ~ | ~ | ~ |
| 40–44 years | 194 | -0.2 | -3.3 | 3.1 |
| 45–49 years | 454 | 1.4 | -0.4 | 3.3 |
| 50–54 years | 734 | 3.1* | 1.3 | 4.8 |
| 55–59 years | 1,043 | 6.3* | 4.7 | 7.9 |
| 60–64 years | 1,386 | 6.0* | 4.7 | 7.2 |
| 65–69 years | 1,478 | 5.3* | 3.7 | 6.9 |
| 70–74 years | 1,353 | 3.6* | 2.5 | 4.6 |
| 75–79 years | 1,205 | 3.2* | 2.2 | 4.3 |
| 80–84 years | 899 | 3.4* | 2.1 | 4.7 |
| 85+ years | 602 | 3.6* | 1.3 | 5.9 |
| Asian or Pacific Islander | ||||
| 30–34 years | ~ | ~ | ~ | ~ |
| 35–39 years | ~ | ~ | ~ | ~ |
| 40–44 years | 110 | 3.0* | 0 | 6 |
| 45–49 years | 186 | 4.0* | 0.7 | 7.4 |
| 50–54 years | 286 | 2.8 | -1.1 | 6.9 |
| 55–59 years | 474 | 5.6* | 3.9 | 7.4 |
| 60–64 years | 625 | 7.1* | 5.5 | 8.7 |
| 65–69 years | 775 | 5.8* | 4.7 | 7 |
| 70–74 years | 866 | 5.2* | 3.8 | 6.6 |
| 75–79 years | 861 | 5.8* | 4 | 7.7 |
| 80–84 years | 662 | 6.2* | 4 | 8.5 |
| 85+ years | 475 | 9.7* | 7.7 | 11.8 |
| Hispanic | ||||
| 30–34 years | ~ | ~ | ~ | ~ |
| 35–39 years | 118 | 6.5* | 2.7 | 10.5 |
| 40–44 years | 206 | 6.2* | 4 | 8.5 |
| 45–49 years | 387 | 6.1* | 3.9 | 8.3 |
| 50–54 years | 563 | 6.4* | 4.4 | 8.4 |
| 55–59 years | 808 | 6.3* | 4.3 | 8.3 |
| 60–64 years | 1,035 | 7.2* | 5.7 | 8.7 |
| 65–69 years | 1,112 | 7.0* | 5.5 | 8.6 |
| 70–74 years | 1,133 | 4.9* | 3.8 | 6 |
| 75–79 years | 1,080 | 4.7* | 3.7 | 5.7 |
| 80–84 years | 722 | 7.8* | 6.6 | 9 |
| 85+ years | 515 | 6.8* | 4.7 | 8.9 |
| Males | ||||
| Histological Types | Count | APC | LCI | UCI |
| White | ||||
| Adenocarcinoma, not otherwise specified | 39,237 | 3.3* | 3 | 3.5 |
| Ductal adenocarcinoma excluding cystic or mucinous | 6,292 | 6.6* | 6 | 7.3 |
| Ductal specified as arising from an intraductal papillary mucinous neoplasm | 195 | 4.6* | 2 | 7.3 |
| Non-secretory Endocrine | 2,572 | 3.8* | 0.7 | 7.1 |
| Secretory endocrine | 67 | 1.6 | -2.2 | 5.6 |
| Carcinoid tumors | 1,244 | 32.5* | 26.8 | 38.4 |
| Acinar cell adenocarcinomas | 242 | 5.9* | 3.1 | 8.7 |
| Mucinous adenocarcinoma | 2,079 | -3.0* | -3.9 | -2.1 |
| Other adenocarcinoma | 170 | -0.4 | -3 | 2.3 |
| Black | ||||
| Adenocarcinoma, not otherwise specified | 6,203 | 4.2* | 3.7 | 4.7 |
| Ductal adenocarcinoma excluding cystic or mucinous | 859 | 7.5* | 6.5 | 8.6 |
| Endocrine: non-secretory | 328 | 6.1* | 1.1 | 11.3 |
| Mucinous adenocarcinoma | 274 | -2.7* | -4.9 | -0.5 |
| American Indian/Alaska Native | ||||
| Adenocarcinoma, not otherwise specified | 281 | 7.0* | 3.9 | 10.2 |
| Ductal adenocarcinoma excluding cystic or mucinous | 40 | 13.4* | 8.4 | 18.7 |
| Asian or Pacific Islander | ||||
| Adenocarcinoma, not otherwise specified | 3,334 | 5.7* | 4.8 | 6.5 |
| Ductal adenocarcinoma excluding cystic or mucinous | 649 | 8.5* | 6.6 | 10.4 |
| Endocrine: non-secretory | 237 | 6.7* | 2 | 11.5 |
| Mucinous adenocarcinoma | 183 | 2.1 | -1.3 | 5.5 |
| Hispanics | ||||
| Adenocarcinoma, not otherwise specified | 5,208 | 6.1* | 5.4 | 6.7 |
| Ductal adenocarcinoma excluding cystic or mucinous | 807 | 11.3* | 9.6 | 13 |
| Endocrine: non-secretory | 328 | 6.8* | 2.9 | 10.8 |
| Mucinous adenocarcinoma | 237 | 2 | -0.4 | 4.5 |
| Females | ||||
| White | ||||
| Adenocarcinoma, not otherwise specified | 34,955 | 2.9* | 2.6 | 3.1 |
| Ductal adenocarcinoma excluding cystic or mucinous | 5,736 | 6.1* | 5.5 | 6.8 |
| Cystic adenocarcinoma | 185 | -9.1* | -12.1 | -6.1 |
| Ductal specified as arising from an intraductal papillary mucinous neoplasm | 165 | 3.4* | 0.9 | 5.9 |
| Endocrine: non-secretory | 1,785 | 3.7* | 0.5 | 7 |
| Secretory endocrine | 80 | -1.8 | -5 | 1.6 |
| Carcinoid tumors | 863 | 30.3* | 24.5 | 36.4 |
| Acinar cell adenocarcinomas | 82 | 2.1 | -1.3 | 5.7 |
| Mucinous adenocarcinoma | 2,032 | -2.7* | -3.7 | -1.6 |
| Other adenocarcinoma | 130 | -1.1 | -4.9 | 2.9 |
| Black | ||||
| Adenocarcinoma, not otherwise specified | 6,615 | 4.0* | 3.5 | 4.4 |
| Ductal adenocarcinoma excluding cystic or mucinous | 961 | 8.4* | 6.8 | 10 |
| Endocrine: non-secretory | 363 | 3.7 | -0.2 | 7.8 |
| Carcinoid tumors | 228 | 26.9* | 20.9 | 33.2 |
| Mucinous adenocarcinoma | 355 | -2.8* | -4.7 | -0.9 |
| American Indian/Alaska Native | ||||
| Adenocarcinoma, not otherwise specified | 260 | 1.1 | -1.2 | 3.5 |
| Ductal adenocarcinoma excluding cystic or mucinous | 43 | 7.1* | 3.9 | 10.5 |
| Asian or Pacific Islander | ||||
| Adenocarcinoma, not otherwise specified | 3,552 | 5.7* | 5 | 6.4 |
| Ductal adenocarcinoma excluding cystic or mucinous | 746 | 9.6* | 7.5 | 11.7 |
| Endocrine: non-secretory | 196 | 4.6 | -0.9 | 10.4 |
| Mucinous adenocarcinoma | 195 | 0.1 | -3.2 | 3.5 |
| Hispanic | ||||
| Adenocarcinoma, not otherwise specified | 5,148 | 6.0* | 5.3 | 6.7 |
| Ductal adenocarcinoma excluding cystic or mucinous | 872 | 10.1* | 8.2 | 12 |
| Endocrine: non-secretory | 315 | 6.5* | 2.7 | 10.6 |
| Mucinous adenocarcinoma | 307 | -0.4 | -2.5 | 1.7 |
APC = Annual percent change; UCI, LCI = Upper, Lower 95% confidence interval.
Confidence intervals are 95% for trends.
Percent changes were calculated using 1 year for each end point; APCs were calculated using weighted least squares method.
~ Statistic could not be calculated due to lower number of cases or at least one year with no reported cases.
* The APC is significantly different from zero (p<0.05).
Cases and annual percentage changes were only mentioned if there were enough cases to yield results after temporal trends analysis.
SEER 18 allowed us to explore short-term, nonetheless, relatively recent and previously unreported trends in pancreatic cancer (Table 1) (Figure 1). The incidence rate of white males has increased significantly during 2000–2017 (APC = 3.5%) compared to previously reported APC of 0.95% from 1994–20135. The incidence of white females also increased from an APC of 1.29% (1999–2013) to 2.9% (2000–2017)5. Rates among black males and females have also increased in recent years, per our analysis, with an APC of 4.2% each, respectively. Previously, the rates among black males decreased, while rates remained unchanged among black females (1975–2013)5.
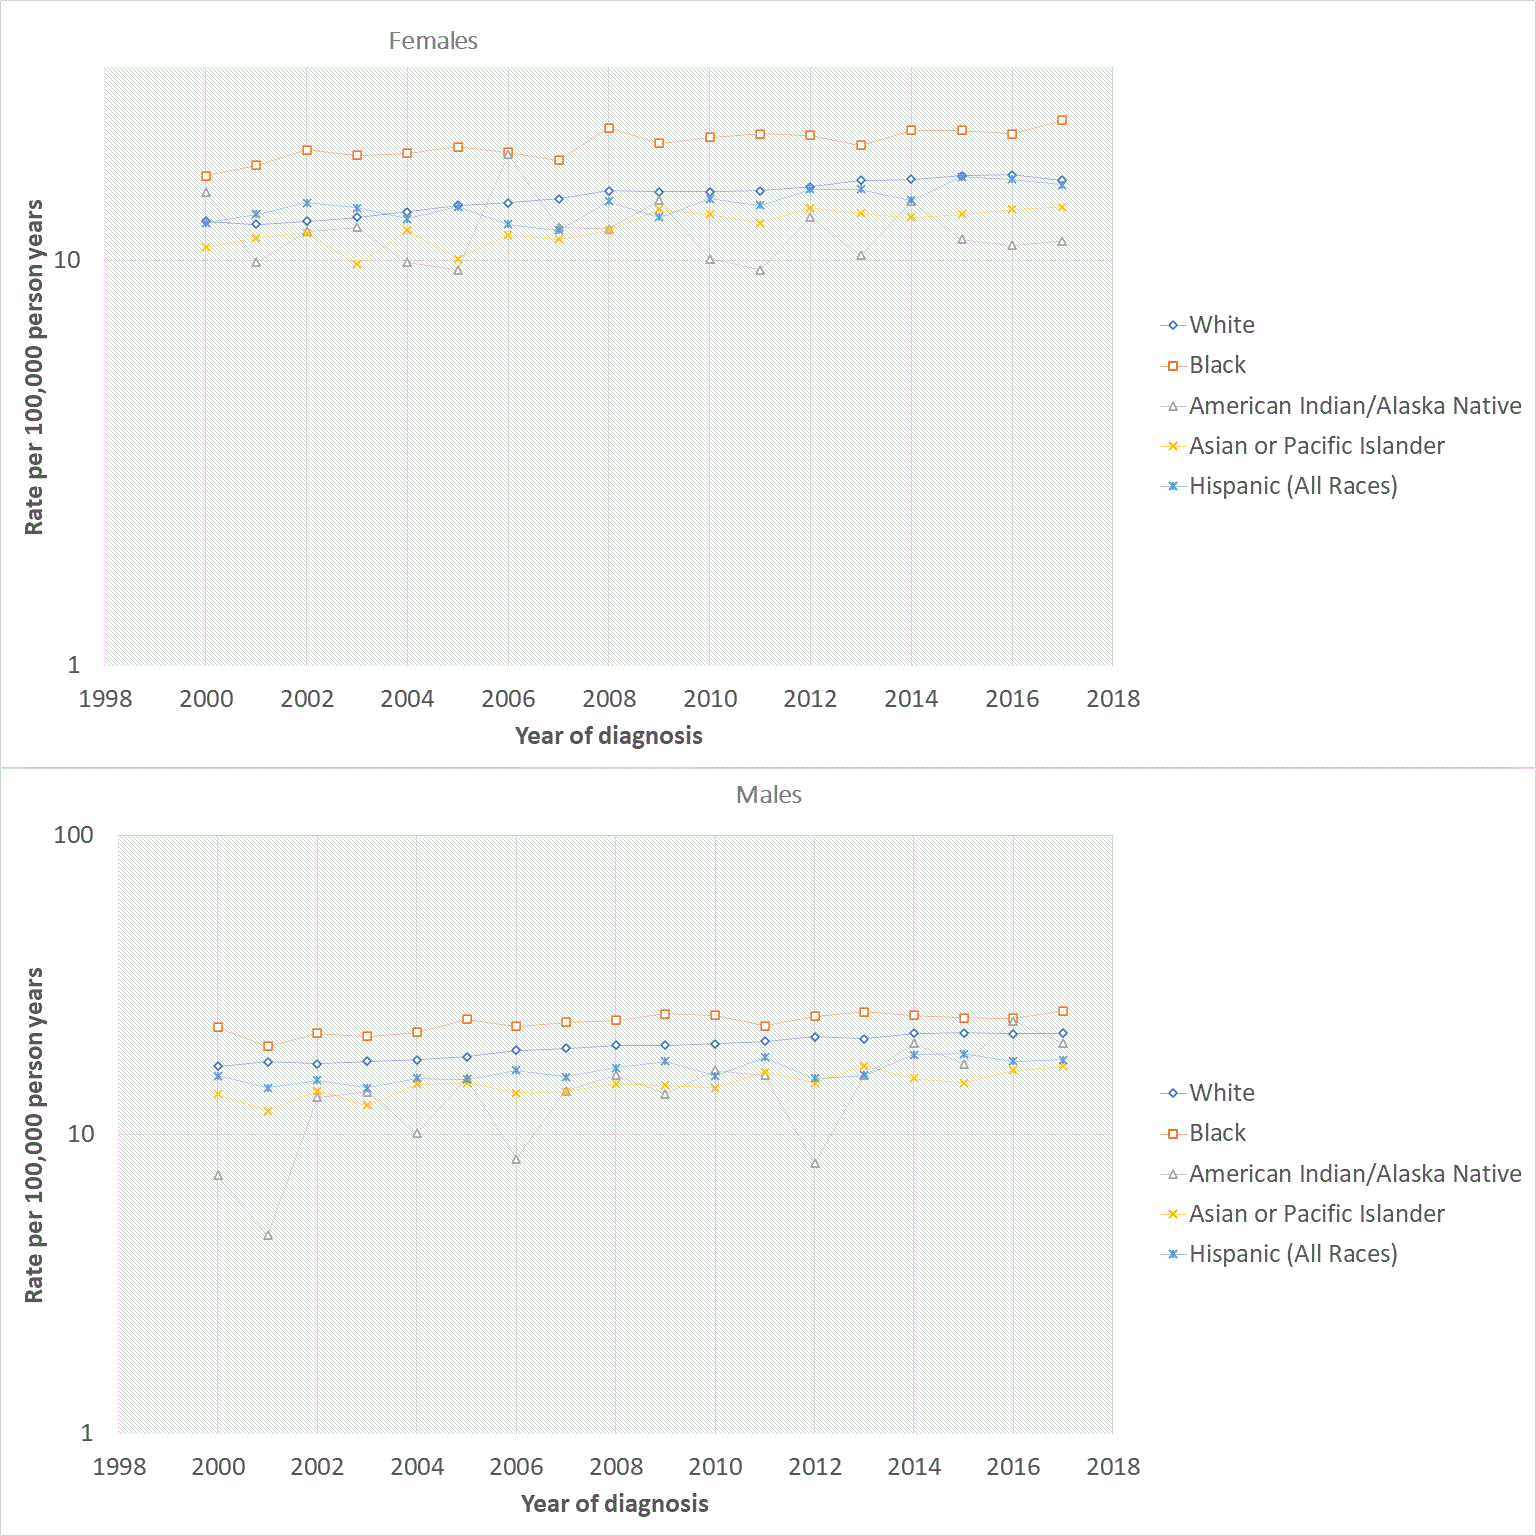
a: Females, b: Males.
Rates among Hispanic men and women have continued to increase (APC = 6.5% and 6.4%). Similarly, rates among American Indian/Alaska Native in men increased more than women (APC = 7.4% vs. 2.1%). In Asian or Pacific Islander, the APC was similar in both genders (6.1%) as compared to lower incidence rates of 0.16% for males and 1.23% for females (1992–2013)5.
There was a positive trend in rates for white males from ages 30–39 and ≥50 years for the 5-year age groups up to 85 and above as shown in Table 2 and Figure 2. White females showed a statistically significant positive trend from age ≥50. Interestingly, ages 40–49 showed a negative trend in white males, and age group 40–44 had a statistically significant negative APC of -2.3%.

a: Males, b: Females.
Both genders in the black population showed a positive trend after age ≥ 45 (Table 2) (Figure 2). It was impossible to calculate APCs among younger age groups for black females due to at least one year with zero cases. Age-specific rates also rose among Asians or pacific islanders and Hispanic men from ages ≥ 35 and ≥ 40, respectively (Figure 2). APCs for females of Asians or pacific islanders and Hispanic ethnicity also showed a positive trend after ages ≥ 40 and ≥ 35, respectively (Figure 2). Further analysis was performed to explore trends in American Indian/Alaskan native (Figure 2). However, APCs could not be calculated in either males or females for any age group due to at least one year with zero cases. The results are therefore not shown in tables. From 2000 to 2017, for ages, more than 30 years, 152,548 of 190,586 pancreatic cancer cases (80.04%) diagnosed had a microscopic confirmation. This represented an increase compared with the 77% microscopically confirmed cases from 1992–2013, including all ages. (Results are not shown). We did not report the analysis of the temporal trends by following histologic-type groups due to the number of cases being too low: cystic adenocarcinoma (n= 408), ductal specified as arising from an IPMN (n = 520), secretory endocrine (n = 203), other adenocarcinomas: acinar cell (n = 438), solid pseudopapillary tumors (n = 228), other adenocarcinomas (n = 448), other non-carcinomas (n = 6).
Rates for pancreatic adenocarcinoma, the most common histologic type of pancreatic cancer, continued to rise in all ethnicities from 2000–2017. The rates for ductal adenocarcinoma (excluding mucinous and cystic) showed a positive trend in all races (including American Indian/Alaska Native) with the APC ≥ 6 % for females and APC ≥ 6.5 % for males (Table 2) (Figure 3). The rates of non-secretory endocrine tumors showed a decline in both genders of all five races in recent years after showing an initial positive trend till 2010. However, the APC from 2000–2017 remained positive and ≥ 3.5% for males and females (Table 2). APC for American Indian/Alaska Native was not calculated due to at least one year with zero cases; however, trends are reported in Figure 3.
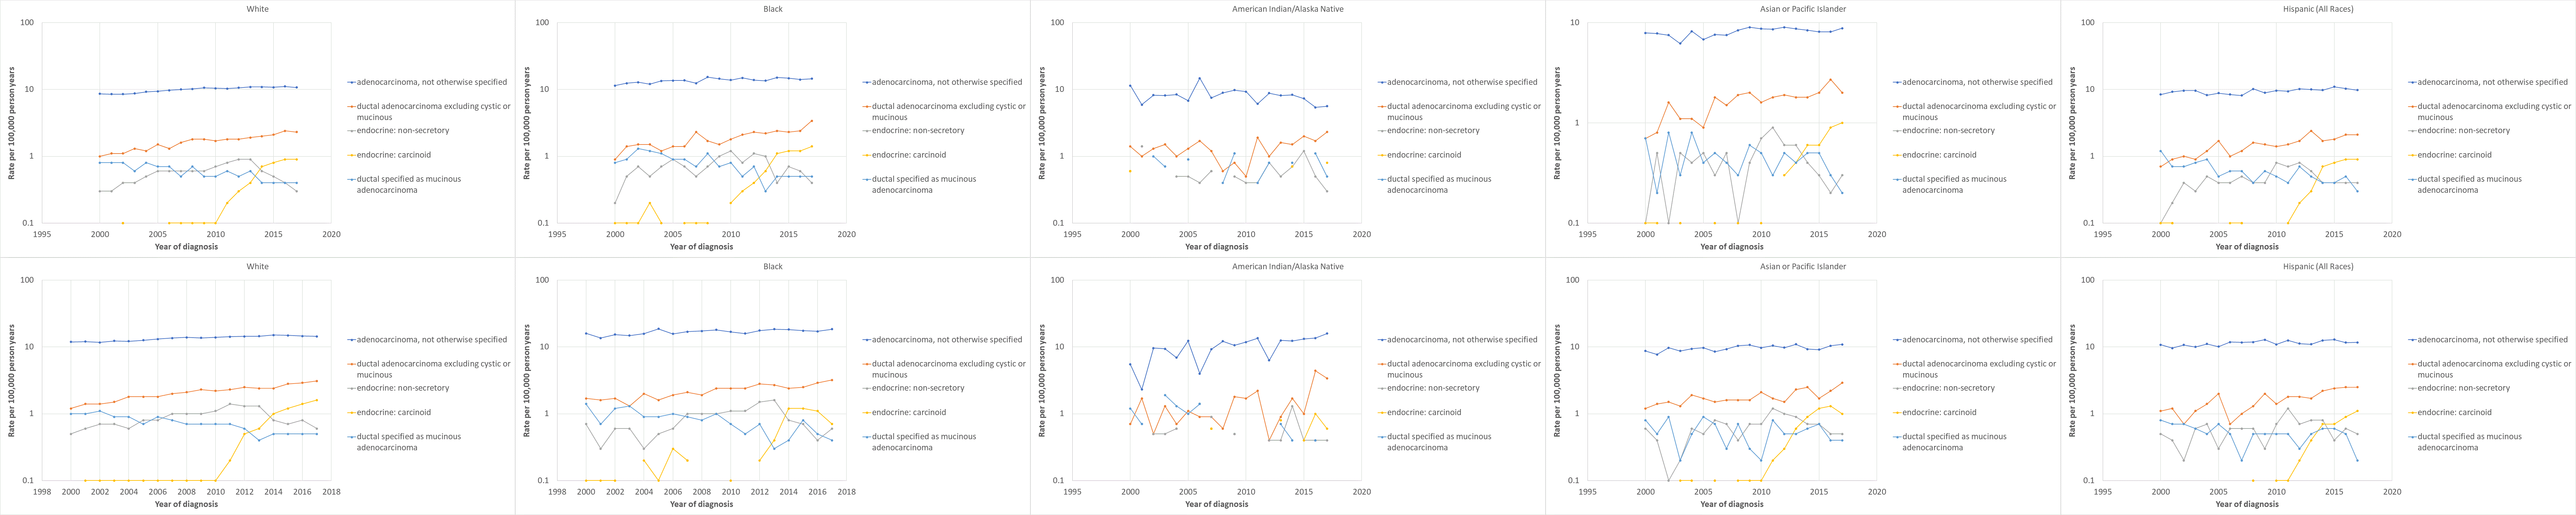
a: Males, b: Females.
Interestingly, the rates for carcinoid endocrine tumors showed a positive trend and rise in rates from 2010 and onwards (Figure 3), which was not reported previously. The APC was highest in white males and females, and black females (32.5%, 30.3%, and 26.9%, respectively). APCs for the rest of the races were not reported as statistics were incalculable as at least one year had no reported cases from 2000 to 2017.
In SEER 18 (2000–2017), 152,548 cases were microscopically confirmed from ages ≥ 30; males: 79081 and females: 73,467. This was higher than previously reported rates, which was 69,049 in males and 69,548 in females (2000–2013)5. The IRR was greater in males’ total cases (IRR 1.32,95% CI 1.30-1.33) (Table 3). All age groups from 35 and above showed an increased incidence risk in males vs. females (IRRs >1: increased risk) (Table 3). Rates among males were higher compared to females for all histological subtypes except ductal cystic adenocarcinoma (0.5,95% CI 0.4-0.6), secretory endocrine tumors (0.9, 95% CI 0.9-1.3), solid pseudopapillary (0.2, 95% CI 0.2-0.3) and non-carcinomas (0.1, 95% CI 0.7-7.7). Carcinoid endocrine tumors also showed a greater IRR in males (1.4, 95% CI 1.3-1.5) (Table 3).
For SEER 18 (2000–17), the highest rates for pancreatic cancer in ages greater than 30, were in both black males and females (IRR = 1.21 and 1.36, respectively) when compared to white (non-Hispanic) ethnicity. Incidence, when compared to white (non-Hispanic) ethnicity, was higher in both black males and females (IRR = 1.21 and 1.36, respectively). The rates for both genders in American Indian/Alaska, Native Asian, or Pacific Islander Hispanic (All Races) was lower as compared to the white(non-Hispanic) race (Table 4).
Rates are per 100 000 person-years, age-adjusted to the 2000 US Standard Population (19 age groups - Census P25–1130).
IRR = Incidence Rate Ratios (based on unrounded rates); LCI, UCI = lower, upper 95% confidence interval.
Confidence intervals (Tiwari mod) are 95% for the ratios.
The reference group is White non-Hispanic.
Our statistical analysis for SEER 18 registry revealed reportable findings by histologic subtype and demographic details. Incidence rates of pancreatic carcinomas increased amongst white males and females consistently. Incidence rates for black, Asian, or pacific inlander and Hispanics all rose in recent years for both genders. Rates for American Indian/Alaskan natives were inconsistent throughout 2000–2017; however, the final annual percent change remained positive for males (7.4%, CI 4.7-10.1) and females (2.7%, 0.7-4.7). Based on histological type, the overall increase in incidence remained secondary to pancreatic adenocarcinoma, as mentioned in a previous similar study5.
Pancreatic carcinoma rates more predominantly rose in males when compared to females. In white males and females, there was a female prominence noted for incidence rates of age group 30–34 (Table 2, Table 3). Rates for other ethnicities for ages <45 were comparable or could not be analyzed due to the lower number of cases. Rates of common histologic types were more in males, except for cystic adenocarcinoma, secretory endocrine cancers, solid pseudopapillary cancers, and non-carcinomas. This differs based on the histological type could be attributed to cystic adenocarcinoma and solid pseudopapillary cancers as they had the highest female predominance. Previous research comparing male to female incidence rate ratios also came to a similar conclusion for long-term rates from 1975–2003 and 2000 – 20135. A review of 718 patients in 2005 stated a female predominance of solid pseudopapillary pancreatic cancers; almost 90% occurred in younger females aged between 19 to 50, with a ratio of close to 10:1 for females to males11. A systemic review also showed an increased predominance of cystic adenocarcinomas in females, and our results were consistent with these studies12.
An interesting finding in our analysis was the recent rise in pancreatic endocrine carcinoid tumors in all ethnicities. There was a male predominance with (IRR 1.4%, CI 1.3-1.5). The rates were highest in white males and started to increase after 2010 in all races except American Indian/Alaska Native who showed sporadic rise (Figure 3). The black and Asian or pacific inlanders' incidence rates showed some plateau/decline in recent years (Figure 3). A previous study on pancreatic neuroendocrine tumors (PNETs) suggested that cigarette smoking, Type II Diabetes, and family history in a first-degree relative are independent risk factors for non-functional PNETs. Another independent risk factor for functional PNETs was found to be heavier consumption of alcohol13. No study currently comments solely on the risk factors of pancreatic carcinoid tumors, and it would be interesting to see associated risk factors for this recent rise. Our analysis revealed a rising rate of pancreatic carcinoid tumors with age, however, the results declined for ages >75 (results not shown).
Rates for intraductal papillary mucinous tumors and secretory endocrine carcinomas were similar in both genders. IPMN are malignancies of the pancreas that grow within the pancreatic ducts and produce mucin, hence the name. The risk factors of IPMN are not well understood. However, possible risk factors include insulin-dependent diabetes mellitus, chronic pancreatitis, positive family history, and smoking14. Our analysis revealed a decline in mucinous adenocarcinomas (Figure 3). This is consistent with the previously reported study5. This can be explained by the fact that improved diagnostic imaging has enabled the detection of cystic or mucinous precursor lesions at an earlier stage. Our analysis only included only malignant lesions15.
Numerous risk factors exist for pancreatic carcinoma and could be the reason behind the rising incidence. Individuals with non-O blood groups (type A, AB, or B) are more prone to the risk of pancreatic cancer16. A possible link between Helicobacter pylori infection and non-O blood type may also exist; however, evidence is still lacking17. Cystic fibrosis patients are at a greater risk of pancreatic cancer, especially adenocarcinoma, as their life span increases. It was also two to five-fold higher in patients with a history of organ transplantation18. Up to 10% of pancreatic cancer patients have a family history19. Some studies, though not explicit, identified a germline mutation involving a known susceptibility gene for pancreatic cancer (including BRCA, ATM, CDKN2A and PALB2) in patients with familial etiology20.
Chronic pancreatitis is also a risk factor for pancreatic cancer21. This is hypothesized due to inflammation-induced metaplasia of the acinar cells into ductal cells by NF-kB and matrix metalloproteinases21. Patients with a type of neoplastic pancreatic cyst, intraductal papillary mucinous neoplasm of the pancreas (IPMN) can develop an invasive malignancy called IPMN-associated adenocarcinoma. These patients can also develop ductal adenocarcinoma22. Smoking is the most common cause of pancreatic cancer. Studies show a linear relationship with the number of cigarettes smoked23. However, the risk of pancreatic cancer decreases by 48% two years after smoking cessation. This is equivalent to that of non-smokers by 10 to 15 years after smoking cessation23. Individuals who struggle with body weight develop pancreatic cancer at a relatively younger age with shorter survival compared to individuals with normal bodyweight24. Data regarding the effects of alcohol and coffee consumption has always been conflicting. Pooled analysis data showed a slight increase in the risk of pancreatic cancer in heavy drinkers and a high intake of coffee. This could be due to the confounder, which is cigarette smoking25. An inverse relationship between consumption of a healthy diet and pancreatic cancer26. However, the protective advantages of a healthy diet were only significant in men who were overweight/obese26. Low levels of selenium and lycopene were found in subjects who developed pancreatic cancer in later life, however, the results are unclear27. Though studies have shown an association with Hepatitis B and C with pancreatic cancer, the magnitude of risk is still significantly less than hepatocellular cancer28. Numerous studies show an association between diabetes and pancreatic cancer. A meta-analysis showed the relative risk for pancreatic cancer in diabetes compared to the non-diabetic counterparts was 2.0829. Defects in metabolism of glucose, insulin resistance, and hyperinsulinemia are few etiologic factors for pancreatic cancer30–32. Increased risk of pancreatic cancer in patients with metabolic syndrome could be due to lower levels of adiponectin (a protein hormone linked to glucose level regulation and fatty acid breakdown), which results in a lack of insulin-sensitizing and anti-inflammatory capabilities33.
Our study had its limitations, especially from an etiological point of view, as SEER does not report any risk factors, which can influence these trends. Comorbidities like obesity, diabetes, smoking are also not reported. There is a concern of migrating patients in and out of areas registered in the SEER database and selection bias. The data of the SEER registry holds high-grade quality, and statistics based on population can be informative of risk patterns and trends based on time. The critical strength of our studies was the large sample size, as SEER 18 covers more recent cases up to 2017 and covers almost 30% of the US population. It also allowed us to analyze histological types of pancreatic cancer.
Pancreatic cancer incidence rates have continued to rise according to SEER 18 (2000–2017) in the USA. Our analysis concludes incidence of pancreatic cancer patterns based on demographical data and histologic type. We report the new rising incidence of pancreatic carcinoid tumors and the continued rise of pancreatic adenocarcinoma. We also report an increased incidence of cystic adenocarcinoma and solid pseudopapillary cancers in females as compared to males. These trends could be secondary to known risk factors for pancreatic carcinomas. Further comparative data regarding exclusive risk factors and contributing factors for histological subtypes of pancreatic carcinomas, specially PNETs, are required to understand the recent increase in incidence.
All data underlying the results are available as part of the article and no additional source data are required.
Hassam Ali: Conceptualization, Methodology, Software, Validation, Writing- Reviewing and Editing. Meghana Vallabhaneni: Data curation, Writing- Original draft preparation. Rahul Pamarthy: Visualization, Project administration, Investigation. Shiza Sarfraz: Supervision, software, resources. Hadiqa Ali: Software, Validation. Hamza Rafique: Writing- Reviewing and Editing.
| Views | Downloads | |
|---|---|---|
| F1000Research | - | - |
|
PubMed Central
Data from PMC are received and updated monthly.
|
- | - |
Provide sufficient details of any financial or non-financial competing interests to enable users to assess whether your comments might lead a reasonable person to question your impartiality. Consider the following examples, but note that this is not an exhaustive list:
Sign up for content alerts and receive a weekly or monthly email with all newly published articles
Already registered? Sign in
The email address should be the one you originally registered with F1000.
You registered with F1000 via Google, so we cannot reset your password.
To sign in, please click here.
If you still need help with your Google account password, please click here.
You registered with F1000 via Facebook, so we cannot reset your password.
To sign in, please click here.
If you still need help with your Facebook account password, please click here.
If your email address is registered with us, we will email you instructions to reset your password.
If you think you should have received this email but it has not arrived, please check your spam filters and/or contact for further assistance.
Comments on this article Comments (0)