Keywords
Blood Pressure, Body Mass Index, Diabetes Mellitus Type 2, Nepal
Blood Pressure, Body Mass Index, Diabetes Mellitus Type 2, Nepal
The manuscript is revised based on the reviewer's comments. More information on prevalence and risk factors for diabetes is added. We have also added a statement describing the rationale of the review. Furthermore, we have elaborated the qualitative summary.
See the authors' detailed response to the review by Chudchawal Juntarawijit
See the authors' detailed response to the review by Sijan Basnet
The burden of type 2 diabetes mellitus (T2DM) is increasing across the globe with time. The growing prevalence of diabetes lead to big impact in societal socio-economic and health aspect1. In 2019, the International Diabetes Federation (IDF) estimated that 463 million adults worldwide had diabetes1. The statistics showed that these individuals were in the age range of 20 to 79, have diabetes, and 79.4% were from low- and middle-income countries1. Additionally, IDF estimates that the global prevalence of diabetes will be 578.4 million by 2030, with this rising to 700.2 million by 2045 among adults aged between 20 to 79 years1 In the region of Southeast Asia, the prevalence of diabetes was 8.8% in 2019, and this is projected to increase to 9.7% by 20302. T2DM still remains a major cause of worldwide morbidity and mortality, which leads to complications such as neuropathy, nephropathy, stroke, and coronary artery disease3. In 2017, over 10, 000 individuals died due to T2DM or diabetes-related complications in Nepal, which is the 11th most common cause of disability in terms of disability-adjusted life years (DALYs) (1226 DALYs per 10,000 population)4. In 2020, the prevalence of T2DM in Nepal was 8.5% (95% CI 6.9–10.4%), which was higher than that of 8.4% (95% CI 6.2–10.5%) in 20145,6. Similarly, in 2020 the prevalence of pre-diabetes was 9.2% (95% CI 6.6 – 12.6%) compared to 2014, which was 10.3% (95% CI 6.1–14.4%)5,6. In the advent of growing non-communicable diseases, a Multi-Sectoral Action Plan has been adopted by the government of Nepal to prevent and control non-communicable diseases including T2DM7. There are several prevalence studies across the countries and in different localities, however, there is no appropriate pooling of the data on the risk factors of T2DM in Nepal. Thus, with the objective to pool the available data on prevalence and risk factors for pre-diabetes, and T2DM in Nepal over the past 20 years we conducted this meta-analysis. Pooling the studies done in various parts of the country by gathering data of individual prevalence and risk factor study on T2DM can be helpful for the further prevention and control of this disease. This will build the foundation of the evidence for evidence based practice.
The systematic review is registered in PROSPERO (CRD42020215247). It is documented as per the guidelines of the Meta-Analysis of Observational Studies in Epidemiology (MOOSE)8,9.
Electronic databases such as PubMed, PubMed Central, Google Scholar, Scopus, and Embase were used to search relevant articles (Extended data file 110). Published articles from 2000 to 2020 were searched with the use of the appropriate keywords such as “diabetes mellitus”, “high blood sugar”, “type 2 diabetes”, “prevalence”, “risk factor” and “Nepal” along with relevant Boolean operators.
All published studies that took place in Nepal from 2000–2020 were included in this review. These studies comprised of cross-sectional studies, case series that reported on more than 50 patients, cohort study, randomized control trial (RCTs) that were based on prevalence of T2DM and/or its related issues such as risk factors, outcome, and outcome predictors.
Editorials, commentaries, viewpoint articles without adequate data on T2DM and its related issues were excluded. Furthermore, studies that took place before 1999, outside of Nepal, as well as those that were on Type 1 and gestational diabetes were excluded.
The studies were selected with the use of Covidence11. The title and abstract were screened based on the inclusion criteria independently by two authors (SL, SN). Discrepancies were resolved by consensus obtained from the third author (AM). Further full-text review (SN, AM) was done independently, and discrepancies (SL) were resolved.
Three authors (SL, AM, and SN) were independently involved in the data extraction and adding that to a standardized form in Excel. The accuracy and completion of each other's work was verified by all the reviewers. The characteristics extracted for each selected study included, first author, year, study design, sample size, study location, prevalence rate, and risk factors of T2DM such as Body Mass Index (BMI), exercise (moderate to high level of exercise (≥ 30 minutes/days) is taken as adequate), waist circumference (≥85 cm in females, and ≥90 cm in males were defined as high), family history, fruit and vegetable serving per day, alcohol, smoking/tobacco, literacy, and increased blood pressure (BP) (≥140/90 mmHg is taken as hypertensive) (Please see Underlying data12).
T2DM was defined as a fasting blood glucose (FBG) of ≥ 126 mg/dl (7.0 mmol/l) or a 2-h oral glucose tolerance test (OGTT) blood glucose level of ≥ 200 mg/dl (11.1 mmol/l). Prediabetes was defined as FBG level between 100 (5.6 mmol/l) and 125 mg/dL (< 7 mmol/l) or a 2-h OGTT blood glucose level between 140 (7.8 mmol/l) and 199 mg/dl (11 mmol/l). Impaired glucose tolerance (IGT) was defined as two-hour glucose levels of 140 to 199 mg per dL (7.8 to 11.0 mmol) on the 75-g oral glucose tolerance test13.
Bias assessment of the included studies was done by the Joanna Briggs Institute (JBI) tool (Table 1)14.
| Author/year | Was the sample frame appropriate to address the target population? | Were study participants sampled in an appropriate way? | Was the sample size adequate? | Were the study subjects and the setting described in detail? | Was the data analysis conducted with sufficient coverage of the identified sample? | Were valid methods used for the identification of the condition? | Was the condition measured in a standard, reliable way for all participants? | Was there appropriate statistical analysis? | Was the response rate adequate, and if not, was the low response rate managed appropriately? |
|---|---|---|---|---|---|---|---|---|---|
| Sharma B16 et al. 2019 | yes | yes | No | Yes | Yes | yes | yes | yes | yes |
| Gyawali B17 et al. 2018 | yes | yes | Yes | Yes | Yes | yes | yes | yes | yes |
| Sharma SK18 et al. 2011 | yes | yes | Yes | Yes | Yes | yes | yes | yes | yes |
| Sharma SK19 et al. 2013 | yes | yes | Yes | Yes | yes | yes | yes | yes | yes |
| Chhetri MR20 et al. 2009 | yes | yes | Yes | Yes | yes | yes | yes | yes | yes |
| Paudyal G21 et al. 2008 | yes | yes | Yes | Yes | yes | yes | yes | yes | yes |
| Bhandari GP22 et al. 2014 | yes | yes | Yes | Yes | yes | yes | yes | no | yes |
| Karki P23 et al. 2000 | yes | yes | Yes | Yes | yes | yes | yes | no | yes |
| Paudel S24 et al. 2020 | yes | yes | Yes | Yes | yes | yes | yes | yes | yes |
| Koirala S25 et al. 2018 | yes | yes | yes | Yes | yes | yes | yes | yes | yes |
| Ranabhat K26 et al. 2016 | no | yes | no | Yes | yes | yes | yes | yes | yes |
| Mehta KD27 et al. 2011 | yes | yes | yes | Yes | yes | yes | yes | yes | yes |
| Shrestha UK28 et al. 2006 | yes | yes | yes | Yes | yes | yes | yes | yes | yes |
| Dhimal M29 et al. 2019 | yes | no | yes | Yes | yes | yes | yes | yes | yes |
| Kushwaha A30 et al. 2020 | no | yes | no | Yes | yes | yes | yes | yes | yes |
The heterogeneity in the included studies was assessed based on the Cochrane Handbook for Systematic reviews by the I2 statistics (I2>50%)15. Thus, a random-effects model with the inverse variance heterogeneity model was performed. If I²>50% significant heterogeneity random effect model was preferred. If I²<50% then fixed effect model was preferred.
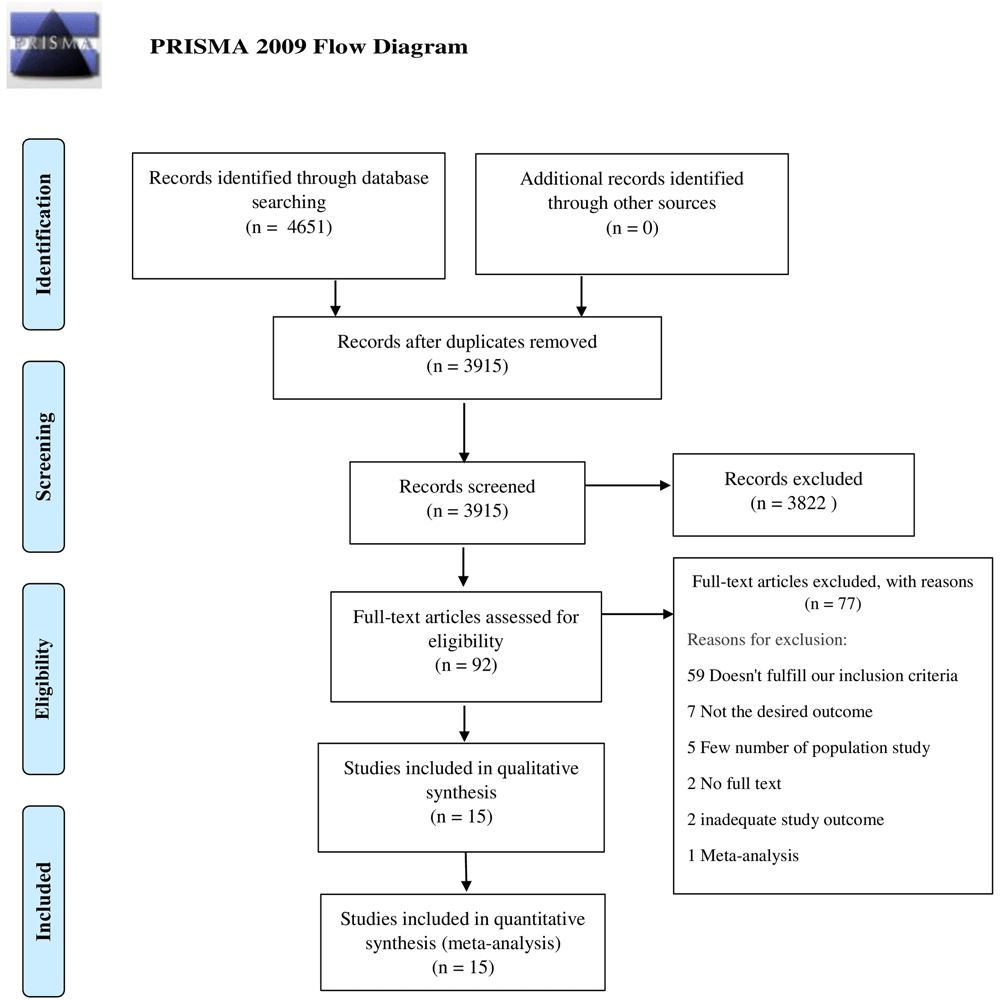
A total of 4651 studies were analyzed after thorough database search, of which 736 were identified as duplicates and removed. Title and abstracts of 3915 studies were screened and 3822 studies were excluded. The full-text eligibility of 92 studies was assessed and 77 studies were excluded for definite reasons. A total of 15 studies were included in the qualitative and quantitative analysis. The following information is depicted in the PRISMA flow diagram (Figure 1).
A qualitative summary of all 15 individual study is presented in (Table 2). Nine studies were done in community setting while rest six were done in hospital setting. Two community based studies, and one hospital based study included sample from different part of Nepal to represent the country, while rest were loco-regional studies.
| Author/s | Study Year | Study Design | Sample Size | Study Area | Pre-diabetes | T2DM | IGT |
|---|---|---|---|---|---|---|---|
| Dhimal M29 et al. 2019 | 2019 | Cross-sectional study | 12557 | 72 districts (all provinces) | 1067/12557 | ||
| Shrestha UK28 et al. 2006 | 2006 | Cross-sectional study | 1012 | Seven wards of metropolitan and sub-metropolitan of Nepal | 192/1012 | 107/1012 | |
| Kushwaha A30 et al. 2020 | 2020 | Cross-sectional study | 114 | Community Hospital | 5/114 | ||
| Sharma B16 et al. 2019 | 2019 | Cross-sectional study | 320 | Morang | 55/320 | 38/320 | 57/320 |
| Gyawali B17 et al. 2018 | 2018 | Cross-sectional study | 2310 | Lekhnath municipality | 302/2310 | 271/2310 | |
| Sharma SK18 et al. 2011 | 2011 | Cross-sectional study | 14425 | Eastern Nepal | 889/14008 | ||
| Sharma SK19 et al. 2013 | 2013 | Cross-sectional study | 3218 | Dharan | 242/3218 | ||
| Chhetri MR20 et al. 2009 | 2009 | Cross-sectional study | 1633 | Kathmandu valley | 422/1633 | ||
| Paudyal G21 et al. 2008 | 2008 | Cross-sectional study | 1475 | Mulpani ,Gothar Kathmandu valley | 60/1475 | 34/1475 | |
| Bhandari G22 et al. 2014 | 2014 | Cross-sectional study | 11901 | 31 selected hospital institutions (28 non-speciality and 3 speciality) | 391/11901 | ||
| Karki P23 et al. 2000 | 2000 | Cross-sectional Study | 1,840 | Outpatient clinic of BPKIHS | 116/1840 | ||
| Paudel S24 et al. 2020 | 2020 | Secondary analysis of the data | 1977 | Across Nepal | 179/1977 | ||
| Koirala S25 et al. 2018 | 2018 | Cross-sectional study | 188(85M/103F) | Mustang district | 59/188 | 9/188 | |
| Ranabhat K26 et al. 2016 | 2016 | Cross-sectional study | 154 (80M/74F) | Tribhuwan University Teaching Hospital of Nepal | 66/154 | ||
| Mehta KD27 et al. 2011 | 2011 | Cross-sectional study | 2006(1096M/910F) | Sunsari , Eastern Nepal | 422/2006 | 80/289 |
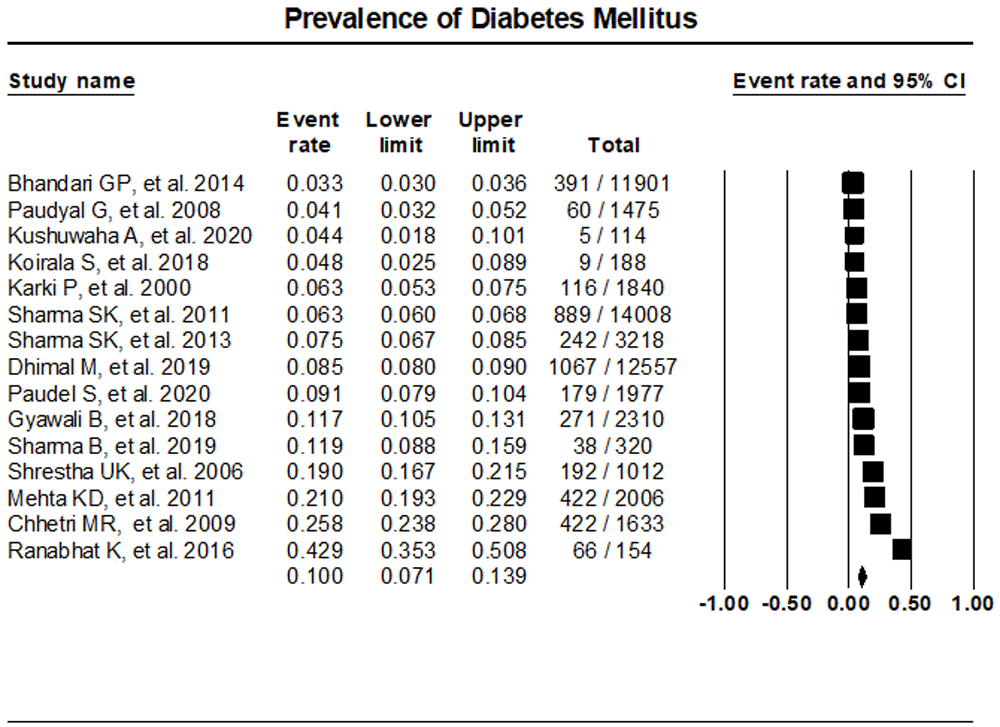
The random effects meta-analysis assessment of 15 studies indicated T2DM prevalence at 10% (95% CI, 7.1%- 13.9%) (Figure 2). Sensitivity analysis was performed with the exclusion of individual studies which resulted in no significant differences in the prevalence of T2DM (Extended data file 2, Figure 110)
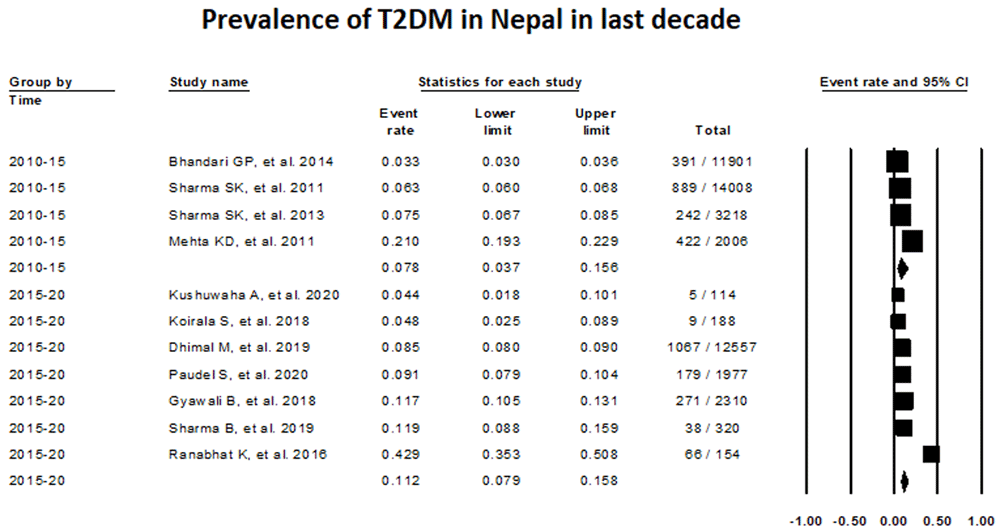
The assessment of T2DM prevalence between 2010–2015 with the use of random-effects meta-analysis was 7.75% (Proportion, 0.0775; 95% CI, 0.0367-0.1561; studies: 4; I2:99.62), while this value increased to 11.24%, between 2015–2020 (Proportion, 0.1124; 95% CI, 0.0789-0.1577; I2: 96.74) (Figure 3).
In relation to the study setting, the re-analysis of the data with the use of the random-effects model showed that 10.4% among surveyed adult population based on community-based studies had T2DM (Proportion, 0.1040; 95% CI, 0.0668-0.1596) (Extended data file 2, Figure 2), while 9.23% among hospital/Directly observed, treatment short-course (DOTS) center-based studies have this disease (Proportion, 0.0923; 95% CI, 0.0509-0.1617) (Extended data file 2, Figure 310).
Pre-diabetes was present in 19.4% (Proportion, 0.194; 95% CI, 11.2%- 31.3%) (Extended data file 2, Figure 4) and IGT in 11.0% (Proportion, 0.110; 95% CI, 4.3%- 25.4%) (Extended data file 2, Figure 510).
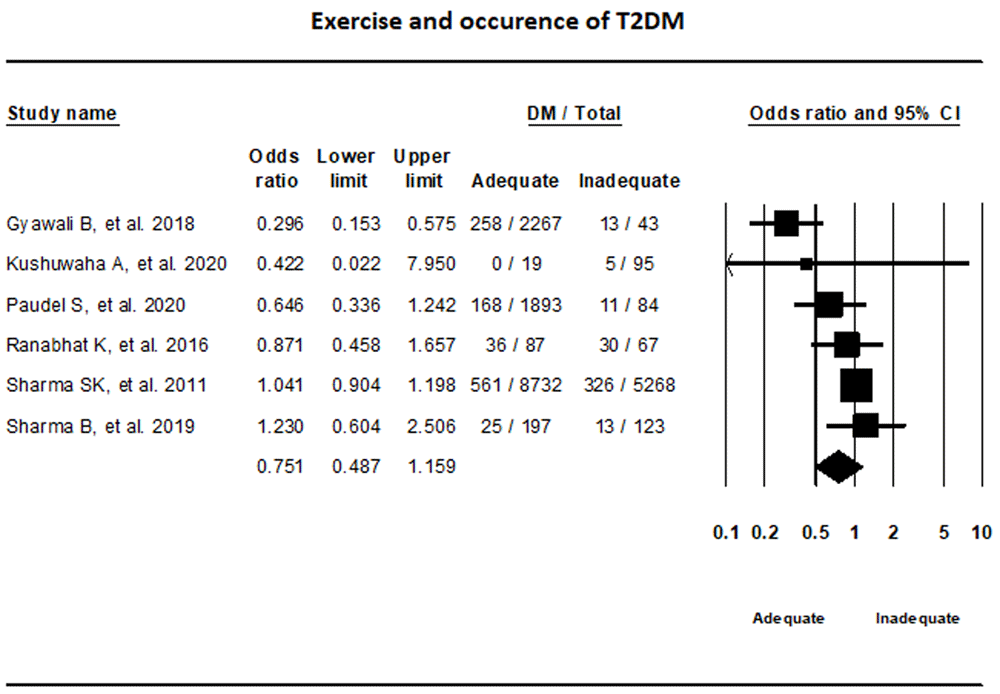
Exercise. Random-effects model that incorporated data from six studies on exercise showed that the difference in T2DM status between adequate and inadequate exercise groups were not statically significant (OR, 0.75, 95% CI, 0.49-1.16; I2, 67.85%) (Figure 4).
BMI. Fixed-effect meta-analysis of five studies that reported on the BMI indicated that with a BMI ≥24.9 kg/m2 the odds of having T2DM is 2.19 times higher than with BMI <24.9 kg/m2 (OR, 2.197; 95% CI, 1.799-2.683) (Figure 5).

Waist circumference. Individuals with healthy waist circumference had 64.1% lower odds of having T2DM compared with those with high waist circumference (OR, 0.361; 95% CI, 0.284-0.460; I2, 0%) (Extended data file 2, Figure 410).
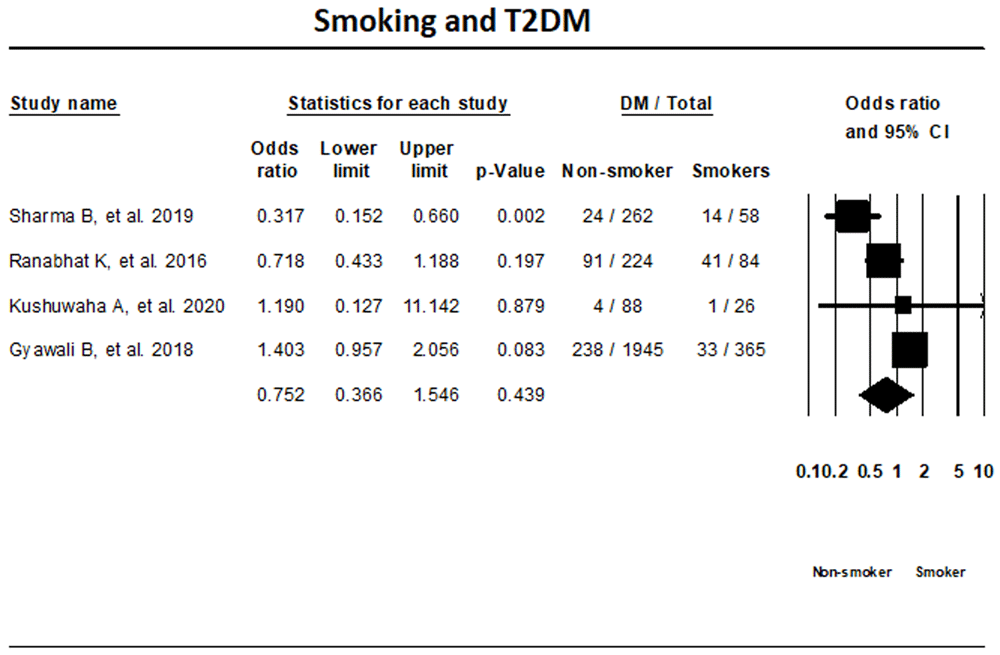
Smoking status. The random-effects meta-analysis of four T2DM studies based on smoking status indicated that the differences in T2DM status among smokers and non-smoker were not significant (OR, 0.752; 95% CI, 0.366-1.546; I2; 87.2%) (Figure 6).
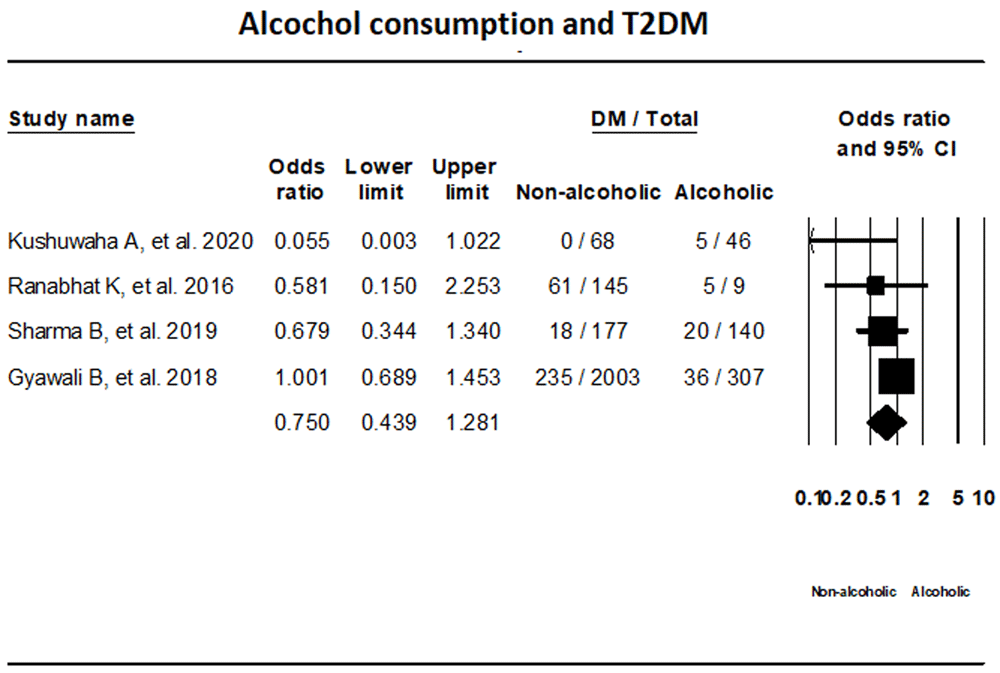
Alcohol consumption. T2DM status in relation with alcohol consumption was assessed by four studies with the use of random-effects model. The results showed that T2DM status among alcoholic and non-alcoholic groups were not statistically significant (OR, 0.750; 95% CI, 0.439-1.281 I2; 37.72%) (Figure 7).
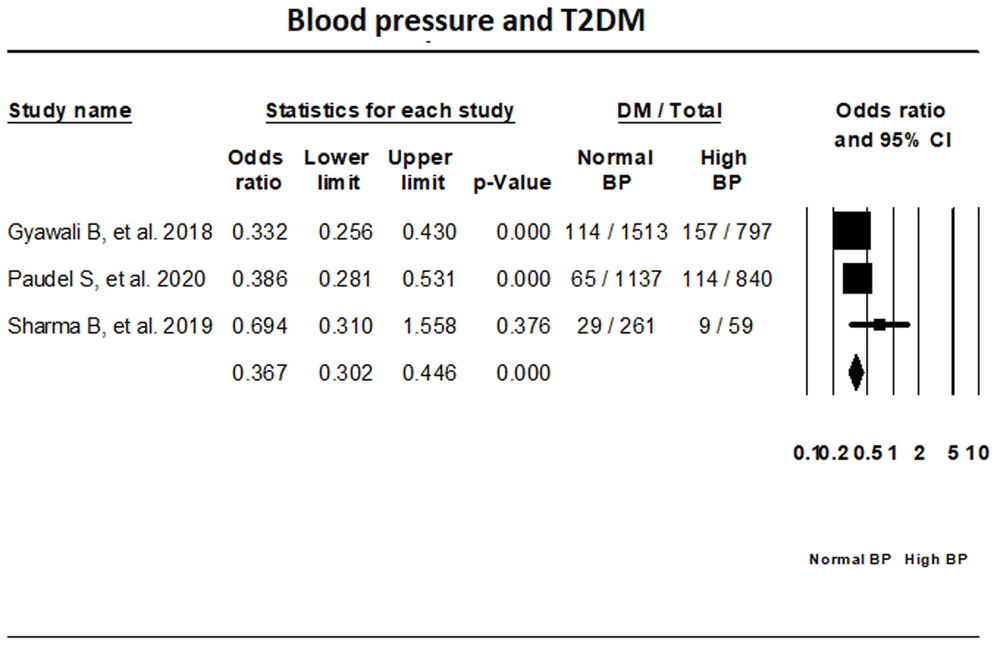
BP. Fixed-effect meta-analysis of three studies that have reported on T2DM status in relation with BP has indicated that the odds of individuals with normal BP having T2DM is 62.1% lower than those with high BP (OR, 0.379; 95% CI, 0.290-0.495) (Figure 8).
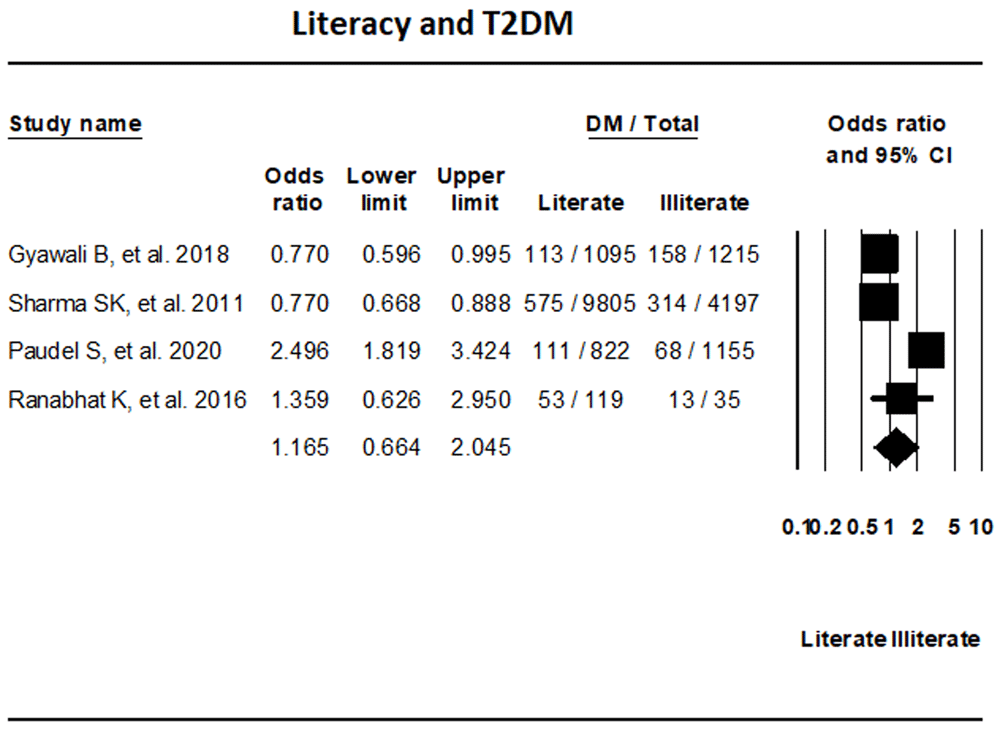
Literacy. The assessment of four studies that reported on T2DM based on literacy status did not show any significant differences in T2DM between literate and illiterate groups (OR, 1.165; 95% CI, 0.664-2.045; I2, 93.61%) (Figure 9).
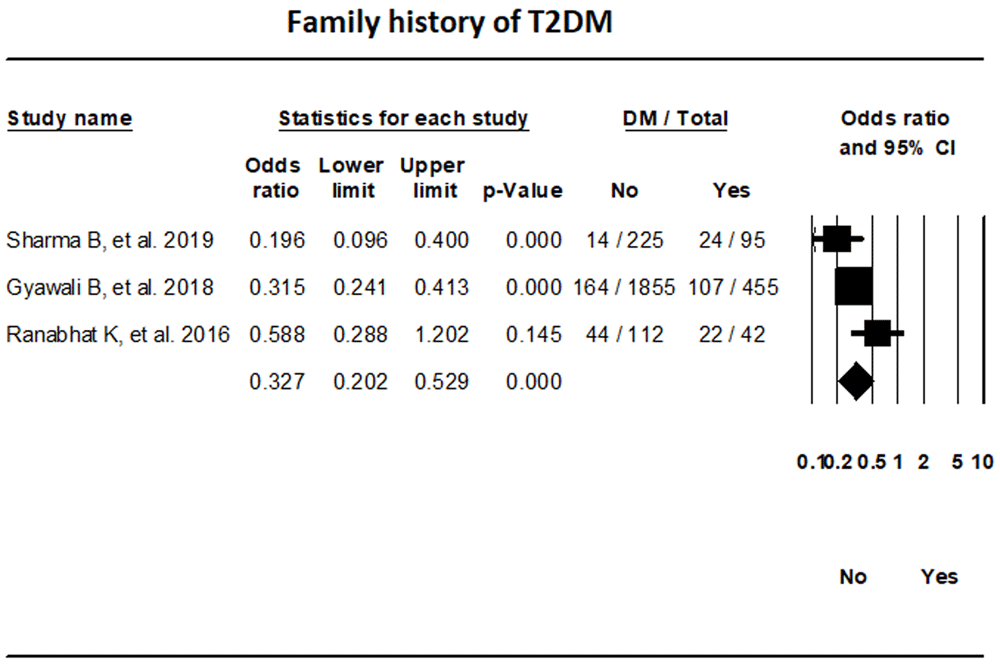
Family history. The random-effects meta-analysis of three studies indicated that the odds of T2DM in individuals without a family history of T2DM were 67.3% lower in comparison to those with a family history (OR, 0.327; 95% CI, 0.202-0.529; I2, 56.62%) (Figure 10).
Fruits and vegetables intake. The data assessment of the two studies that had reported on T2DM status in relation to fruits and vegetable intake did not reach a significant difference (OR, 0.933; 95% CI, 0.441-1.976; I2, 78.72%). (Extended data file 2, Figure 710).
Publication bias. Publication bias among the included studies were tested with the use of Egger’s test and was presented in a Funnel plot. The prevalence of T2DM in the Funnel plot showed an asymmetric distribution of studies, which suggested publication bias (Extended data file 2, Figure 810).
The prevalence of T2DM, pre-diabetes, and IGT in Nepal was found to be 10%, 19.4%, and 11% respectively. Our results show that in Nepal obesity is the highest risk factor for T2DM, while individuals with normal waist circumference and lack of family history of T2DM had lower risk of T2DM.
The estimated prevalence of T2DM was higher than that reported in WHO STEP wise approach to Surveillance (STEPS) survey in 2013 (3.6%), and previous meta-analyses (8.4% and 8.5%)5,6,31. Similarly, the estimated prevalence of pre-diabetes in our study was almost double than what has been reported in other studies5,6. One explanation for this finding can be the rapid urbanization, and migration from rural to urban areas which has promoted a sedentary lifestyle among individuals, along with consumption of unhealthy foods32. As per our study, high BMI was the main cause of T2DM in Nepal. In South Asia, lifestyle factors such as poor diet, and increased sedentary behaviors with limited physical activities have contributed to the rise of overweight and obesity among children and adolescents33. Rapid development of the economic situation in developing countries like Nepal has resulted in a change of diet rich in cereal and vegetables to one with animal products and processed food with high fat and sugar content34. In a study by Hills et al. the prevalence of overweight in Nepal was estimated to be 16.7%, with a higher prevalence in women (19.6%) compared to men (13.6%)34. Obesity is closely linked with premature onset of T2DM and cardiovascular disease35. A similar increasing trend of T2DM led by obesity is seen in Africa as well36. It is important to target T2DM risk factors in order to take control of this disease in Nepal. Physicians advise for special diet and regular exercise for diabetic patients, however, there are noncompliance has been observed in Nepalese population37. Our findings highlight the importance of exercise and a healthy diet to prevent the increased morbidity among individuals with T2DM in this country. Shrestha et al. found that the T2DM awareness to be low, with nearly half of the population unaware of the fact that they had this disease6. Increasing public awareness about non-communicable diseases like T2DM and hypertension, and the need to implement a healthy lifestyle is of paramount importance given that our results indicated that individuals with normal blood pressure had less chance of developing T2DM compared to those with hypertension. Increased intake of oily foods, reusing cooking oils which can cause increased conversion of unsaturated fats to trans fats, and low consumption of fruits and vegetables have been found throughout South Asia38,39. These unhealthy dietary habits lead to increased risks of non-communicable diseases like T2DM and hypertension. Thus, interventions are needed to better manage the overweight and obesity epidemic. This can be achieved through various measures such as opening public parks in the cities for exercise, educating the population about what a healthy lifestyle entails such as decreasing the intake of oily foods, increasing the intake of fruits and vegetable, as well as improving the quality of food. Our study has several strengths. Firstly, we performed comprehensive literature search to pool the results of fifteen studies over the last twenty years to evaluate the prevalence of T2DM in Nepal. In addition, no prior meta-analysis has evaluated the risk factors for T2DM, specifically IGT in Nepal, prior to our study. We also analyzed data based on a time frame, where significant increase in T2DM prevalence was observed in Nepal when comparing 2010–2015 with 2015–2020. Our study had some limitations. There was heterogeneity in the studies due to variation in the T2DM diagnostic criteria, different demographics of the population, etc. Most of the included studies were based on specific areas such as province 1 and 3, and not enough studies have been done on a national scale. Finally, risk factors for T2DM were not reported in all the studies that were included.
The prevalence of T2DM, pre-diabetes and IGT in Nepal was estimated to be 10%, 19.4% and 11% respectively. Obesity is the major risk factor of T2DM in Nepal and people with normal waist circumference, normal blood pressure and lack of family history of T2DM had lower odds of developing this disease.
Figshare: Diabetes Mellitus in Nepal from 2000 to 2020: A systematic review and meta-analysis
https://doi.org/10.6084/m9.figshare.14706648.v112
The project contains the following underlying data:
Dataset: Quantitative data, glycemic control, socio-economic status, BMI, exercise, T2DM prevalence, waist circumference, family history, fruit and vegetable serving per day, alcohol consumption, smoking, education, and BP)
Figshare: Diabetes Mellitus in Nepal from 2000 to 2020: A systematic review and meta-analysis
https://doi.org/10.6084/m9.figshare.14854065.v110
The project contains the following underlying data:
Data are available under the terms of the Creative Commons Zero "No rights reserved" data waiver (CC0 1.0 Public domain dedication).
DBS, PB, and YRS contributed to the concept and design, analysis, and interpretation of data. DBS, PB, AM, SL, SN, AA, and AP contributed to the literature search, data extraction, review, and initial manuscript drafting. YRS, SN, and AA interpretation of data, revising the manuscript for important intellectual content, and approval of the final manuscript.
All authors were involved in drafting and revising the manuscript and approved the final version.
| Views | Downloads | |
|---|---|---|
| F1000Research | - | - |
|
PubMed Central
Data from PMC are received and updated monthly.
|
- | - |
Provide sufficient details of any financial or non-financial competing interests to enable users to assess whether your comments might lead a reasonable person to question your impartiality. Consider the following examples, but note that this is not an exhaustive list:
Sign up for content alerts and receive a weekly or monthly email with all newly published articles
Already registered? Sign in
The email address should be the one you originally registered with F1000.
You registered with F1000 via Google, so we cannot reset your password.
To sign in, please click here.
If you still need help with your Google account password, please click here.
You registered with F1000 via Facebook, so we cannot reset your password.
To sign in, please click here.
If you still need help with your Facebook account password, please click here.
If your email address is registered with us, we will email you instructions to reset your password.
If you think you should have received this email but it has not arrived, please check your spam filters and/or contact for further assistance.
Comments on this article Comments (0)