Keywords
COVID-19, pipeline vandalism, restriction on movement, NNPC pipelines, pipes
This article is included in the Sociology of Health gateway.
This article is included in the Coronavirus (COVID-19) collection.
COVID-19, pipeline vandalism, restriction on movement, NNPC pipelines, pipes
Product theft and vandalism of national pipelines are recurring challenges faced by the Nigeria National Petroleum Corporation (NNPC).1,2 During the COVID-19 pandemic, movements were restricted. It is desirable to determine if a significant difference exists in the incidence of pipeline vandalism of Nigerian oil pipelines during the COVID-19 pandemic. This dataset provides that information.
Incidences of vandalism of pipeline are ascribed in the Monthly Financial and Operations Reports (MFOR) of the Nigeria National Petroleum Corporation (NNPC).5 In this research, data from the NNPC MFOR from January 2015 to January 2021 were used. These monthly reports are available for free download by the public from the NNPC website link (NNPC; https://www.nnpcgroup.com).3 The information abstracted from the NNPC MFOR were number of cases of pipeline vandalism per month, month of vandalism, and year of vandalism.
The data were grouped into four groups, namely:
1. Historical data –1st January 2015 to 31st July 2019.
2. Prior COVID-19 data – 1st August 2019 to 31st January 2020.
3. COVID-19 data – 1st February 2020 to 31st July 2020.
4. Post COVID-19 data – 1st August 2020 to 31st January 2021.
Furthermore, we obtained information and dates of major events that may be considered possible external stimuli in this analysis. This information was collected from national and regional newspapers and web-based publications, and web pages.
These are:
• May 2016, incorporation and deployment of sophisticated weapons, use of satellite images and geographical information system (GIS) into the security apparatus to ensure vandalism is contained, the setting up of a pipeline security force to stamp out the menace, and the formation of the Trans-National Organized Crime (TNOC) with regional allies to fight against the proliferation of Small Arms and Light Weapons.4 This was a welcome development as the area under physical patrol were massive.
• The onset of COVID-19 in December 2019 and the declaration of COVID-19, on 30th January 2020, as a Public Health Emergency of International Concern by WHO (World Health Organization), and the upgrade to a pandemic by the 11th of March 2020.
• In Nigeria, the pre-lockdown commenced from 28th February – 29th March, 2020, and was 31 days in duration. The lockdown, in total 35 days; was from 30th March to 3rd May, 2020, and’easing up’ of 73 days, 5th May – 15th July, 2020.
This information was mainly used in the interpretation of the plot of monthly cases of pipeline vandalism vs. time in month/year (Figure 1).
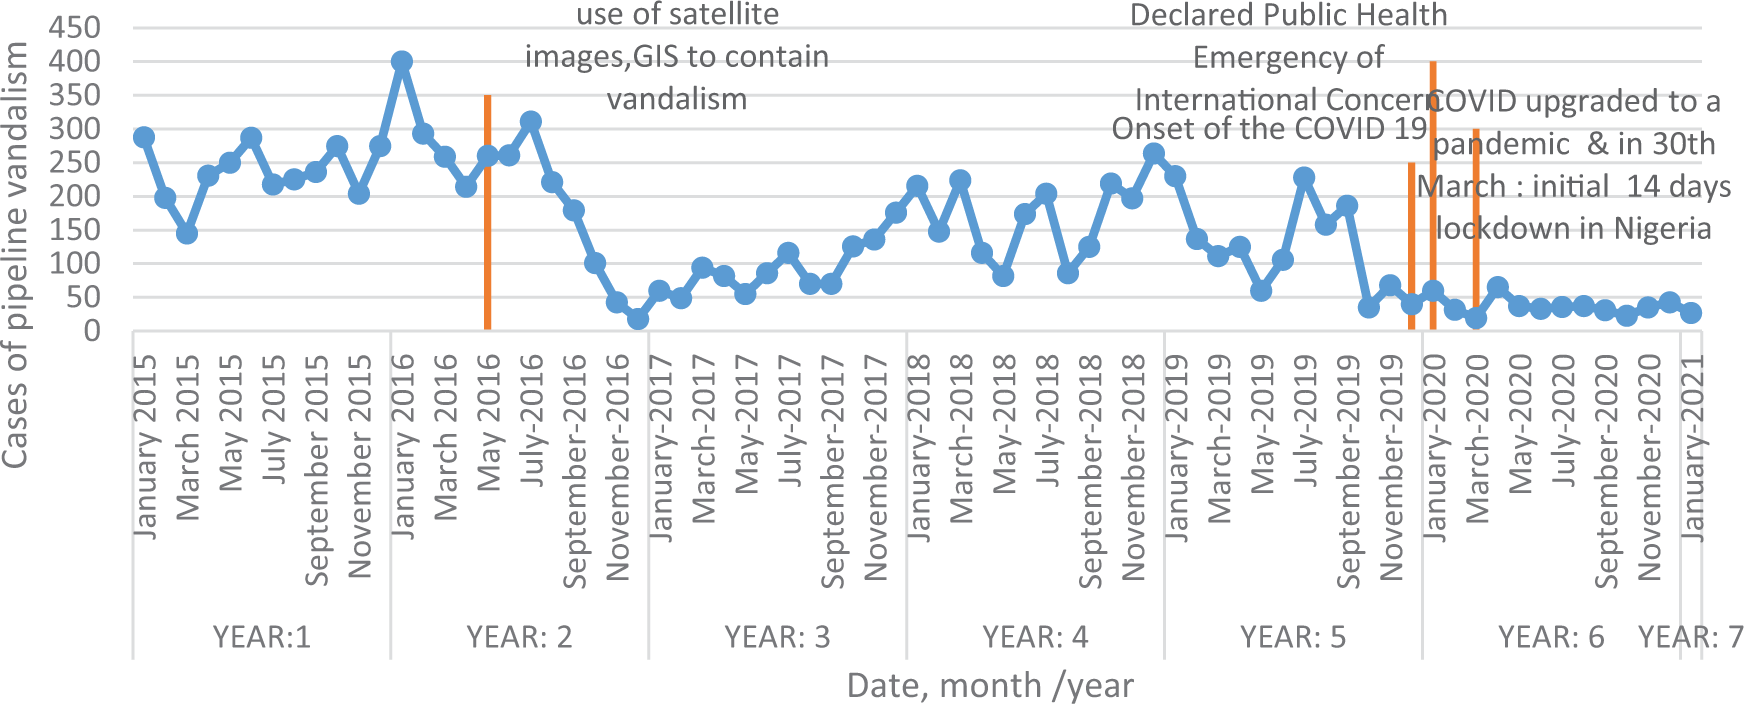
The May 2016 event (from a cursory glance of Figure 1) had a great impact on cases of pipeline vandalism. Thus, the historical data were further divided into four sub-groups to capture the possible influence of the deployment in May 2016 by the Nigerian government on pipeline vandalism.4
The four sub-groups of the historical data are:
1. Sub-group A (one-year before deployment; 1st May 2015-30th April 2016),
2. Sub-group B (year of deployment; 1st May 2016-30th April 2017),
3. Sub-group C (one-year after deployment; 1st May 2017-30th April 2018),
4. And sub-group D (two-years after deployment; 1st May 2018-30th April 2019).
Prior to the deployment, the pipeline security method involved the active patrol in pipeline installation by security agents using patrol vehicles. Another method adopted by past administration was the involvement of local militia leaders in delicate but dangerous and remote locations. Subsequent to the deployment a combination of the active patrol of pipeline installation by security agents and GIS are used; in addition to a reversal of the policy on the use of local militia.4
The MS office Excel 2013 with the Analysis ToolPak add-in were used. In all statistical analysis in this project, an alpha = 0.05 as the significance threshold was set, and a null and an alternative hypothesis were established. This means that the null hypothesis would be rejected if the p-value is less than or equal to 0.05 and the alternative hypothesis would be accepted.
• Null hypothesis: There is no significant difference between the mean case of pipeline vandalism incidences prior, during, and post COVID lockdown.
• Alternative hypothesis: There is a significant difference between the mean case of pipeline vandalism incidences prior, during, and post COVID-19.
For the group data, the total incidences during the time frame covered by the group, average, and standard deviation were established. The grouped data were subjected to an ANOVA analysis, and a time series analysis was undertaken after the data were smoothed using a moving average.
For the sub-groups, the total cases in each subgroup, the mean, and the standard deviation were calculated. A null and an alternative hypothesis were set.
• Null hypothesis: There is no significant difference between the mean case of pipeline vandalism incidences prior, during, and post the deployment.
• Alternative hypothesis: There is a significant difference between the mean case of pipeline vandalism incidences prior, during, and post the deployment.
The sub-grouped data were also subjected to an ANOVA analysis, and a time series analysis (after the data were smoothened by moving average).
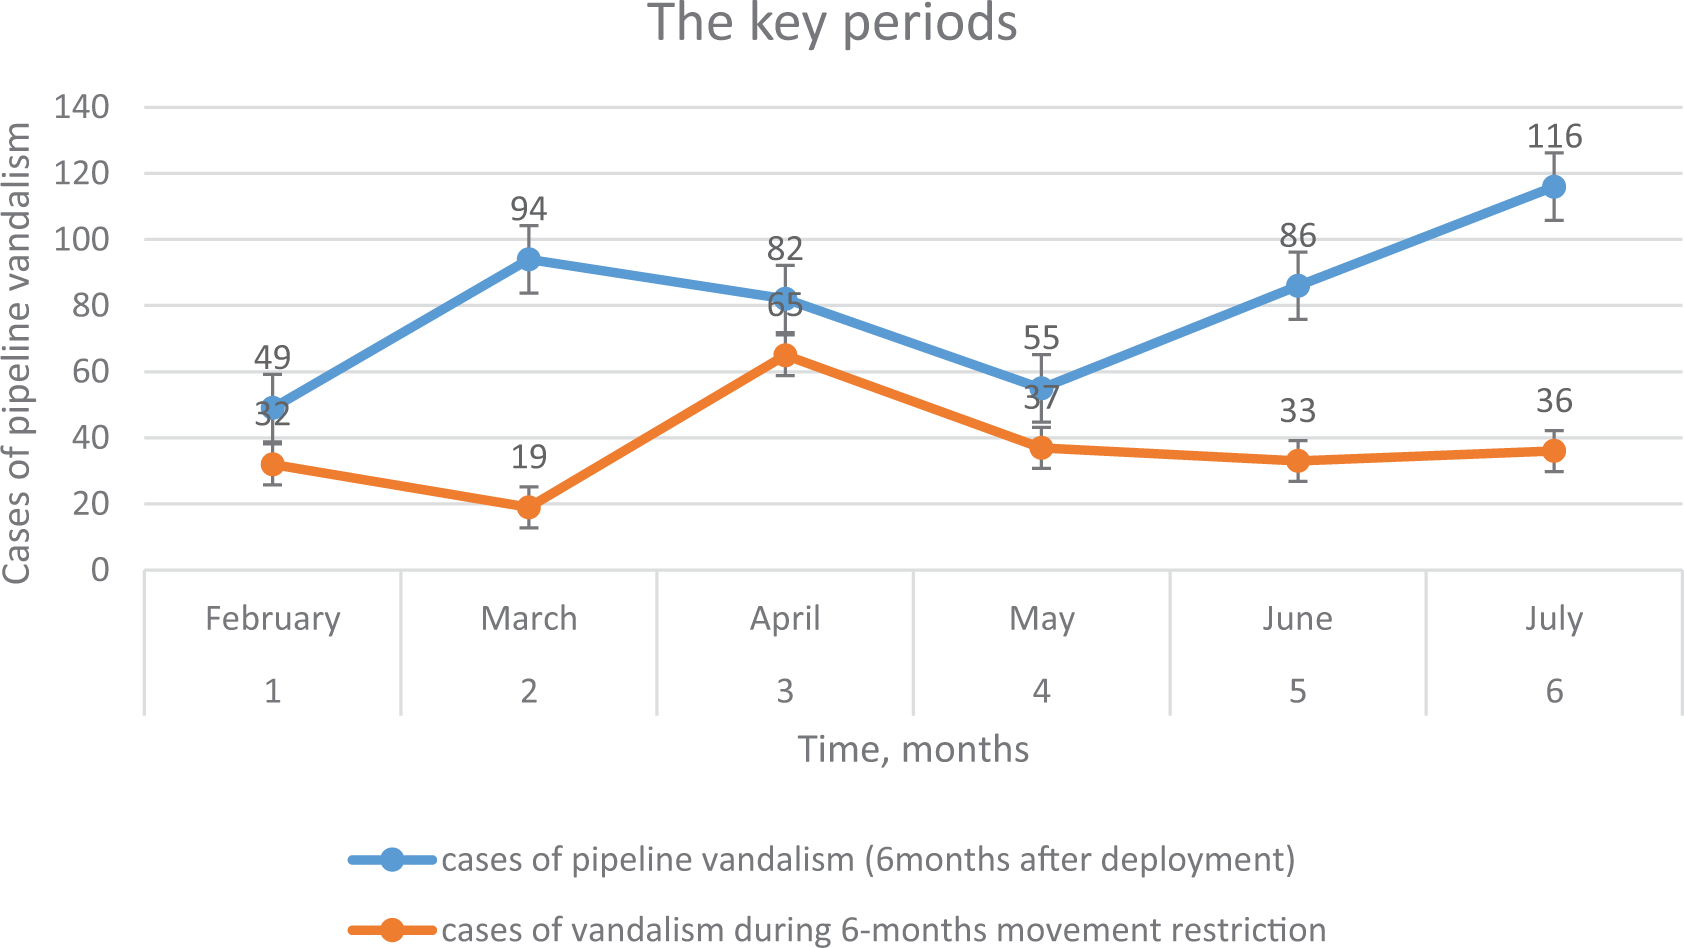
Third, it was observed that fewer cases of vandalism occurred in the historical sub-group B than in any other subgroup with major improvements six months after the deployment in May 2016. The six-month lag may be the “learning/training and implementation phase” after the media announcements and deployment. In the COVID-19 pandemics groups, the lockdown period presented fewer cases of pipeline vandalism. It was noted that periods of renovations of the methodologies used to checkmate the activities of vandals and uncompromising movement restrictions favoured a reduction in cases of pipeline vandalism. From a security viewpoint, it was therefore desirous to determine if greater success would be attributed to the use of either of the two methods (Figure 2). This would enable the government to design a more winning approach to vandalism.
Seasonal confounds
There are two principal seasons, the wet rainy season and the hot dry season in Nigeria. Pipeline vandalism takes place in remote locations on isolated, rural roads and footpaths; not readily accessible during adverse weather conditions. We, therefore, assume that the rainfall affects the number of cases of pipeline vandalism. However, rainfall patterns are fairly predictable and torrential rainfall occurs in the mid of the rainy seasons. Seasonal confounds were eliminated by comparing data for the same months in each group. This implies that the rainfall season data (in one group) were compared only with the rainfall season data (in another group); with similar arguments for the dry season data.
Data points in each group or sub-group
For all analysis, the number of data points was of uniform length to reduce any possible bias due to unparalleled data points.
In each COVID-19 group (prior, during, and post COVID-19 lockdown groups) the number of data points were six. In the four sub-groups of the historical data (i.e., sub-group A, sub-group B, sub-group C, and sub-group D) each sub-group had 12 data points.
The data was assembled over an even interval and ordered chronologically with equal time frequency.
Exclusion of data
All cases/incidences of vandalism of pipelines that fall before or after the time frame under review (1st January, 2015 to 31st January, 2021) as ascribed in the MFOR were removed from the analysis.
Other assumptions made
The destruction of these pipelines has been a scourge on the national petroleum industry in Nigeria since time immemorial,1 two groups of people disrupt pipelines in Nigeria namely; activists, radicals, and militants, to make political statements, and thieves with the sole purpose to gain illegal possession of the fluids.
The former, makes political statements before any attempted disruptions, often to inform the government and allow negotiation for the fulfillment of their demands; the latter do not. During the lockdown, no activists, radicals, and militants made any political statement; so, we can assume they also heeded the order to isolate and social distance. We therefore attributed all pipeline vandalism during the COVID-19 lockdown period to thieves.
Our dataset shows the monthly cases of pipeline vandalism from 2015 to 2021.5 It shows the variations in cases before and after the use of GIS for monitoring. It also revealed the changes in pre-COVID-19, post-COVID-19, and during the pandemic.
This dataset ensures the easy availability of this information for the general public.
Harvard Dataverse. Effects of COVID-19 on pipeline vandalism in Nigeria, West Africa. DOI: https://doi.org/10.7910/DVN/8X5KKB.5
This project contains the following underlying data:
Dataset Data for: Effects of COVID-19 on pipeline vandalism ingested files:
• Original data.tab. (Contains the unfiltered data from the NNPC reports, with cases of pipeline vandalism tabulated by month and year.).
• ANOVA-Historical subgroups.tab. (Two sheets. One; (MasterDataSheet) contains the original data divided into the four groups and a second (Historical sub-groups) preliminary analyses on the sub-groups).
• ANOVA-COVID-19 groups.tab. (ANOVA analysis of COVID-19 group (prior, during, and post COVID-19 lockdown groups)).
• Graph-subgrpB-and-6-months lockdown.tab. (Comparative analysis of key periods – 1st February-30st July 2017 and 1st February-30st July 2020).
• Time series analysis -COVID-19 groups.tab. (Time series analysis of COVID-19 group (prior, during, and post COVID-19 lockdown groups) smoothening with moving average).
• Time series analysis-Historical subgroups.tab. (Time series analysis of historical subgroups with smoothening by moving average).
Data are available under the terms of the Creative Commons Zero “No rights reserved” data waiver (CC0 1.0 Public domain dedication).
| Views | Downloads | |
|---|---|---|
| F1000Research | - | - |
|
PubMed Central
Data from PMC are received and updated monthly.
|
- | - |
Provide sufficient details of any financial or non-financial competing interests to enable users to assess whether your comments might lead a reasonable person to question your impartiality. Consider the following examples, but note that this is not an exhaustive list:
Sign up for content alerts and receive a weekly or monthly email with all newly published articles
Already registered? Sign in
The email address should be the one you originally registered with F1000.
You registered with F1000 via Google, so we cannot reset your password.
To sign in, please click here.
If you still need help with your Google account password, please click here.
You registered with F1000 via Facebook, so we cannot reset your password.
To sign in, please click here.
If you still need help with your Facebook account password, please click here.
If your email address is registered with us, we will email you instructions to reset your password.
If you think you should have received this email but it has not arrived, please check your spam filters and/or contact for further assistance.
Comments on this article Comments (0)