Keywords
CTCF, Trak1, Gabpa, Gabpb1, Gabpb2, Gfi1, Gfi1b, neurogenesis, lymphogenesis
CTCF, Trak1, Gabpa, Gabpb1, Gabpb2, Gfi1, Gfi1b, neurogenesis, lymphogenesis
CTCF: CCCTC-binding factor
ChIP-Seq: Chromatin immunoprecipitation coupled with deep sequencing
GEO: Gene Expression Omnibus
UCSC: University of California Santa Cruz
Diversity is critical to lymphocyte roles in the immune system as well as to neurons, which form complex network structures in the brain (Morimoto and Nakajima, 2019). Emerging evidence suggests that an increasing number of molecules that are typically associated with the immune system are also expressed in various central nervous system (CNS) regions and play crucial roles in brain development (Morimoto and Nakajima, 2019). Examination of shared molecular mechanisms underlying neurogenesis and lymphocyte differentiation may give rise to a clearer definition of relevant pathways, and suggests additional biomarkers in lymphocytes for neurological disorders. These results can contribute to find biomarkers that can be monitored through patient lymphocyte populations.
In this study, we analysed similarities and conserved regions in several genes regulated by CCCTC-binding factor (CTCF) during lymphocyte and neuronal developmental stages. Genes of interest fell into two categories: a role in mitochondrial biology (Trak1, Gabpa, Gabpb1 and Gabpb2) or differentiation factors (Gfi1, Gfib).
CTCF is a ubiquitously expressed zinc finger protein best known for its function in transcriptional insulation (Phillips and Corces, 2009). CTCF binds to insulator regions and physically blocks enhancer-promoter interactions (Holwerda and de Laat, 2013). Thus, it can be involved in either activation or repression of gene expression. Together with cohesin, CTCF is responsible for the regulation of higher order chromatin structure, allowing and/or blocking transcriptional machinery, gene rearrangements and enhancer-promoter activity (Lee and Iyer, 2012). CTCF is well known for its function in epigenetic regulation during lymphocyte differentiation (Gunal Sadik et al., 2014), but has also been shown to play a role in the regulation of proliferation-differentiation equilibrium of neuroprogenitor cells during cortex formation (Watson et al., 2014). As a result, examining the role of CTCF in regulating expression of specific genes in differentiation of neurons and lymphocytes may be informative.
Recent studies revealed that the co-localization of cohesin and CTCF at the variable IgH segments affects the usage of V gene segments during V(D) J recombination in pre-B cells. Cohesin and CTCF both facilitate long-range interactions between the V genes, the Eμ enhancer and some 3’ cohesin/CTCF binding sites (Gunal Sadik et al., 2014; Guo et al., 2011; Seitan et al., 2012). CTCF is a key molecule playing critical roles in conformational changes in chromatin that determine cellular differentiation. It was found that significant changes in 390 transcripts of cortex and hippocampus occurred in CTCF knock-out mice (Hirayama et al., 2012). To further investigate the potential role of CTCF in neuronal development, we analysed shared CTCF binding sites on several critical genes for neuronal and lymphocyte development using publicly available genomic data. We determined common as well as non-shared CTCF binding sites on these genes through developmental stages of neurons and lymphocytes. We also analysed changes in expression levels of these genes in neurons and lymphocytes and determined their sequence conservancy via phylogenetic analysis.
During brain development, changing local energy needs should be met during differentiation; thus, mitochondrial transport is critical for brain development (Ogawa et al., 2013). These energy needs are fulfilled by mitochondria which facilitate ATP synthesis. Proper differentiation of cells depends on availability of required energy at times of necessity. In cells like neurons that show high levels of polarization, axonal transport mechanisms are dependent on proper mitochondrial function. One protein implicated in the transport of mitochondria in axons is Trak1, which is thought to play a critical role in the long-distance trafficking of mitochondria in axons (Melkov and Abdu, 2018; Ogawa et al., 2013). However, Trak1 is also expressed in lymphocytes, where distances traveled are shorter and the degree of polarization is lower. Can we gain insight into shared Trak1 functions between neurons and lymphocytes by looking at its expression during differentiation of neurons and lymphocyte lineages?
Another transcription factor implicated in mitochondrial function is the GA binding protein (GABP) transcription factor, which is involved in mitochondrial biogenesis and expression of mitochondrial genes needed for ATP production (Yang et al., 2014). This transcription factor binds to DNA sequences that are rich in the nucleotides guanine and adenine, and is composed of two subunits; GABPα and GABPβ. GABPα comprises an ETS domain that binds to DNA. GABPβ also contains four ankyrin repeats that mediate protein-protein interactions. GABPα/GABPβ dimer contains a nuclear localisation signal for nuclear import. GABP regulates Pax5 gene expression and plays role in B cell differentiation (Jing et al., 2008), but little is known about its role in neuronal development.
Growth factor independence-1 (Gfi1), is a transcription factor which is involved in both neuronal and hematopoietic cell development. The deletion of Gfi1 in mice gives rise to defects in sensory neurons and developmental disorders in neuroendocrine cells and causes defective hematopoietic stem cells and neutrophil deficiency. Gfi1 mediates distinct stages of lymphocyte development due to its transcriptional repressor function, and is critical for early development of T lymphocytes (Kazanjian et al., 2006). The role of Gfi1 in neuronal development is less well defined, but neurodegeneration due to mutations in Ataxin-1 (SpinoCerebellar Ataxia type 1, SCA1) is thought to be mediated by interaction with Gfi1,and the loss of Gfi1 mimics the SCA1 phenotype (Tsuda et al., 2005).
Gfi1b is 97% homologous to Gfi1. Gfi1b is fundamental for megakaryocytic and erythroid development (van der Meer et al., 2010). Both are expressed in T-cell precursors as well (Kazanjian et al., 2006). Gfi1 is a target for p53, and the regulation of hematopoietic stem cells via Gfi1 is mediated by p53. It is also involved in B cell differentaion, as Gfi1 expression decreases in mature B cells (van der Meer et al., 2010). Gfi1b is more widely expressed in adults that Gfi1, but little is known about Gfi1b function in neurons, and the deletion of Gif1b in embryos is lethal (Wallis et al., 2003). However, members of this family play an important role in neuronal development and maintenance. For example, the Senseless gene in Drosophila melanogaster and Pag3 in Caenorhabditis elegans are orthologous to Gfi1. Senseless and Pag3 are critical for neuronal development and sensory organ specification. Deletion of Gfi1 causes deficiency in inner ear hair cells in mice, giving rise to hearing loss as well as reduced numbers of cochlear neurons. Gfi1 also is expressed in cells of the peripheral nervous system, as well as inner ear hair cells, the eye, and rare pulmonary neuroendocrine cells (Kazanjian et al., 2006).
To fully understand how differential expression of genes that direct development of both lymphocytes and neuronal cells can produce very different cell types, the mechanisms of functionally relevant regulatory genes should be analysed. Evaluating shared and lineage-specific mechanisms may shed light on common and cell type-specific control mechanisms in these distinct cell types. Genes that are controlled by shared regulatory mechanisms in different cell types might be major determinants of differentiation.
Publicly available CTCF ChIP-seq data files were downloaded from the Gene Expression Omnibus (GEO) online database as bed or bigwig files. Data was retrieved in University of California Santa Cruz (UCSC) Genome Browser as custom tracks. Visualisation of ChIP-seq peaks was performed using USCS Genome Browser. GEO accession numbers of each data set are given in Table 1. UCSC gene references are used for gene annotations. Sequences of genes under investigation were annotated according to UCSC gene references. Data is analysed according to Mus musculus mm9 assembly.
Phylogenetic trees for genes were extracted from the Ensembl database by using the Gene Tree option under the Comparative Genomics section (Herrero et al., 2016). Mus musculus gene IDs were given as query to create gene trees. Tree branches were collapsed at genus taxonomic rank and visualised accordingly. Gene Tree IDs are given in Table 2 for genes under investigation.
| Gene | Gene Tree ID | Accession URL |
|---|---|---|
| Trak1 | ENSGT00940000155697 | https://identifiers.org/ensembl:ENSGT00940000155697 |
| Gabpa | ENSGT00940000155799 | https://identifiers.org/ensembl:ENSGT00940000155799 |
| Gabpb1 | ENSGT00940000157875 | https://identifiers.org/ensembl:ENSGT00940000157875 |
| Gabpb2 | ENSGT00940000156794 | https://identifiers.org/ensembl:ENSGT00940000156794 |
| Gfi1 | ENSGT00940000156166 | https://identifiers.org/ensembl:ENSGT00940000156166 |
| Gfi1b | ENSGT00940000160010 | https://identifiers.org/ensembl:ENSGT00940000160010 |
Phylogenetic gene trees depicting conserved domains for each gene were generated online using the Phylomedb pipeline (Huerta-Cepas et al., 2014). The Mus musculus reference metaphylome model is chosen to visualise the mouse gene as seed.
Gene expression values were retrieved from the murine gene atlas data set, GNF Mouse GeneAtlas V3, with GEO Accession number GSE10246 (Su et al., 2004). The GEO2R tool under NCBI GEO website was used to visualise gene expression levels of selected genes expressed in two groups of samples: lymphocytes and neurons. GEO accession numbers are given in Table 3. Gene expression profile graphs were generated by submitting the identifier ID for each gene from the ID column of the Platform record.
In this study, we performed epigenetic analysis of CTCF binding Trak1, Gabpa, Gabpb1, Gabpb2, Gfi1, Gfi1b gene loci at T and B lymphocytes at different developmental stages, as well as in neural progenitor cells and motor neurons. Genes of interest fell into two categories: a role in mitochondrial biology (Trak1, Gabpa, Gabpb1 and Gabpb2) or differentiation factors (Gfi1, Gfib). Mitochondria play critical roles in both neuronal and lymphocytic lineages, but play different roles in the two lineages. Similarly, neuronal and lymphocytic lineages undergo multistep differentiation events leading to functionally diverse cell populations. Both lineages are affected by CTCF binding to genes that play a role in differentiation, so comparison of regulatory events in representative genes may begin to elucidate shared and distinct pathways.
We compared expression levels of these genes in the brain and lymphocyte populations using publicly available data and correlated these results with differential CTCF binding. Finally, phylogenetic analysis was performed for genes under investigation to identify highly conserved motifs. In these analyses, we observed common CTCF binding events as well as differential binding of CTCF in various cell types at different stages. When differential binding events were compared to gene expression levels, expression levels correlated with selective binding or non-binding of CTCF at these genes. Genes under investigation in this study play critical roles in the development of both lymphocytes and neurons. Significantly, some genes epigenetically regulated by CTCF exhibited similar control mechanisms during differentiation of neurons and lymphocytes, but these analyses also revealed the use of lineage-specific binding domains.
Trak1 is implicated in mitochondrial trafficking, which would be expected to be more important in neurons than lymphocytes. There were 17 CTCF binding sites at Trak1 gene loci and all 17 were occupied in DP T lymphocytes, whereas only 13 binding sites were observed at DN thymocytes which represent the prior stage of T cell differentiation (Figure 1). Therefore, CTCF plays a role in regulating T cell differentiation at this stage of differentiation. Elevated binding of CTCF at Trak1 gene from double negative (DN) stage to double positive (DP) stage might suggest Trak1 plays an important role in DP T cell differentiation. Given that the Trak1 gene was not expressed in thymocytes and T cells, Trak1 gene expression appears to be suppressed in T cells. This absence of Trak1, which is thought to regulate mitochondrial trafficking, suggests that polarization and localization of mitochondria might not be critical in thymocyte selection.
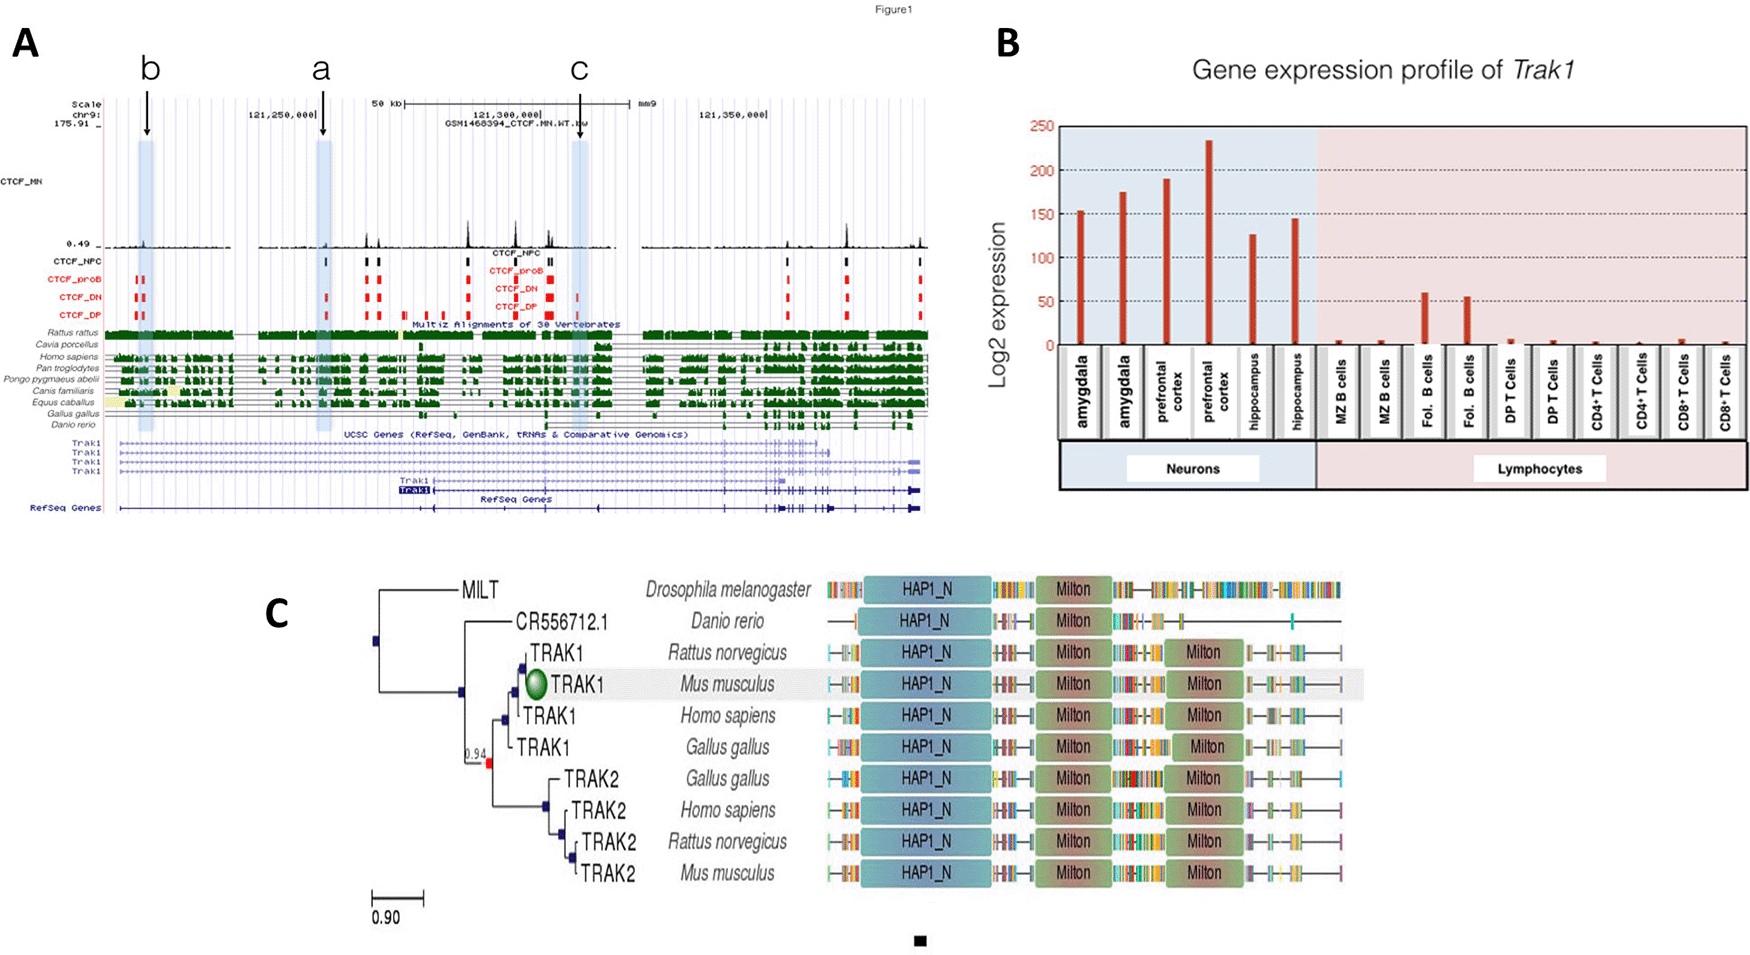
A: Gene conservation and CTCF binding profile at Trak1 locus, B: Trak1 gene expression in neurons and lymphocytes, C: Trak1 gene phlogeny depicting conserved domains.
There were 10 different CTCF binding events at Trak1 gene in proB cells. All of these events were shared among DP and DN T cells. Although the binding profile differed between DP and DN T cells, those 10 shared binding events in proB and T cells suggest tight control of Trak1 gene expression during both B and T lymphocyte differentiation (Figure 1). However, there was a difference in gene expression profiles, which reveals that Trak1 is expressed in follicular B cells but not in T cells. Those CTCF binding sites that were occupied in T cells, but not in B cells, are likely to be important for the suppression of Trak1 gene expression in T cells and suggest that polarization and localization of mitochondria is critical for B cell differentiation. As sites ‘a’ and ‘c’ in Figure 1 were occupied in DN and DP T cells, but not in B cells, this suggests that they are permissive for expression in the B cell lineage. CTCF contributes to lymphocyte differentiation, specifically V(D) J recombination, which ensures lymphocyte variability (Seitan et al., 2012). Therefore, the presence of several sites with differential binding of CTCF in the Trak1 gene suggests that transcriptional regulation of this gene might be of importance in lymphocyte differentiation, with a suppression in T cell lineage which is absent in the B cell lineage.
Unlike the T cell lineage, Trak1 expression is critical for neuronal development. The Trak1 gene was expressed at high levels in amygdala, hippocampus and prefrontal cortex, which is consistent with a requirement for regulation of mitochondrial trafficking. Whereas nine of the CTCF sites in the Trak1 gene were shared for all cell types under investigation, the gene was expressed only in neurons and in B cells, with the highest levels in the brain. Only site c in Figure 1 was specific to DN and DP T cells, and absent in B cells, neural progenitor cells and motor neurons that express Trak1. Although there were 17 potential binding sites for CTCF in the Trak1 gene, binding at site c was the primary site for the regulation of expression by CTCF. A lack of binding of CTCF at site c is necessary for expression, but binding of CTCF at site a may increase Trak1 expression in cells without CTCF at site c. In contrast, there was differential binding at sites a and b in Figure 1 in lymphocytes and neural progenitor cells. Binding was seen at site a for neural and T cell lineages, but not in B cells. In contrast, both B and T cells as well as mature motor neurons exhibited binding at site b, but there was no signal at site b in neuronal progenitors. Due to limitations of publicly available data, gene expression levels were only investigated in mature neurons in this study. Common and shared CTCF binding events on the Trak1 gene suggest further transcriptional regulatory factors controlling Trak1 gene expression levels that differ in neurons and lymphocytes. Identification of factors that bind at site c in neurons, neural progenitors and B cells, may reveal additional differentiation factors for Trak1.
This conclusion is reinforced by the phylogenetic analysis. When we analyzed CTCF binding sequences at sites a, b and c of the Trak1 gene locus across species, we observed that site c is the most highly conserved sequence across species including Rattus rattus (Black rats), Homo sapiens (Humans), Pan troglodytes (Chimpanzees), Pongo pygmaeus abelii (Orangutans), Canis familiaris (Dogs) and Equus caballus (Horses). Sites a and b were also conserved, but conservation of site c as more prominent. This well-conserved site had specific CTCF binding in DN and DP T cells. In contrast, site a showed a high similarity in species Homo sapiens, Pan troglodytes and Pongo pygmaeus abelii. These two sites haddifferential CTCF binding profiles in B lymphocytes and neural progenitor cells. However, these three CTCF binding sites were not conserved in Gallus gallus and Danio rerio species, which suggests that this aspect appeared at the mammalian level and is absent in organisms whose immune system is regulated differently.
Unlike Trak1, Gabpa only had two CTCF binding sites (Figure 2A). Given the role of the GABP transcription factor in mitochondrial biogenesis (Yang et al., 2014) and its expression in all the lineages examined (Figure 2B), the limited extent of CTCF binding events was not expected. The CTCF binding sites were occupied for T lymphocyte differentiation, but not for neuronal or B cell lineages. In particular, the Gabpa gene exhibited a specific CTCF binding site in DP T cells shown in Figure 2A at site a and a specific binding event at site b in DN T cells. Transcriptional regulation of this gene might be of importance in T lymphocyte differentiation, given its higher expression levels in the T-cell lineage. However, there were no binding events observed in motor neurons, neural progenitor cells and proB cells. No differences were observed between Gabpa gene expression levels in DP and CD4+ and CD8+ T cells, although expression levels were generally higher in T cell lineages than in B cell and neuronal lineages. Gabpa gene expression in neurons and lymphocytes appears to be regulated independently of CTCF, which is consistent with limited conservation of CTCF binding sites in phylogenetic studies. Site b was only conserved between humans and Equus caballus. In contrast, site a was well conserved among Homo sapiens, Pan troglodytes, Pongo pygmaeus abelii and Equus caballus (Figure 2C). Although our phylogenetic analysis revealed that the Gabpa gene has the highest overall conservation profile amongst all genes under investigation, the absence of conserved CTCF binding is consistent with suggestions that Gabpa gene expression is regulated independently of CTCF.
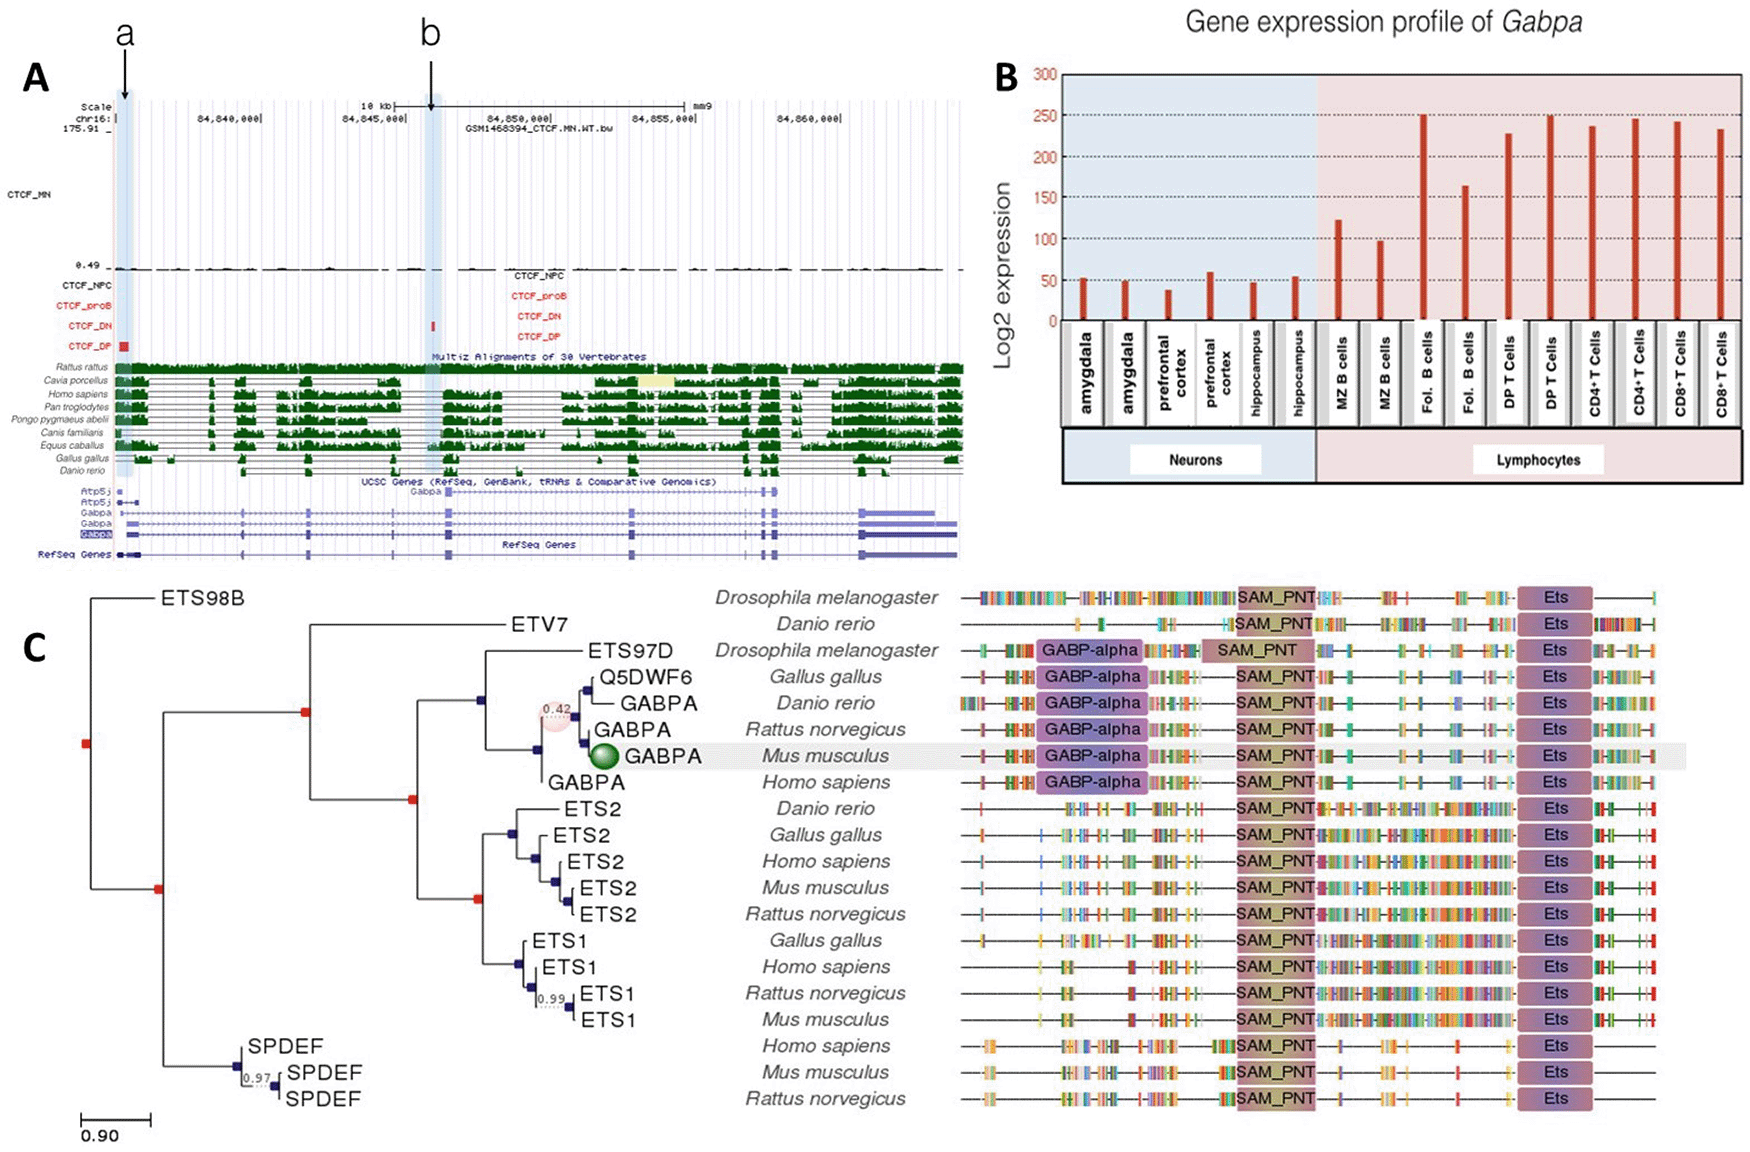
A: Gene conservation and CTCF binding profile at Gabpa locus, B: Gabpa gene expression in neurons and lymphocytes, C: Gabpa gene phlogeny depicting conserved domains.
In contrast to Gabpa, the Gabpb1 gene included a common CTCF binding site shared with neurons and lymphocytes. Site a in Figure 3A was occupied in all cell types except proB cells, while site b was occupied in all cell types examined. Interestingly, Gabpb1 gene expression was 2-to 3-fold higher in follicular B cells than thymocytes, and its expression in neurons was even lower (Figure 3B). CTCF binding at sit a might regulate suppression of Gabp1 in T cells and neurons along with other transcription factors. The correlation between CTCF binding and gene expression profile suggests that CTCF binding plays a role in the epigenetic regulation of Gabpb1 gene.
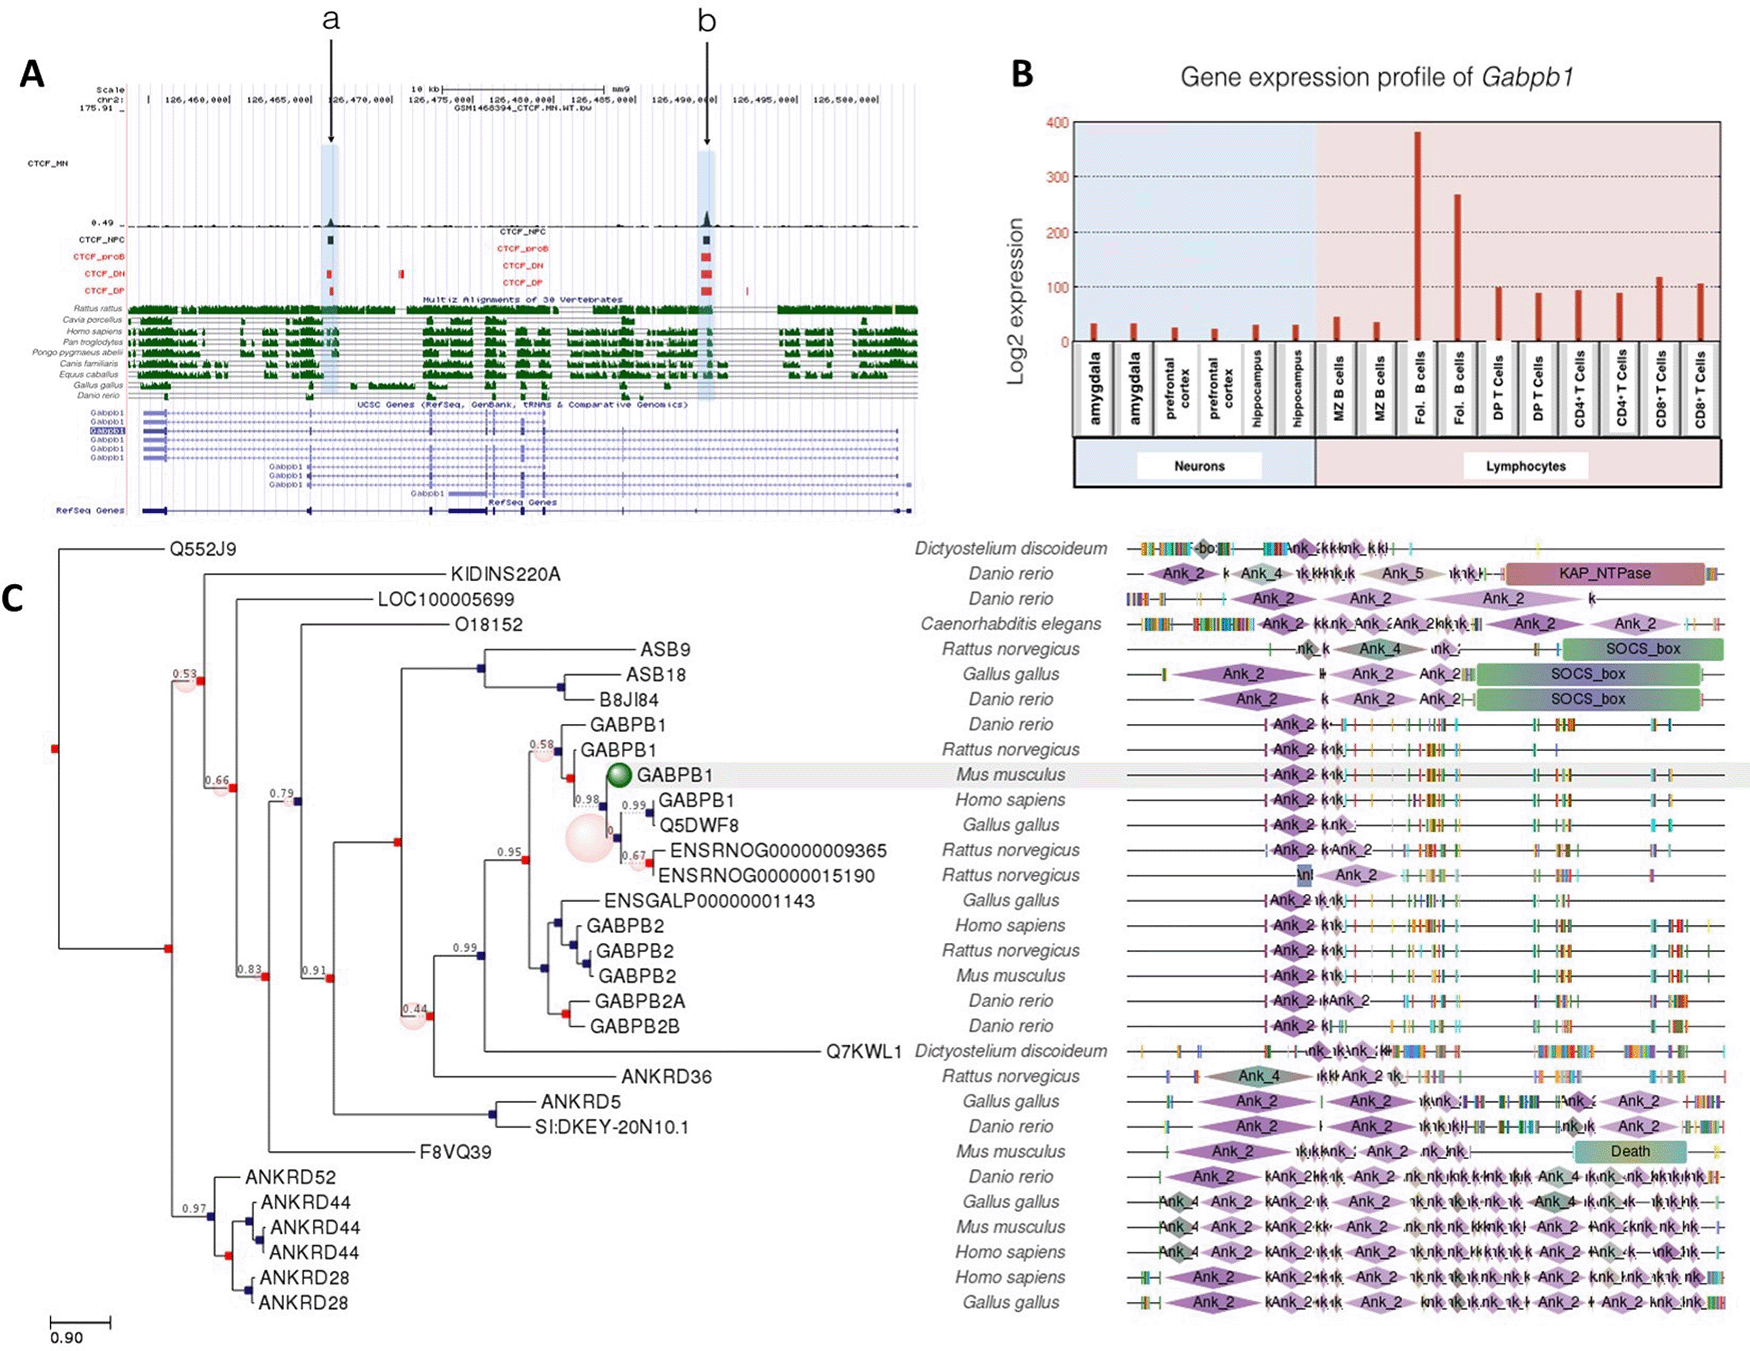
A: Gene conservation and CTCF binding profile at Gabpb1 locus, B: Gabpb1 gene expression in neurons and lymphocytes, C: Gabpb1 gene phlogeny depicting conserved domains.
A common CTCF binding event (site b) at Gabpb1 gene was well conserved in Rattus rattus, Homo sapiens, Pan troglodytes, Pongo pygmaeus abelii, Canis familiaris and Equus caballus. Site a, which was occupied in neurons and T cells, was conserved among Rattus rattus, Homo sapiens, Pan troglodytes, Pongo pygmaeus abelii.
Gabpb2 gene included a CTCF site common to all cells examined. There was only one CTCF site, site a which was only occupied in DP T cells. Like Gabpa and Gabpb1, Gabpb2 was differentially expressed in neurons and lymphocytes (Figure 4). Gabpb2 was highly expressed especially in B lymphocytes and moderately expressed in T lymphocytes, but showed almost no expression in the amygdala, hippocampus and prefrontal cortex. Similar to Gabpb1, Gabpb2 expression was also suppressed more in neurons than lymphocytes. However, CTCF binding site at Gabpb2 was conserved among more species than Gabpb1. This site was well conserved among Rattus rattus, Cavia porcellus, Homo sapiens, Pan troglodytes, Pongo pygmaeus abelii, Canis familiaris and Equus caballus. The role of CTCF binding in regulating Gabpb2 in these cells was modest and may require interactions with other transcription factors.
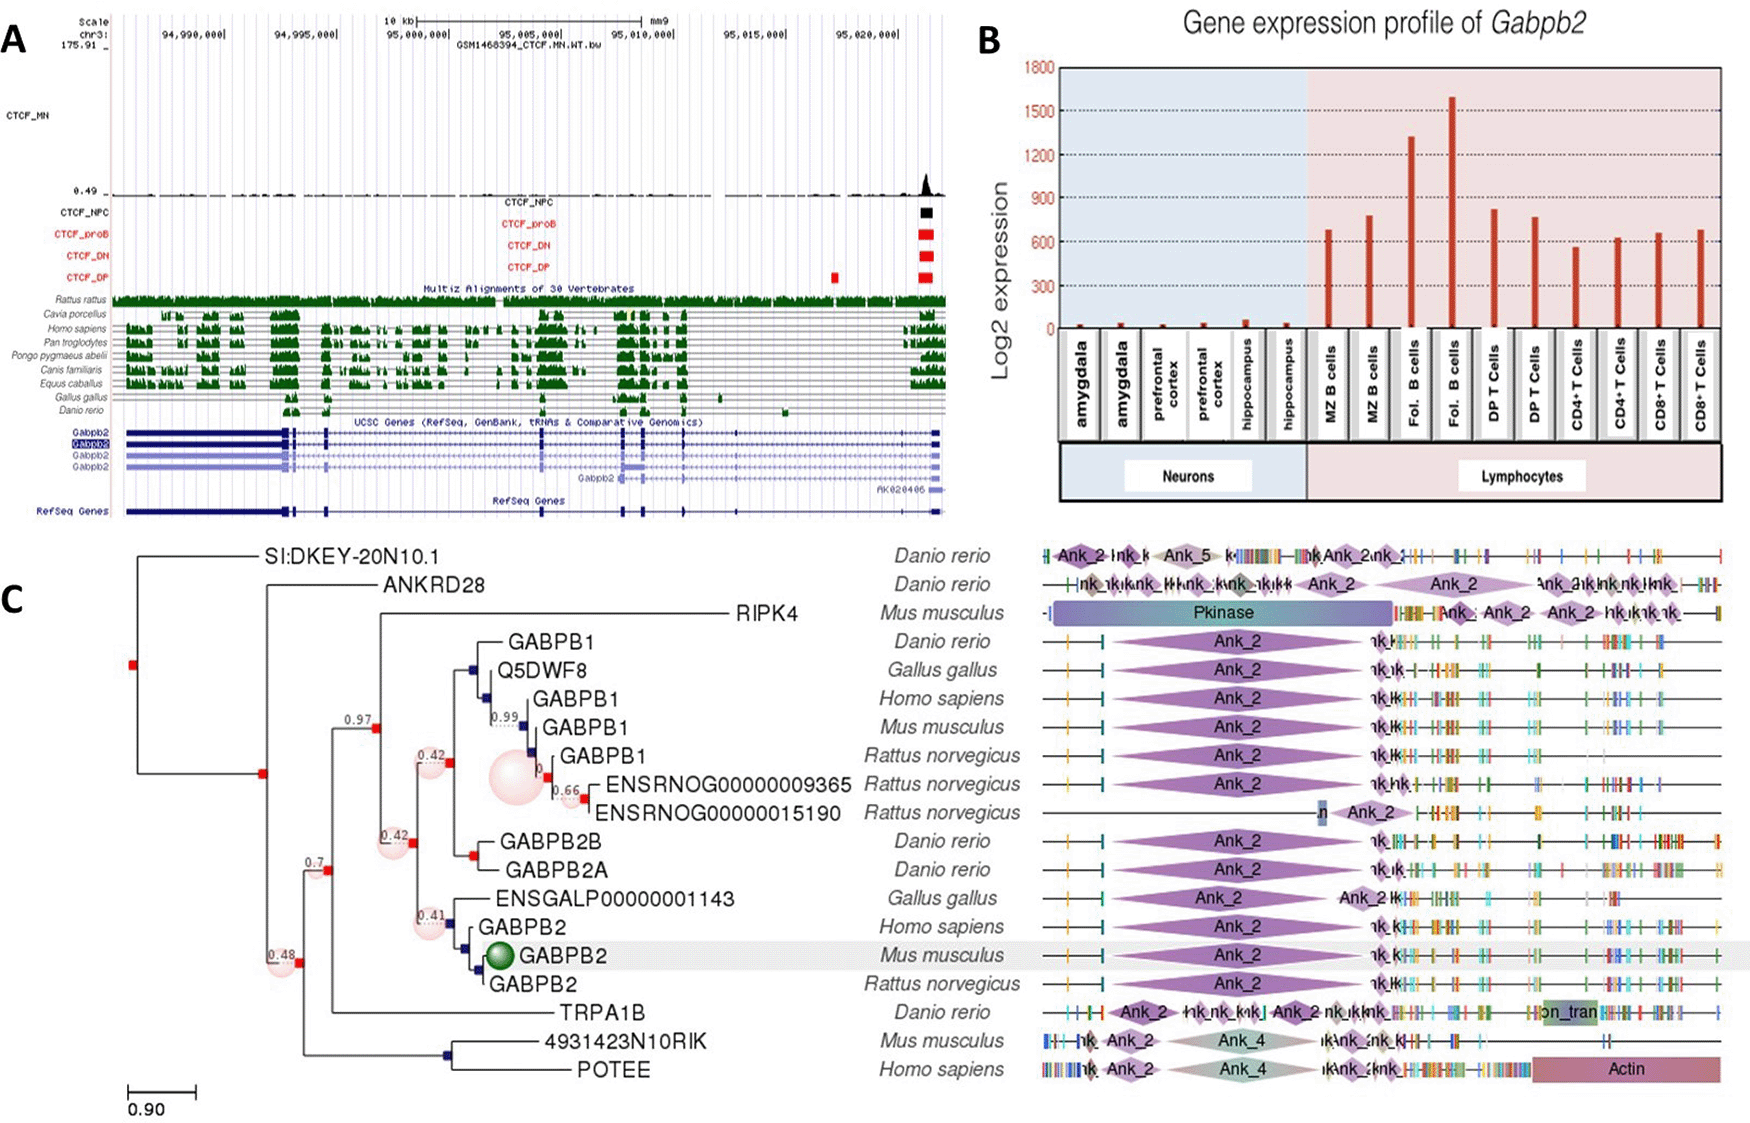
A: Gene conservation and CTCF binding profile at Gabpb2 locus, B: Gabpb2 gene expression in neurons and lymphocytes, C: Gabpb2 gene phlogeny depicting conserved domains.
CTCF binding sites at Gabp2 were evolutionarily more conserved than those at Gabp1, which may indicate that Gabpb1 has more specific roles in mediating neurogenesis and lymphocyte differentiation. Moreover, higher conservation of gene regulation via CTCF in primates suggest that the transcriptional suppression of the Gabpb1 gene might contribute to neuronal diversity in primates.
Gfi1 and Gfi1b are zinc-finger transcription factors which play a critical role in hematopoiesis (van der Meer et al., 2010); however, Gfi1b was also expressed in neurons, while Gfi1a was low or absent from neurons (Figures 5 and 6). Both DP T lymphocytes and proB lymphocytes were occupied by CTCF. There were 3 CTCF binding sites at Gfi1a gene locus for DP T lymphocytes, but only one was shared with proB lymphocytes. Gfi1a gene expression was relatively higher in DP T lymphocytes than other lymphocytes and neurons. This might be due to several factors. Given the fact that CTCF plays a critical role in the differentiation of lymphocytes, elevated gene expression levels might be dependent on CTCF binding to these sites.
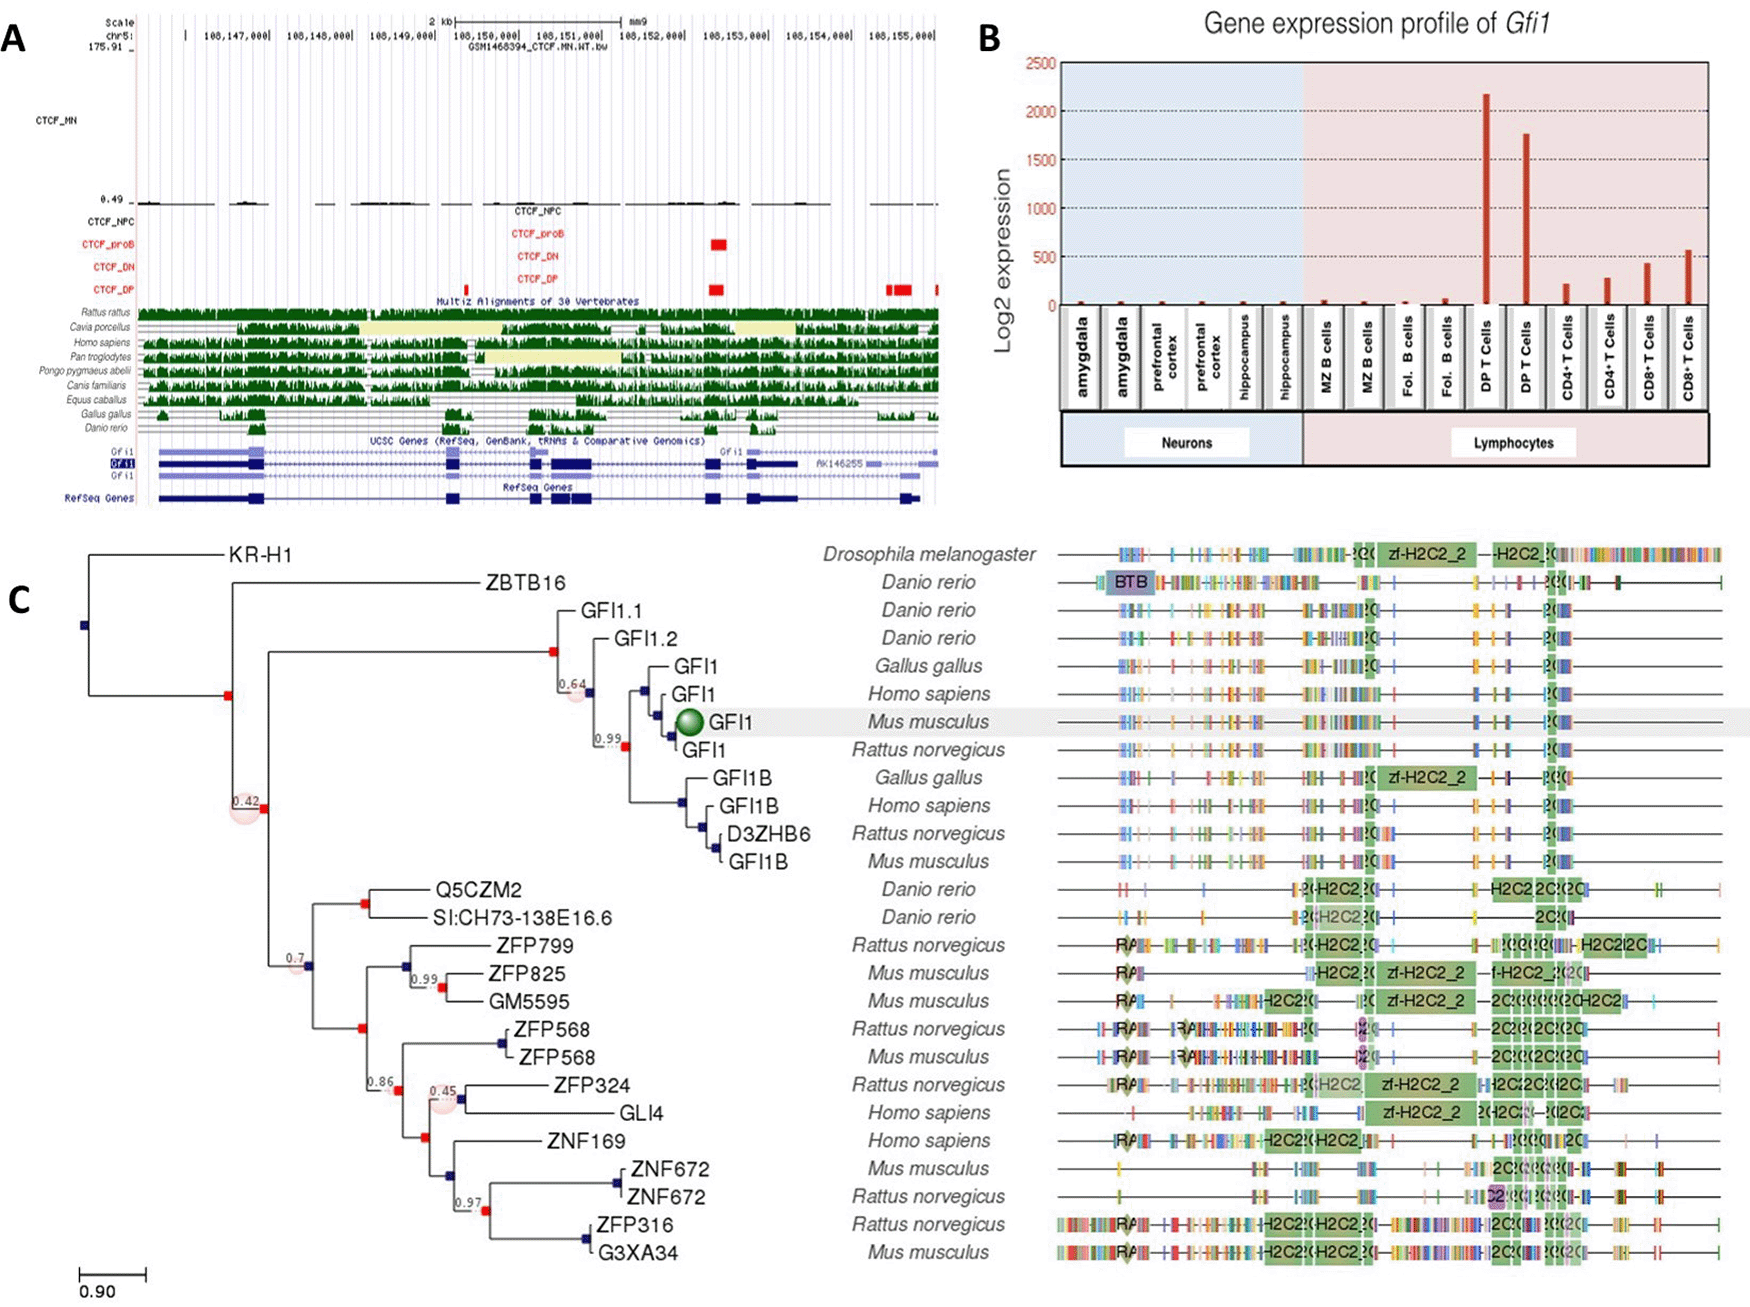
A: Gene conservation and CTCF binding profile at Gfi1 locus, B: Gfi1 gene expression in neurons and lymphocytes, C: Gfi1 gene phlogeny depicting conserved domains.
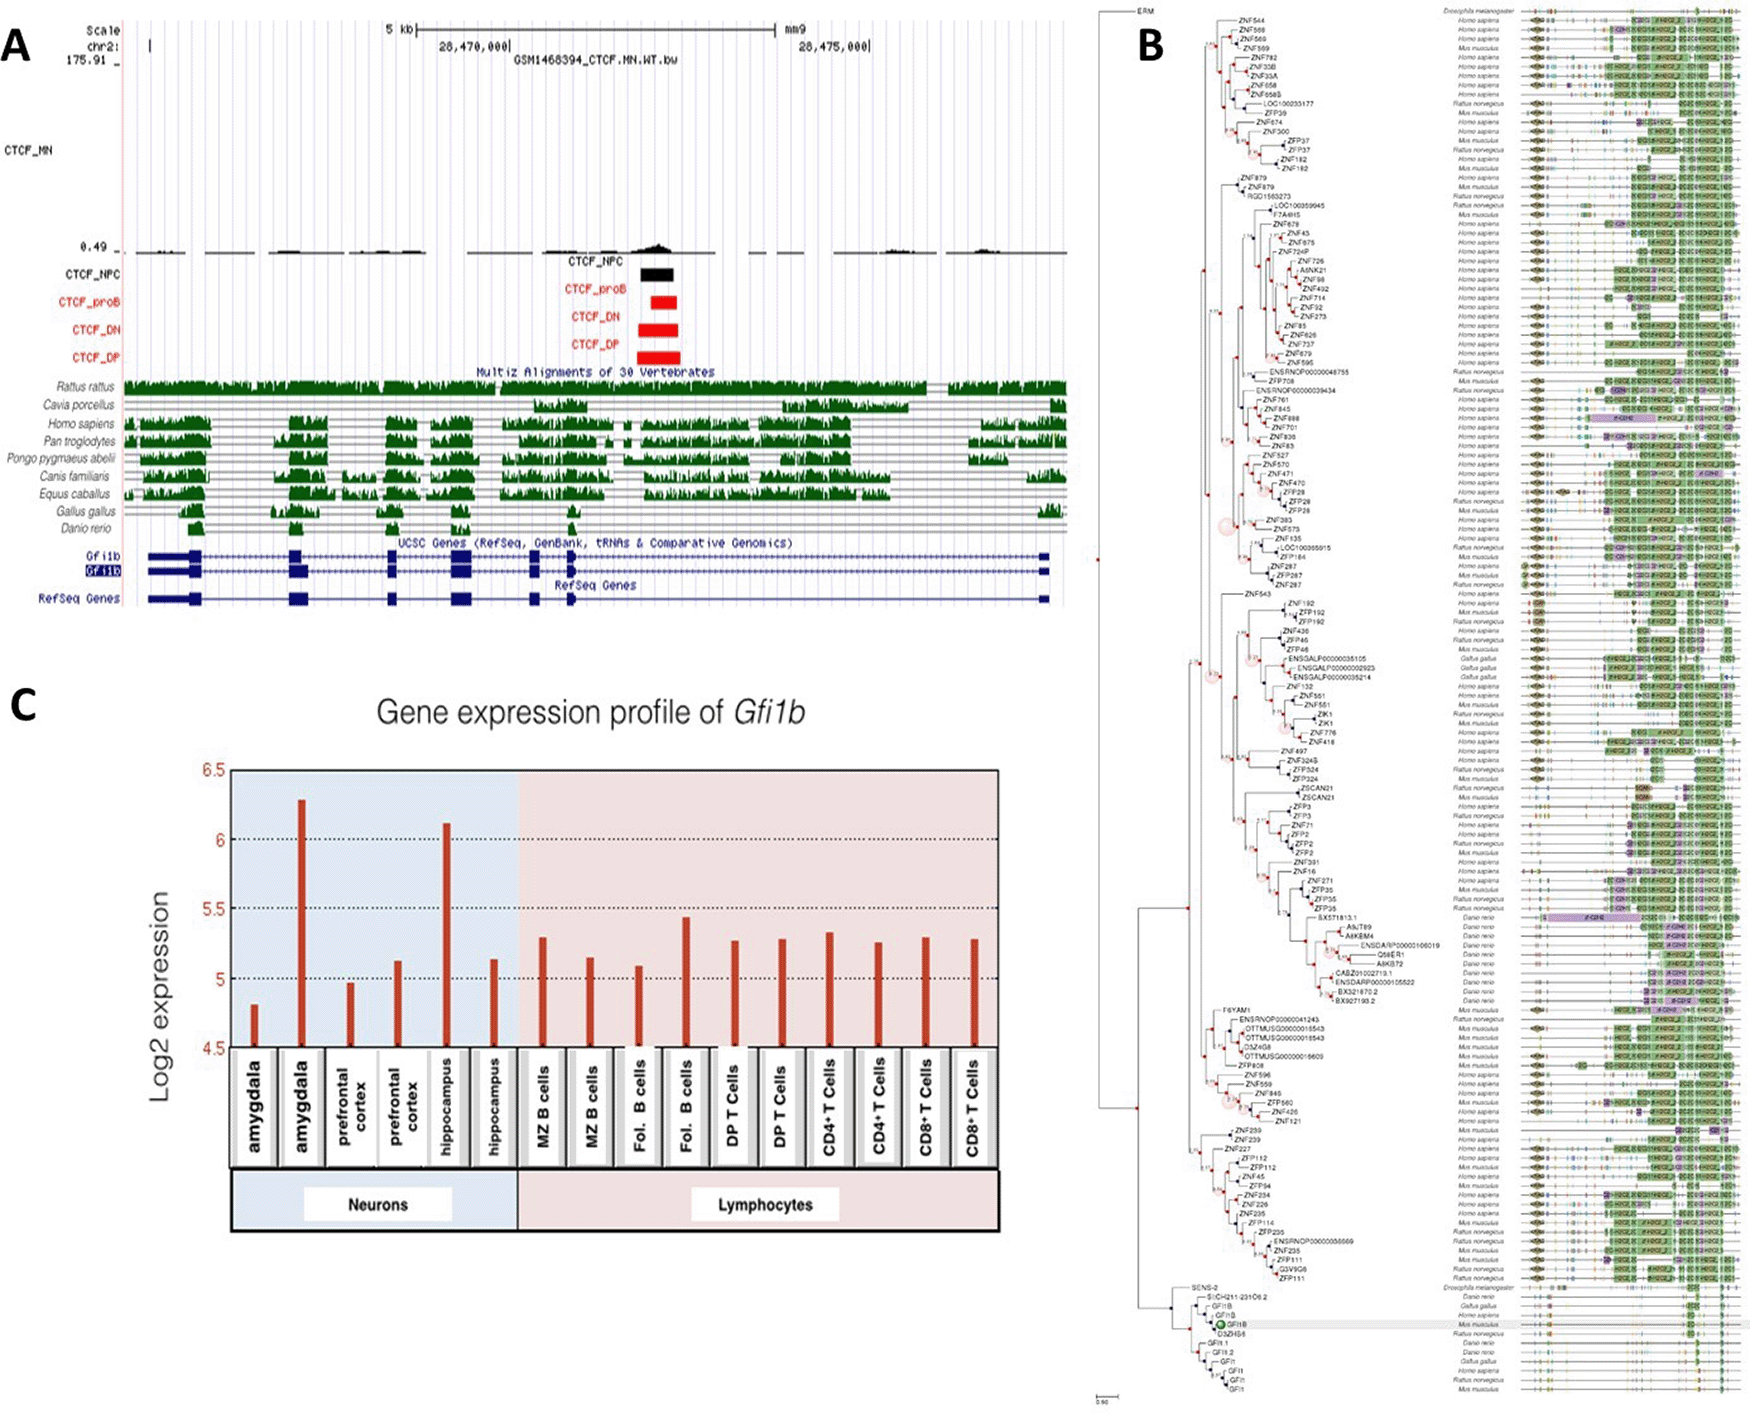
A: Gene conservation and CTCF binding profile at Gfi1b locus, B: Gfi1b gene phlogeny depicting conserved domains, C: Gfi1b gene expression in neurons and lymphocytes.
Unlike Gfi1, Gfi1b was expressed at moderate levels in both neuronal and lymphocyte lineages. Interestingly, there was only one conserved CTCF site at the Gfi1b gene locus, which was occupied in all cell types examined. Consistent with this, gene expression levels for Gfi1b were similar but not high in all cells. Both CTCF binding profile and gene expression levels were different than for Gfi1.
The CTCF binding event on the Gfi1 gene which was shared in B and T cells was conserved among Rattus rattus, Homo sapiens, Pan troglodytes, Pongo pygmaeus abelii, Canis familiaris and Equus caballus as well as Gallus gallus and Danio rerio. A more in-depth analysis of these conserved sites in Gallus gallus and Danio rerio will shed light in understanding the potential roles of Gfi1 in the evolutionary variation of lymphocytes.
Gfi1a was phylogenetically well-conserved in many species. There were no CTCF binding occupying neurons and neural progenitor cells. Low expression levels of Gfi1s in neurons indicate that the regulation of this gene is CTCF-independent. Although Gfi1b is highly homologous to Gfi1, differences in expression levels suggest that Gfi1b is not only critical for lymphogenesis but also neurogenesis. The common CTCF site at Gfi1b gene was well conserved between Rattus rattus, Homo sapiens, Pan troglodytes, Pongo pygmaeus abelii, Canis familiaris and Equus caballus. Gfi1a domains were conserved in more species than Gfi1b, despite their homology, so it is considered to be the most ancestral gene.
Consequently, differences in the regulation mechanisms of neurogenesis and lymphopoiesis may contribute to the identification of new target and signaling pathways for neurodevelopmental diseases. In this case, there appears to be more parallels in transcriptional regulatory pathways between neuronal and B cell lineages than between T cell and neuronal lineages. This may reflect the common role of neurons and B cells as secretory cells. Regardless, this emphasizes the importance of selecting the appropriate targets and cell types in the search for plasma markers of neurodevelopmental and neurodegenerative diseases. In this context, specific transcriptional regulators that play a role in their different expression levels need to be identified, although they contain common CTCF binding sites in neurons and lymphocytes.
CTCF ChlP-Seq:
- NCBI Gene Expression Omnibus: Genome-wide binding and mechanistic analyses of Smchd1 mediated epigenetic regulation [ChIP-Seq, MBD-Seq]. Accession number GSE65748, https://identifiers.org/geo:GSE65748
- NCBI Gene Expression Omnibus: CTCF.MN.WT [ChIP-Seq]. Accession number GSM1468394, https://identifiers.org/geo:GSM1468394
- NCBI Gene Expression Omnibus:CTCF_pro-B. Accession number GSM1023420, https://identifiers.org/geo:GSM1023420
- NCBI Gene Expression Omnibus:CTCF_DP ChIP_seq. Accession number GSM1023418, https://identifiers.org/geo:GSM1023418
- NCBI Gene Expression Omnibus:CTCF_DN ChIP_seq. Accession number GSM1023416, https://identifiers.org/geo:GSM1023416
Genes phylogenetic trees
- Ensembl Gene Tree: Trak1. Accession number ENSGT00940000155697; https://identifiers.org/ensembl:ENSGT00940000155697
- Ensembl Gene Tree: Gabpa. Accession number ENSGT00940000155799; https://identifiers.org/ensembl:ENSGT00940000155799
- Ensembl Gene Tree: Gabpb1. Accession number ENSGT00940000157875; https://identifiers.org/ensembl:ENSGT00940000157875
- Ensembl Gene Tree: Gabpb2. Accession number ENSGT00940000156794; https://identifiers.org/ensembl:ENSGT00940000156794
- Ensembl Gene Tree: Gfi1. Accession number ENSGT00940000156166; https://identifiers.org/ensembl:ENSGT00940000156166
- Ensembl Gene Tree: Gfi1b. Accession number ENSGT00940000160010; https://identifiers.org/ensembl:ENSGT00940000160010
Gene expression levels
- NCBI Gene Expression Omnibus: GNF Mouse GeneAtlas V3. Accession number GSE10246, https://identifiers.org/geo:GSE10246
- NCBI Gene Expression Omnibus: amygdala_4MJW061208119. Accession number GSM258617, https://identifiers.org/geo:GSM258617
- NCBI Gene Expression Omnibus: amygdala_4MJW061208120. Accession number GSM258618, https://identifiers.org/geo:GSM258618
- NCBI Gene Expression Omnibus: cerebral_cortex_prefrontal_4MJW061208177. Accession number GSM258637, https://identifiers.org/geo:GSM258637
- NCBI Gene Expression Omnibus: cerebral_cortex_prefrontal_4MJW061208178. Accession number GSM258638, https://identifiers.org/geo:GSM258638
- NCBI Gene Expression Omnibus: hippocampus_4MJW06120801. Accession number GSM258671, https://identifiers.org/geo:GSM258671
- NCBI Gene Expression Omnibus:hippocampus_4MJW06120802. Accession number GSM258672, https://identifiers.org/geo:GSM258672
- NCBI Gene Expression Omnibus: B-cells_marginal_zone_4MJW06120889. Accession number GSM258621, https://identifiers.org/geo:GSM258621
- NCBI Gene Expression Omnibus: B-cells_marginal_zone_4MJW06120890. Accession number GSM258622, https://identifiers.org/geo:GSM258622
- NCBI Gene Expression Omnibus: follicular_B-cells_4MJW06120849. Accession number GSM258663, https://identifiers.org/geo:GSM258663
- NCBI Gene Expression Omnibus:follicular_B-cells_4MJW06120850. Accession number GSM258664, https://identifiers.org/geo:GSM258664
- NCBI Gene Expression Omnibus: thymocyte_DP_CD4+CD8+_4MJW061208171. Accession number GSM258781, https://identifiers.org/geo:GSM258781
- NCBI Gene Expression Omnibus: thymocyte_DP_CD4+CD8+_4MJW061208172. Accession number GSM258782, https://identifiers.org/geo:GSM258782
- NCBI Gene Expression Omnibus: thymocyte_SP_CD4+_4MJW061208173. Accession number GSM258783, https://identifiers.org/geo:GSM258783
- NCBI Gene Expression Omnibus:thymocyte_SP_CD4+_4MJW061208174. Accession number GSM258784, https://identifiers.org/geo:GSM258784
- NCBI Gene Expression Omnibus: thymocyte_SP_CD8+_4MJW061208175. Accession number GSM258785, https://identifiers.org/geo:GSM258785
- NCBI Gene Expression Omnibus: thymocyte_SP_CD8+_4MJW061208176. Accession number GSM258786, https://identifiers.org/geo:GSM258786
| Views | Downloads | |
|---|---|---|
| F1000Research | - | - |
|
PubMed Central
Data from PMC are received and updated monthly.
|
- | - |
Provide sufficient details of any financial or non-financial competing interests to enable users to assess whether your comments might lead a reasonable person to question your impartiality. Consider the following examples, but note that this is not an exhaustive list:
Sign up for content alerts and receive a weekly or monthly email with all newly published articles
Already registered? Sign in
The email address should be the one you originally registered with F1000.
You registered with F1000 via Google, so we cannot reset your password.
To sign in, please click here.
If you still need help with your Google account password, please click here.
You registered with F1000 via Facebook, so we cannot reset your password.
To sign in, please click here.
If you still need help with your Facebook account password, please click here.
If your email address is registered with us, we will email you instructions to reset your password.
If you think you should have received this email but it has not arrived, please check your spam filters and/or contact for further assistance.
Comments on this article Comments (0)