Keywords
CA-Markov; future land use/land cover; Lepelle River Basin; land change modeller.
This article is included in the Agriculture, Food and Nutrition gateway.
CA-Markov; future land use/land cover; Lepelle River Basin; land change modeller.
In this new version, I have made corrections to grammatical errors all throughout the article. I have also rearranged some figures in terms of their positions. I have also removed some texts from the data analysis section. I did add a few new texts as well under the sub-heading "Analysis done for this study". I added another sub-heading called "Flow chart for this modeling work". I added a few texts in the validation section. I have also removed some texts in the conclusion part.
See the authors' detailed response to the review by Pieter van der Zaag
Socioeconomic activities together with related human population increase and general increase in urbanization, elucidated by the rate of expansion of cities globally, result in unimaginable land use/land cover (LULC) changes. The United Nations projects that the world population will grow by 10% (from 7.7 billion in 2019 to 8.5 billion in 2030), to 26% by 2050 (9.8 billion), resulting in 10.9 billion by the end of the 21st century (42% increase).1 These increases are expected to be concentrated in nine specific countries, namely India, Pakistan, Egypt, Ethiopia, Nigeria, the Democratic Republic of Congo, Tanzania, Indonesia and the United States of America.1 More strikingly, the human population of India is projected to overtake China by 2027. Thus, human population growth in both urban and rural areas is one of the major reasons for rapid changes in LULC. Various natural types of land cover are being converted to urban residential areas and other human uses.1,2 Land conversion from its original use into another land use type is known as LULC change, which is a consequence of complex interactions between human activity and the physical environment.2
Advances in geospatial modelling have made it possible to simulate land use change (LUC) at spatial scales. A method commonly used in simulation of LUC is based on cellular automata theory and the GIS framework found in TerrSet Clark labs 18.31.3 In recent times, the establishment of simulation models to monitor and simulate the changes in land cover has attracted local and global interest. Generally, most simulation approaches are duo-stepped: the first is the number of predictions, and the second is the simulation of the spatial patterns of the future. Attempts to incorporate LULC drivers with spatial patterns are very complex processes; hence they are few.
Land use activities have a direct correlation with global warming via modifications to the ecosystem by, biodiversity, and biological degradation processes which ultimately impacts and contributes to climate change. For instance, at medium confidence level, research showed that agriculture, forestry and other land use forms accounted for around “13% of CO2, 44% of methane (CH4), and 82% of nitrous oxide (N2O) emissions from human activities globally during 2007-2016, representing 23% (12.0 ± 3.0 GtCO2e yr-1) of total net anthropogenic emissions of GHGs21”.4
These land use changes lead to landscape alterations and negatively affect natural land surfaces. The loss of biodiversity, higher emission of greenhouse gases, degradation of soils and global climate change can be directly traced to negative LULC trends.5 It is therefore very important to understand the dynamics of LULC in terms of the causes, consequences, and sequence.6 In the last two decades, several categories of models (such as analytical equation-based models, statistical models, evolutionary models, cellular models, Markov models, hybrid models, expert system models and multi-agent models) have attempted to analyse and predict future LULC with varying degrees of success.2,7 Within Africa, a few studies have used the Markov chain model (e.g. Refs. 8, 9) while only a handful in the environmental discipline (such as Refs. 10, 11) have used the Cellular Automata-Markov (CAM) approach. This study also uses the CAM model. Both the Cellular Automata (CA) and Markov model have great advantages in the study of LUCs, albeit both have respective disadvantages (see Ref. 12). The Markov chain model has been widely used to determine LUCs, however, the traditional Markov chain model has slight difficulty in predicting the spatial pattern of LUCs. The CA model, with powerful spatial computing capabilities, simulates spatial variation of systems more effectively.2,13 The CA–Markov model provides a robust approach for the spatial and temporal modelling of LUCs because the Markov model outputs and GIS-based Land Change Modeller (LCM) results can be incorporated effectively.2 The CA–Markov model incorporates the benefits from the time series inherent in the multi-layer perceptron (MLP) neural networks training parameters and spatial predictions of the CA theory.3 In this study, the LULC of the Lepelle River Basin (LRB) is analysed using the GIS-based CAM module in Idrisi Clarks Lab 18.31 version.
The LRB, formerly known as the Olifants River Basin, is one of Southern Africa’s most important catchments. Geographically, this river basin is in the north-eastern corner of South Africa and southern Mozambique bounded between coordinates 23°46′24.0″ S to 26°33′40″ S and 28°19′28.5″ E to 31°57′25.5″ E (Figure 1). The Lepelle River is approximately 770 km long and, with its tributaries, drains 54,570 km2 which is an area equivalent to the size of Slovakia or Croatia.14 Its waters irrigate farming across the western section of the Mpumalanga Province in South Africa and supply water to several coal-operated power stations in the area. The river also flows through the Limpopo Province’s platinum belt and supplies water to several mines. It then flows through the Drakensberg mountains and down the escarpment to irrigate farms in the “Lowveld” (situated in Mpumalanga Province of South Africa) and brings life to the Kruger National Park.14 Finally, it joins the Limpopo River in Mozambique, before flowing into the Indian Ocean south of Xai-Xai. This makes the river critical to the economies of both South Africa and Mozambique.15 The 30 dams along its course also provide water to three provinces during times of drought and approximately ten million people rely on this water.16
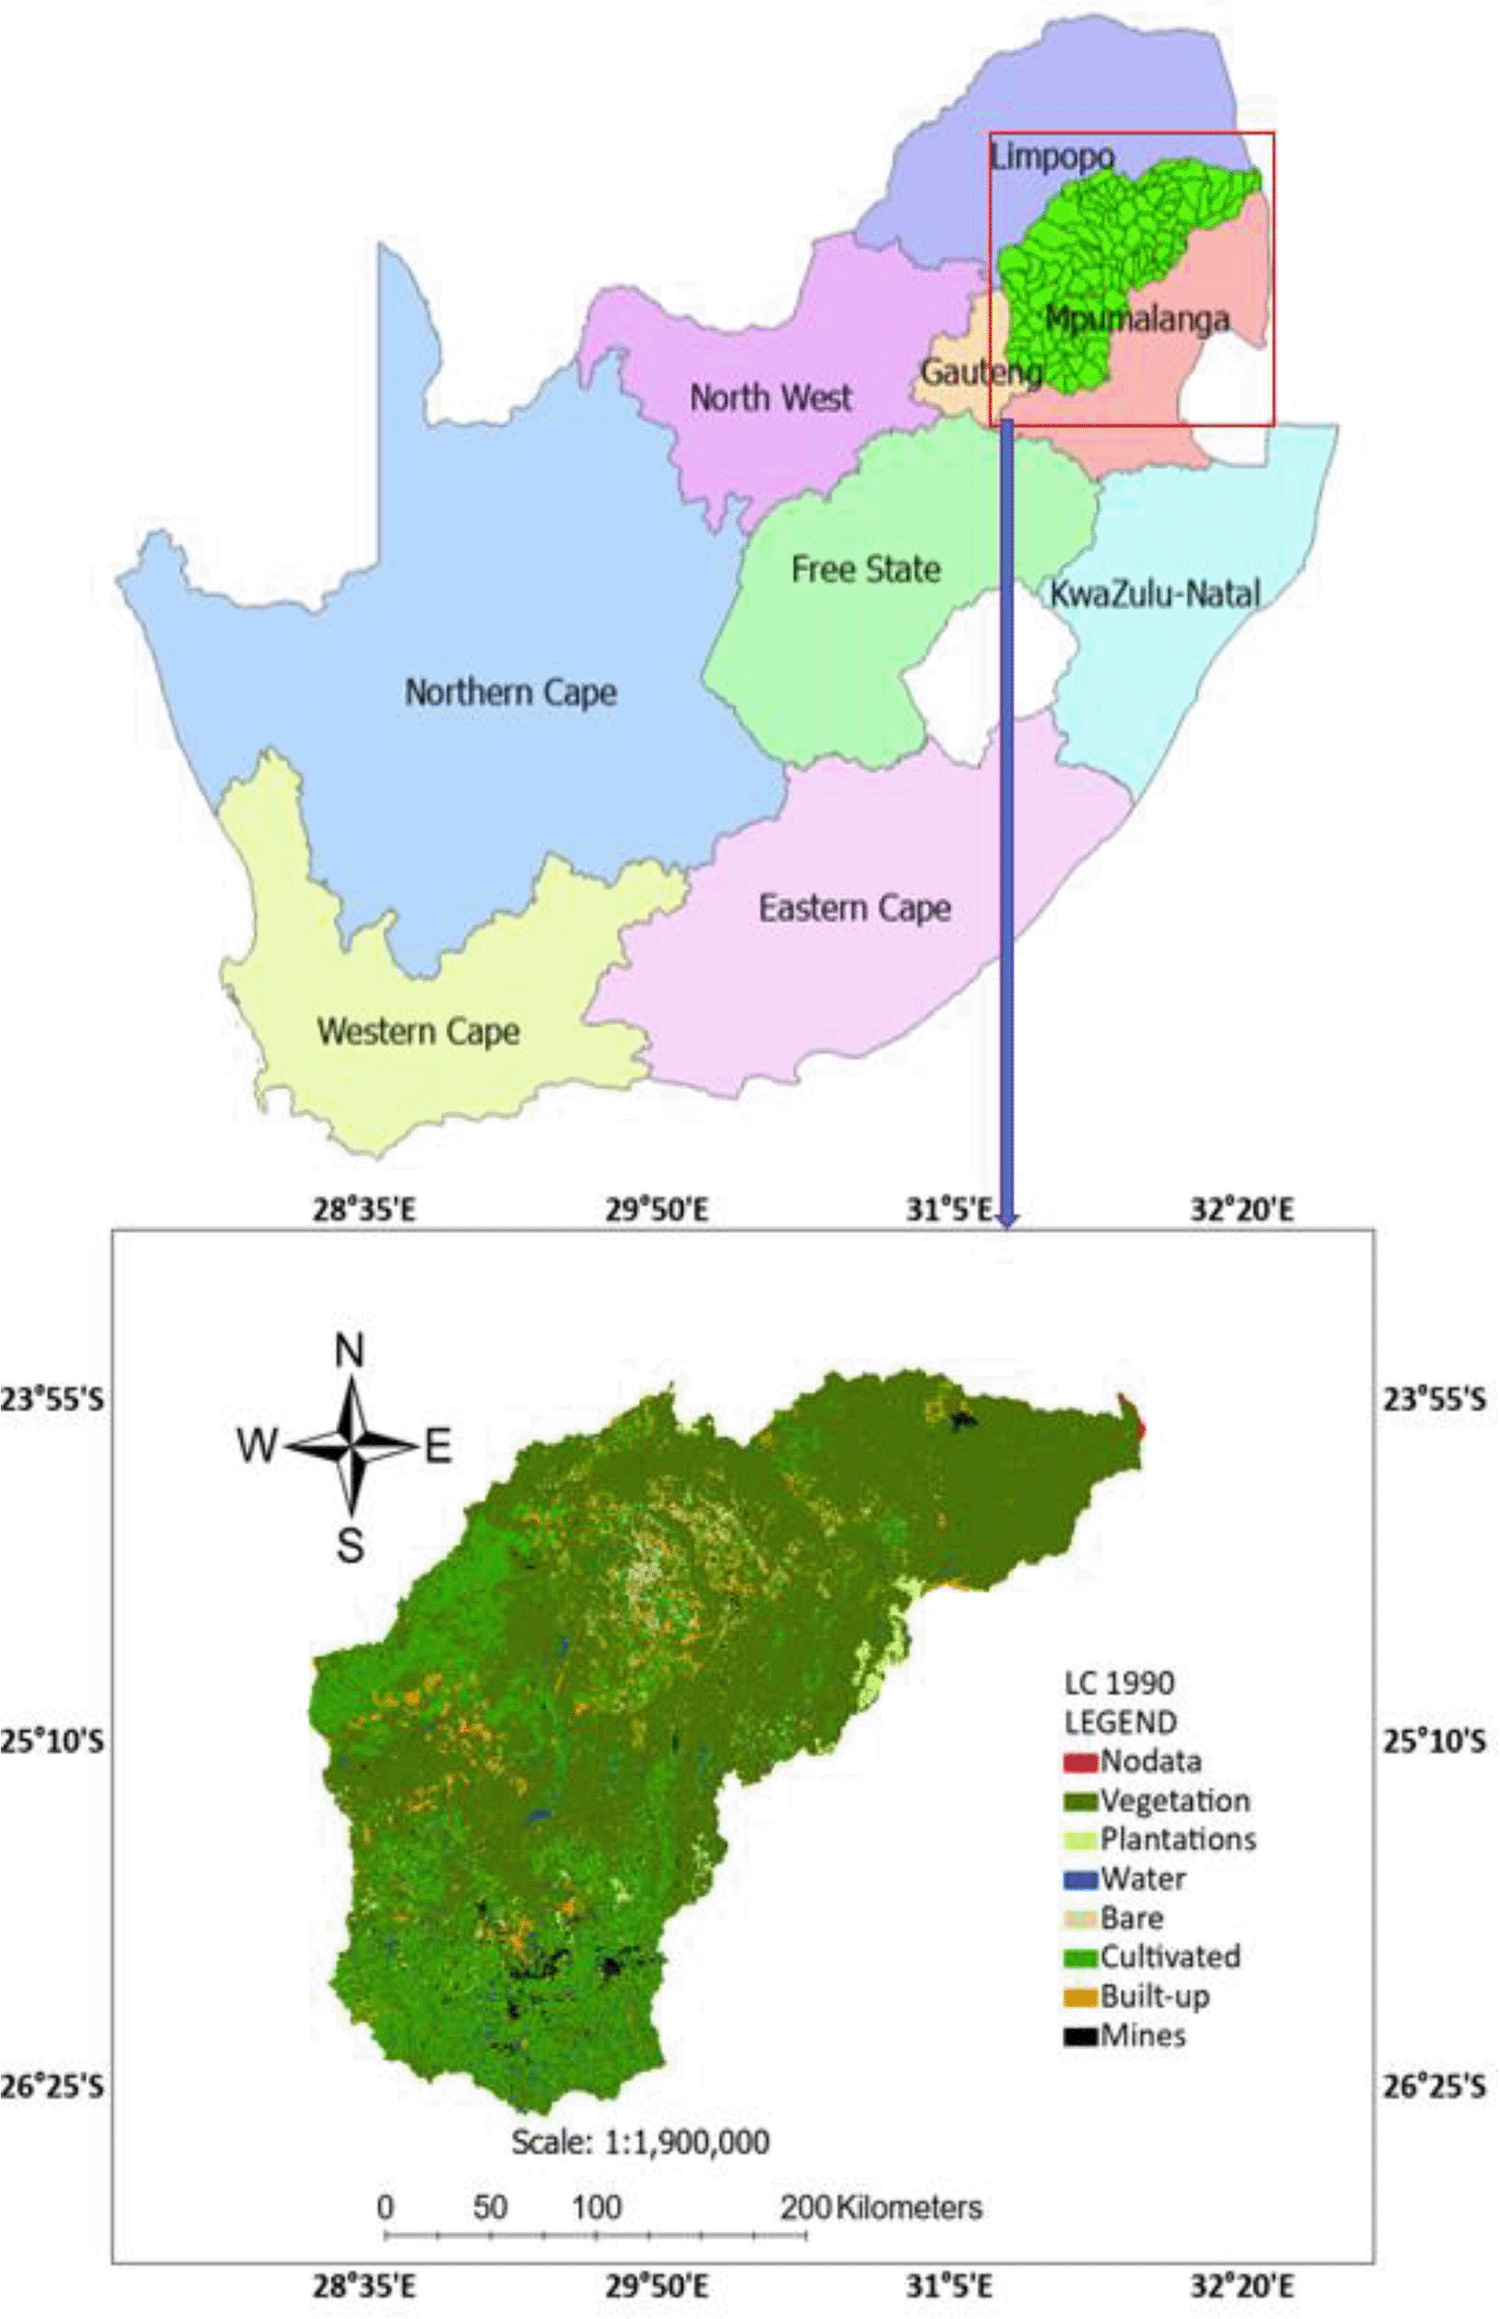
For this study, land use/cover data already processed by the South African National Biodiversity Institute (SANBI) for 1990 and 2013-2014 were used for calibration, this is so, because there was no need to reinvent the wheel. Also, the South African National Land-Cover (SANLC) datasets for 2018 were used for validation because of its superiority to the conventional data from supervised/unsupervised methods. This superiority arises from the fact that landscape mapping and consequent change detection in natural landscapes, such as woodland, grassland and shrublands etc. are typically more challenging; since these landscape features typically do not have ‘hard’ boundaries, but rather gradients, within which a class boundary must be defined. In addition, this challenge is often compounded as a result of inter-annual seasonal differences, and associated differences in interpretable spectral/spatial image characteristics. So, the SANLC 2018 data is better than the old conventional SANBI one because it has improved spatial, spectral and temporal capabilities such as being able to provide 20-meter resolution imagery compared to the 30-meter imagery from the old one.17 The models and algorithms used to generate the SANLC 2018 dataset are based on those used in the production of the SANLC 1990 and SANLC 2013-14 datasets, but were modified and adapted to suit the enhanced spatial, spectral and temporal characteristics of 20 m resolution Sentinel 2 satellite imagery.17
1990 and 2013-2014 land use/cover datasets
SANBI produced the 1990 and 2013/2014 dataset using the LANDSAT Thematic mapper 5 for the whole of South Africa. The production of the 1990 and 2013-14 SANLC datasets quantified landscape changes through a 25-year period with good spatial scale and detail.18 This process of generating the 1990 and 2013-14 SANLC dataset was possible because both datasets used equivalent image data and mapping procedures. Both datasets were analogous with detail, scale, and consistency of information and content.17 Both national land-cover (LC) datasets used semi-automated spectral modelling techniques to generate the basic LC components. These basic LC components form the basis upon which the more detailed final LULC data were deducted and classified. These quasi-automated LC mapping techniques offer a more efficient alternative to conventional classification techniques.17 Unlike the analyst-assisted pixel-based classifiers techniques, these automated techniques allow for rapid production of standardised, yet informative LC classifications. This facilitated the necessary standardised references from which landscape changes could be derived and quantified.17
2018 dataset
The new SANLC 2018 dataset was generated from 20-meter multi-seasonal Sentinel 2 satellite imagery.17 The imagery adopted describes the full temporal range of available imagery acquired by Sentinel 2 spanning 01 January 2018 to 31 December 2018. The SANLC 2018 dataset relied heavily on the Oct 2020 gazetted land-cover classification standard (SANS 19144-2) having 73 classes of information and is analogous to the previous 1990 and 2013-14 SANLC datasets.19 The 1990 and 2013-14 South African National Land-Cover datasets which were used for the CAM, as the earlier and latter image, were both generated from 30 meter resolution collected from Landsat Thematic Mapper TM 5 imagery, as this was the best option available at that time of production, with regards to free-to-access, medium resolution imagery.17 The timely launch of Sentinel-2A in late 2015, and subsequently Sentinel-2B in early 2017, has resulted in it becoming accepted as the de-facto medium resolution imagery of choice for current and ongoing landscape mapping and classification in South Africa.17
The SANLC 2018 dataset which evolved from SANBI was generated solely using European Space Agencies (ESA) free-to-access Sentinel-2 satellite imagery, acquired during the period 1 January – 31 December 2018. Sentinel-2 imagery was chosen over Landsat 5 as the preferred source of imagery due to its improved spatial, spectral, and temporal capabilities, compared to Landsat.17 Sentinel 2A and 2B satellites are collectively able to provide 20-meter resolution imagery, containing 12 spectral bands, every five days, anywhere across the globe. This has enabled a full seasonal profile of image acquisitions to be used in the 2018 land-cover modelling procedures; as it has been possible to acquire as a minimum, at least one but often more cloud free image coverages per month, over all locations within South Africa, which is not possible with Landsat due to the significantly lower 16-day update cycle. Thompson17 indicates that the same Sentinel 2 only image content approach will be continued in all future SANLC datasets generated using the same modelling and production procedures in the production of the new SANLC 2018 dataset finalised and made publicly available on 1st October 2019 from https://egis.environment.gov.za/data_egis/data_download/current. It is worth noting that no effort was made to perpetrate the errors from the old dataset in the new data set.17 Also, the difference between this data sets are quite minute when compared individually
Image processing and data analysis
According to Thompson17 the generation of automated land-cover data in the new, Sentinel 2 based procedure involves two separate, but sequential processing steps. Firstly, fully automated image modelling procedures known as “New Development and Expansion Insights” (NDEI) hosted in the GEOTERRA Image spatial modelling software were used to generate what is referred to as the “spectrally-defined” base LC characteristics. These characteristics are the primary ‘building blocks’ which are used to describe the entire landscape in terms of primary cover characteristics such as woody vegetation, grasslands, bare or water-dominated surfaces etc. No attempt was made at this stage to define additional detail such as whether the tree cover was a natural forest, or a managed forest plantation etc.
The conversion of these primary ‘base’ land-cover classes into more detailed sub-classes, such as natural versus man-planted forest, occurred during the second step. In the second step, ancillary spatial datasets, referred to as ‘geographical masks’, available in ArcGIS were used to convert the base land-cover classes into more detailed sub-classes. The geographical masks define specific, pre-determined areas-of-interest within the South African landscape, within which the primary, spectrally defined base classes were de-constructed into more specific land-cover and/or land-use sub-classes. In each case, a specific set of modification rules which could be either multiplication, division, null set etc rule hosted in the Map algebra tool of ArcGIS were used to either amalgamate, sub-divide or re-allocate the primary, base-level class (es) to the required sub-class detail. The primary rationale behind the use of these geographical masks was to facilitate the delineation of sub-classes that could not be achieved using spectral data alone. This is because spectral data only describe the broad categories of the full landscape extent. Since many unrelated sub-classes can often share similar spectral characteristics (e.g., river water versus water-in-pans, or coastal dunes and sand-roads) the masks were needed.
Automated LC mapping models and associated procedures were used in the production of the SANLC 2018 dataset.17 These utilise both cloud-based image archives and cloud-based geo-data computing capabilities. However, the final compilation and merging of the different land-cover and land-use information components (i.e., water, mining extent, forest plantations etc), were completed in a conventional desktop environment. GEOTERRA Proprietary software’s automated modelling capabilities were employed in these desktop environments.17 This design was used so that the entire workflow could eventually be migrated to cloud-based technologies and become a fully automated process to allow the SA Government to generate comparable South African National Land-Cover datasets in the future. This process (termed “CALC” for Computer Automated Land-Cover”), is projected to enhance the generation of a new, updated SANLC 2020 dataset in early 2021 due to its ability to easily detect boundaries and/or unique (image) spectral characteristics.
The models and algorithms used to generate the SANLC 2018 dataset are based on those used in the production of the SANLC 1990 and SANLC 2013-14 datasets but have been modified and adapted to suit the enhanced spatial, spectral, and temporal characteristics of 20m resolution Sentinel 2 imagery, as opposed to the 30-meter resolution Landsat imagery previously used. The overall concept and approach to land-cover and land-use modelling is, however, essentially the same as that used in the production of the previous SANLC 1990 and SANLC 2013/14 datasets. However, the LULC classes obtained from the SANLC (47-class categories) were still too many and would have resulted in too much computation by the CA-Markov model., hence, they were reclassified into seven main classification types, as defined in Table 1, using ArcGIS Pro 2.8. QGIS can also be used to generate the results as a free alternative to ArcGis Pro.
Analysis done for this study
For this study, these 47 classes, were reclassified into seven main classes, as defined in Table 1, using ArcGIS Pro 2.8. This was done in the mask environment. Setting an analysis mask meant that processing occurred on locations that fall within the mask, and all locations outside of it was assigned No-Data in the output. The analysis mask was a raster, therefore, all cells that had a value were considered to define the mask, while those without a value were classified No-data. The Reclassify and Con tool in ArcGIS Pro were employed for this operation. QGIS can also be used to generate the results as a free alternative to ArcGIS Pro.
LULC change modelling
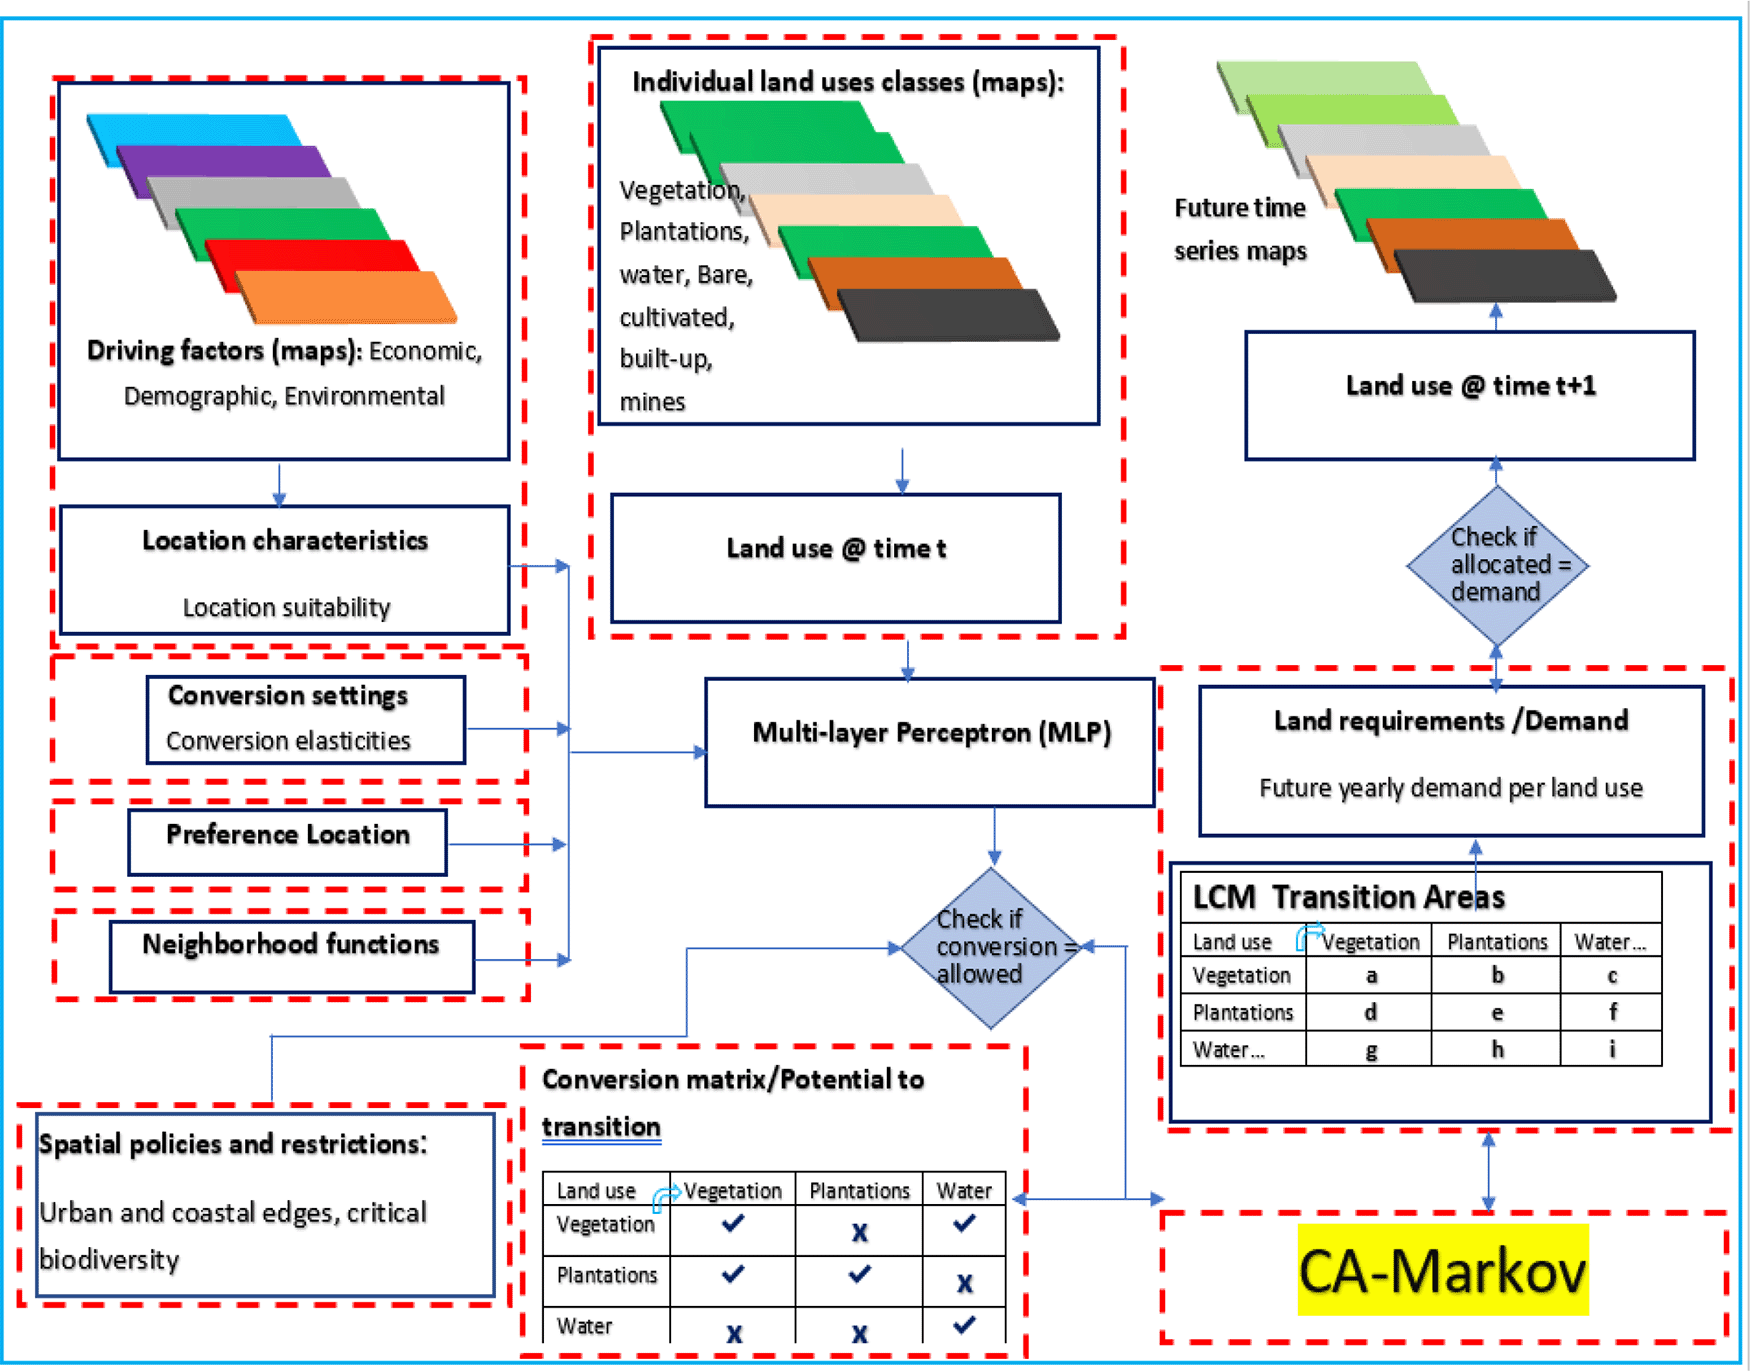
LULC change was analysed using Land Change Modeler (LCM) in the TerrSet (AKA IDRISI) software, which is a stepwise empirically-driven model which follows three broad steps of 1) Change analysis, 2) Transition potential computation and 3) Change prediction to generate future land cover map.3,20
The transition potential of each LULC class was used by the LCM model to generate transition areas for the LULC classes for 2018. These areas were then used by CAM as input areas for generating the 2018 LULC map by making use of the Transition suitability map. This tool was originally developed to manage biodiversity influences, and to analyse and forecast LULC changes.12,20 This model is based on the Artificial Neural Network (ANN), Markov Chain matrices, and transition suitability maps, generated by training with MLP or logistic regression.3 This model attempts to predict the LULC changes from the thematic raster images having the same number of classes, same extent (same rows and columns), same resolution, and same sequential order, this is important or else, errors would occur leading to the sudden termination of the project.12,21 QGIS may be used as a free alternative to TerrSet to generate the results.
CA-Markov model
Markov chain analysis is a very useful tool for estimating Probability Distribution Functions (PDFs) of potential outcomes and has been applied widely to land cover change modelling.22 It assumes that the probability of a system being in a certain state at a certain time can be determined if its state at a previous time is known if rates of change through the calibration period will remain constant throughout the simulation period. Through a process of cross-tabulation of land cover areas Markov chain sequence estimates the amount of land cover change that will occur to the future date.3 The main approach of the Markov chain, which is a component of the CAM, is the generation of transition areas and a probability transfer matrix for the prediction of future land use/cover change trends. The Markov chain model can be summarized as timelines where the current timeline is which can be transformed to a future point in time by the transition probabilities . Therefore, timeline in the system can be computed by the former timeline in the Markov chain using equation (1) below.
Where P = Probability matrix in the Markov model
Low and high probabilities are bounded by 0 and 1, respectively.
The Cellular Automata (CA) model is a bottom-up dynamic model that integrates the spatiotemporal dimension and thus incorporates direction. Importantly, CAM simulates the space-time complexity even though space–time and state are discrete.23,24 This allows for a more accurate demonstration and simulation of the spatial and dynamic processes in LULC. The CAM model mainly contains cells, cell space, neighbours, rules, and time. The neighbours are identified by the filter of the CA model. The closer the distance between the central cell and its neighbour, the greater the weight factor. This agrees with Tobler’s first law of geography, which says that all things are related but nearer things are more related than distant things.25
The CAM model is a mixture of cellular automata and Markov chain nested within the TerrSet Geospatial Monitoring and Modelling System (TGMMS). The TGMMS model processes raster data such as ‘geotiff’ format data processed in ArcGIS Pro in the TerrSet Clark lab software module. The transition areas of the Markov chain model are normally used as inputs for the CA model.26 However, the transition areas file generated alongside a probability matrix in the LCM module was found to be more suitable as an input for the CA-Markov than the conventional transition areas from Markov chain model. This can be attributed to the MLP machine learning process executed by LCM forced against the driving factors. To determine these, the LCM utilised the TerrSet’s Markov module at the time a prediction is run. According to Eastman,3 Markov calculates using the earlier and latter images how much land will be expected to transition from the latter image to the prediction date based on transition potentials into the future.
An important aspect of any modelling or prediction is the validity or confidence level of the prediction. Kappa statistics is one of the validation tools embedded in the Idrisi module alongside the CA-Markov model. Kappa statistics provide a quantitative measure of the goodness of fit or the best value between the predicted model and the observed maps, revised for precision by possibility in the form of (overall accuracy), (kappa for grid cell level location), (kappa location strata), and (kappa standard). The Kappa values are bounded by 1 and -1, where positive values show, by chance, rare greater improved agreement, and negative values indicate a lack of or bad agreement.12 Kappa values are categorised as poor (< 0.40), fair to good (0.40-0.75), and excellent (> 0.75).12
The CAM model also considers suitability of LUCs and the effect of natural, societal, and economic factors about LUCs. Based on previous research by Faichia et al.2 and the recent trend towards LUC,12 this paper analysed the LUCs for the LRB in South Africa. This was based on the quantity of LUC characteristics of the structure and spatial pattern as the primary research content. The CAM model combined with GIS was selected to capture the complex dynamics of the study area. The Markov model is better suited for long-term forecasts, effectively simulating the spatial pattern of LUCs, with great science and practice. The norm when using CAM is to input the transition areas file generated by the Markovian transition estimator found within the Markov Chain module, however, the transition area file generated by the LCM can also be used in place of that from the Markovian estimator. This was done as certain studies12,27,28 have documented that MLP is much more efficient for calculating multiple transition potentials for shorter time periods with areas experiencing less landscape changes.29,30 Even though TerrSet’s Multi-objective Land Allocation (MOLA) helps to resolve conflicting factors when using the multi-criteria evaluation (MCE), the choice of which driver variable to include for a particular land category transition analysis is purely based on expert judgement. But with LCM, the MLP trains the driver factors and determines which to include into the computation for the transition potentials. To successfully simulate scenarios in CAM, a few things must be considered such as windowing, working directories and space available in disc. These factors must be considered, else frequent errors will occur leading to unexpected termination of the simulation. Windowing in TerrSet Clarks Lab is a way of fine-tuning the extent of a spatial image such that the number or rows and columns are the same. The working directory for any simulation in TerrSet Clarks Lab must be specified to avoid error due to missing data. Lastly, the space available should be preferably 100GB or more.
LULC future scenarios
LCM generates two predictors of future land cover namely soft prediction and hard prediction. Soft prediction, denoted by the potential to transition map, is a continuous mapping of vulnerability to change.3 It was computed by combining all the transition potentials to estimate the propensity to which the areas have the most favourable conditions to precipitate change. The soft predictor reveals the probability of a cell to experience land cover change. However, it does not provide an indication as to what the new land cover will be. Conversely, the hard prediction procedure is based on the MOLA module which negotiates a suitable compromise by optimizing the suitability of lands for each objective given the assigned weights matrix.3 Land allocation conflicts were resolved by allocating cells to the land cover class with the highest weighted transition potential, based on a rule of minimum distance to ideal point by assigning the weighted ranks described by Houet and Hubert-Moy.31 Finally, the transition probability matrix generated from the Markov chain analysis informed how much land is allocated to a class for the future. Thereafter, the transition areas generated by the LCM module were then captured as inputs into the CAM model.
Flow chart for this modeling work
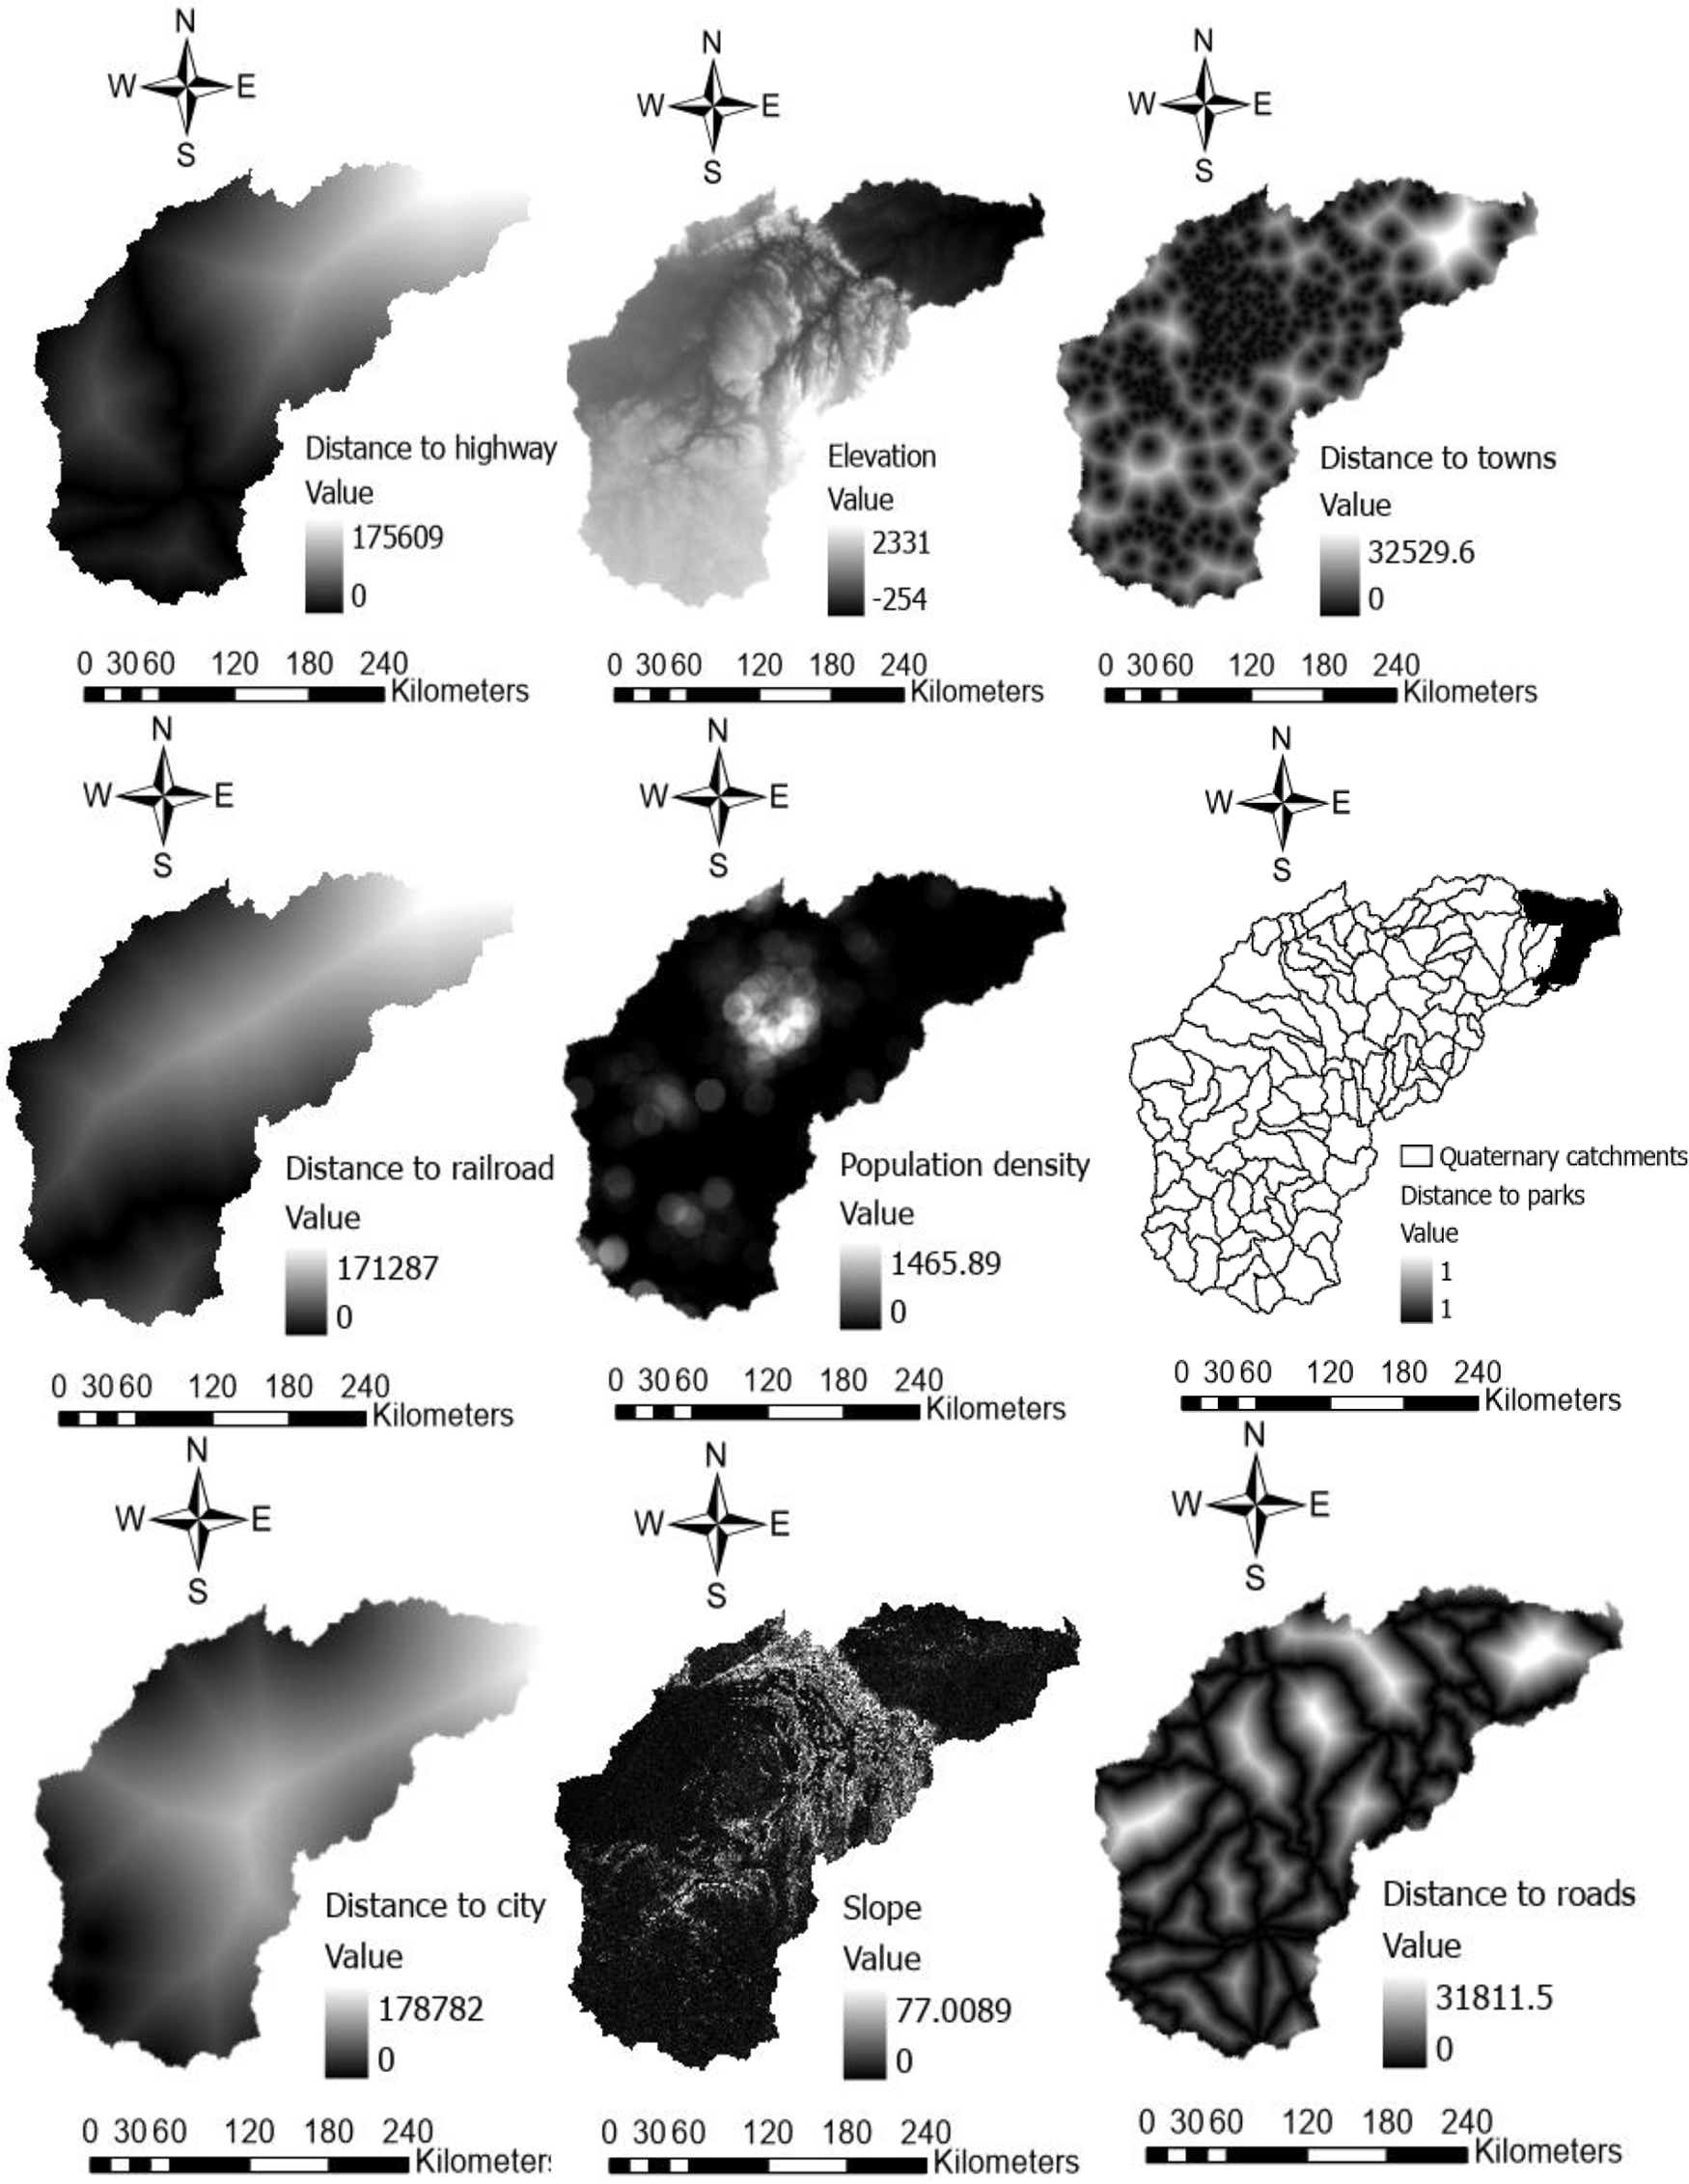
The following procedures were executed to successfully run the LCM model: ArcMap Pro 2.8 was used to extract the 1990, 2013/14 and 2017/18 LRB LULC raster maps using parts of Limpopo, Mpumalanga, and Gauteng Province as the mask dataset. The maps were then reclassified into the classification categories described in Table 1. The objective of reclassification into the seven classes (i.e. no data, natural vegetation, plantations, water bodies, bare land, cultivated land, built-up areas and mine sites) was to simplify the LULC classes and decrease processing time in the modelling. Once the data was obtained, the explanatory variables such as population density maps and restricted area maps e.g., parks were also produced. The reclassify and Con tool in ArcGIS Pro 2.8 was used to reclassify the land cover into seven classes. This tool allows the user to assign new values to each existing pixel value in a raster image. The values can be allocated as ranges or individual values. The Euclidean Distance tool in ArcGIS Pro 2.8 was used to calculate, for each pixel value, the Euclidean distance to the closest feature (road, town, park, railroad etc.). The distances are measured as the shortest line between the pixel and feature. The units are in the projection units of the raster (meters in this case).
The Transition Potentials tab in the LCM module cannot be accessed without first completing and saving the results in the change analysis step. In the change analysis step land cover maps having the same land use classifications of the area in question for two different years (1990 and 2013) were inputted into the model. The model computed the gains and losses between the years for each land use category. Once the gains and losses were computed one could now proceed to the transition potential tab. In the transition potential tab, transitions between the two land cover maps were divided into a set of sub-models where each sub-model was identified with the set of driver or explanatory variables in Figure 3 below. Transition potential maps for each transition were computed as an expression of time-specific potential for change in the form of a 7 × 7 matrix because. The 7 × 7 matrix is simply because the land use map was reclassified into seven land use categories as defined in Table 1 above.3 The Fuzzy facility within the MCE wizard which is also linked to the LCM transformed the driver variables into a standard between one and zero while the Cramer’s V assisted to explore the potential power of each of the driver/explanatory variables. Five dynamic variables (distance to rail, distance to towns, distance to city, distance to roads and population density) and four static variables (Elevation, slope, distance to highway and distance to parks) were added to the model either as static or dynamic components. Static variables are those aspects of basic suitability for the transition under consideration and do not change over time.3 Dynamic variables are drivers such as proximity to existing development or infrastructure which change overtime and are recalculated during a prediction. In LCM each transition was considered and computed as a separate sub-model by default, however, with MLP, multiple transitions can be grouped into a single sub-model if it is considered that they all result from the same underlying driving forces. Only MLP can be used to model multiple transitions in one sub-model.3
All map layers needed to run the LCM were imported in Idrisi from ArcMap. These maps are all raster images. The importation into Idrisi was done by using the import tool in Idrisi by choosing the government-data-provider format. Transition sub-models were created for the individual land use variables to compute the individual transition potential of a land class to another land class. These sub-models were created using the transition sub-model builder hosted within the LCM module by inputting the relevant driver variables which are most likely to precipitate change from one land use category to the other for instance from natural vegetation to Plantation driver variables such as to towns, population density can be used. This driver variables can be either static such as distance to towns or dynamic such as population density. To know which driver variable may be relevant, the Cramer’s V is used to test the explanatory strength of each variable in relation to the land use category. Generally, variables with Cramer’s V of up to 0.15 are useful while those with up to 0.4 are quite excellent. The transition sub-models were used to train the MLP neural network in order to produce an accurate transition potential value. Figure 2 summarises the stepwise modeling procedure for the future land use of the LRB.
The land use data for 1990 was used as the earlier image while 2013/2014 was used as input for the latter image in LCM. A first prediction for 2018 was simulated using CAM but with LCM generated transition areas. The 2017/2018 data from SANLC was used to validate the model by running the KAPPA statistics. Other data such as Euclidean proximities which include distance to road, distance to railroad, distance to city, distance to highway, aspect, elevation, slope percent, population density and distance to parks (restricted areas) were used as explanatory driver variables. The driver variable weather static or dynamic which will influence the change in LULC was determined using Cramer’s-V in the LCM module.
A transition suitability map was generated in the MCE sub-model using the Analytical Hierarchy Process (AHP) which is a method of organising and analysing complex problems by breaking them down into smaller problems in conjunction with MOLA to compute the suitability maps.32 These maps show the extent to which land use categories are able to transition into other land use categories. Maps for the seven classes were generated and merged into a 7-suit map using the collection editor tool. The MCE was fed fuzzy reclassified driving factors and constraints shown in Figure 3 above. The driving factor maps were produced using ArcGIS Pro 2.8 as stated earlier to indicate the shortest distance to the pixel and feature.
A varying number of changes have occurred across the classes of land uses in the LRB between 1990, 2017/2018, and 2040. The charts for the gains and losses for the seven land uses categories are shown in Figure 4. The gains and losses between 1990-2013 show a slower conversion between land use categories compared to the changes between 2013 and 2018 while for 2017-2040 only vegetation category saw great changes.
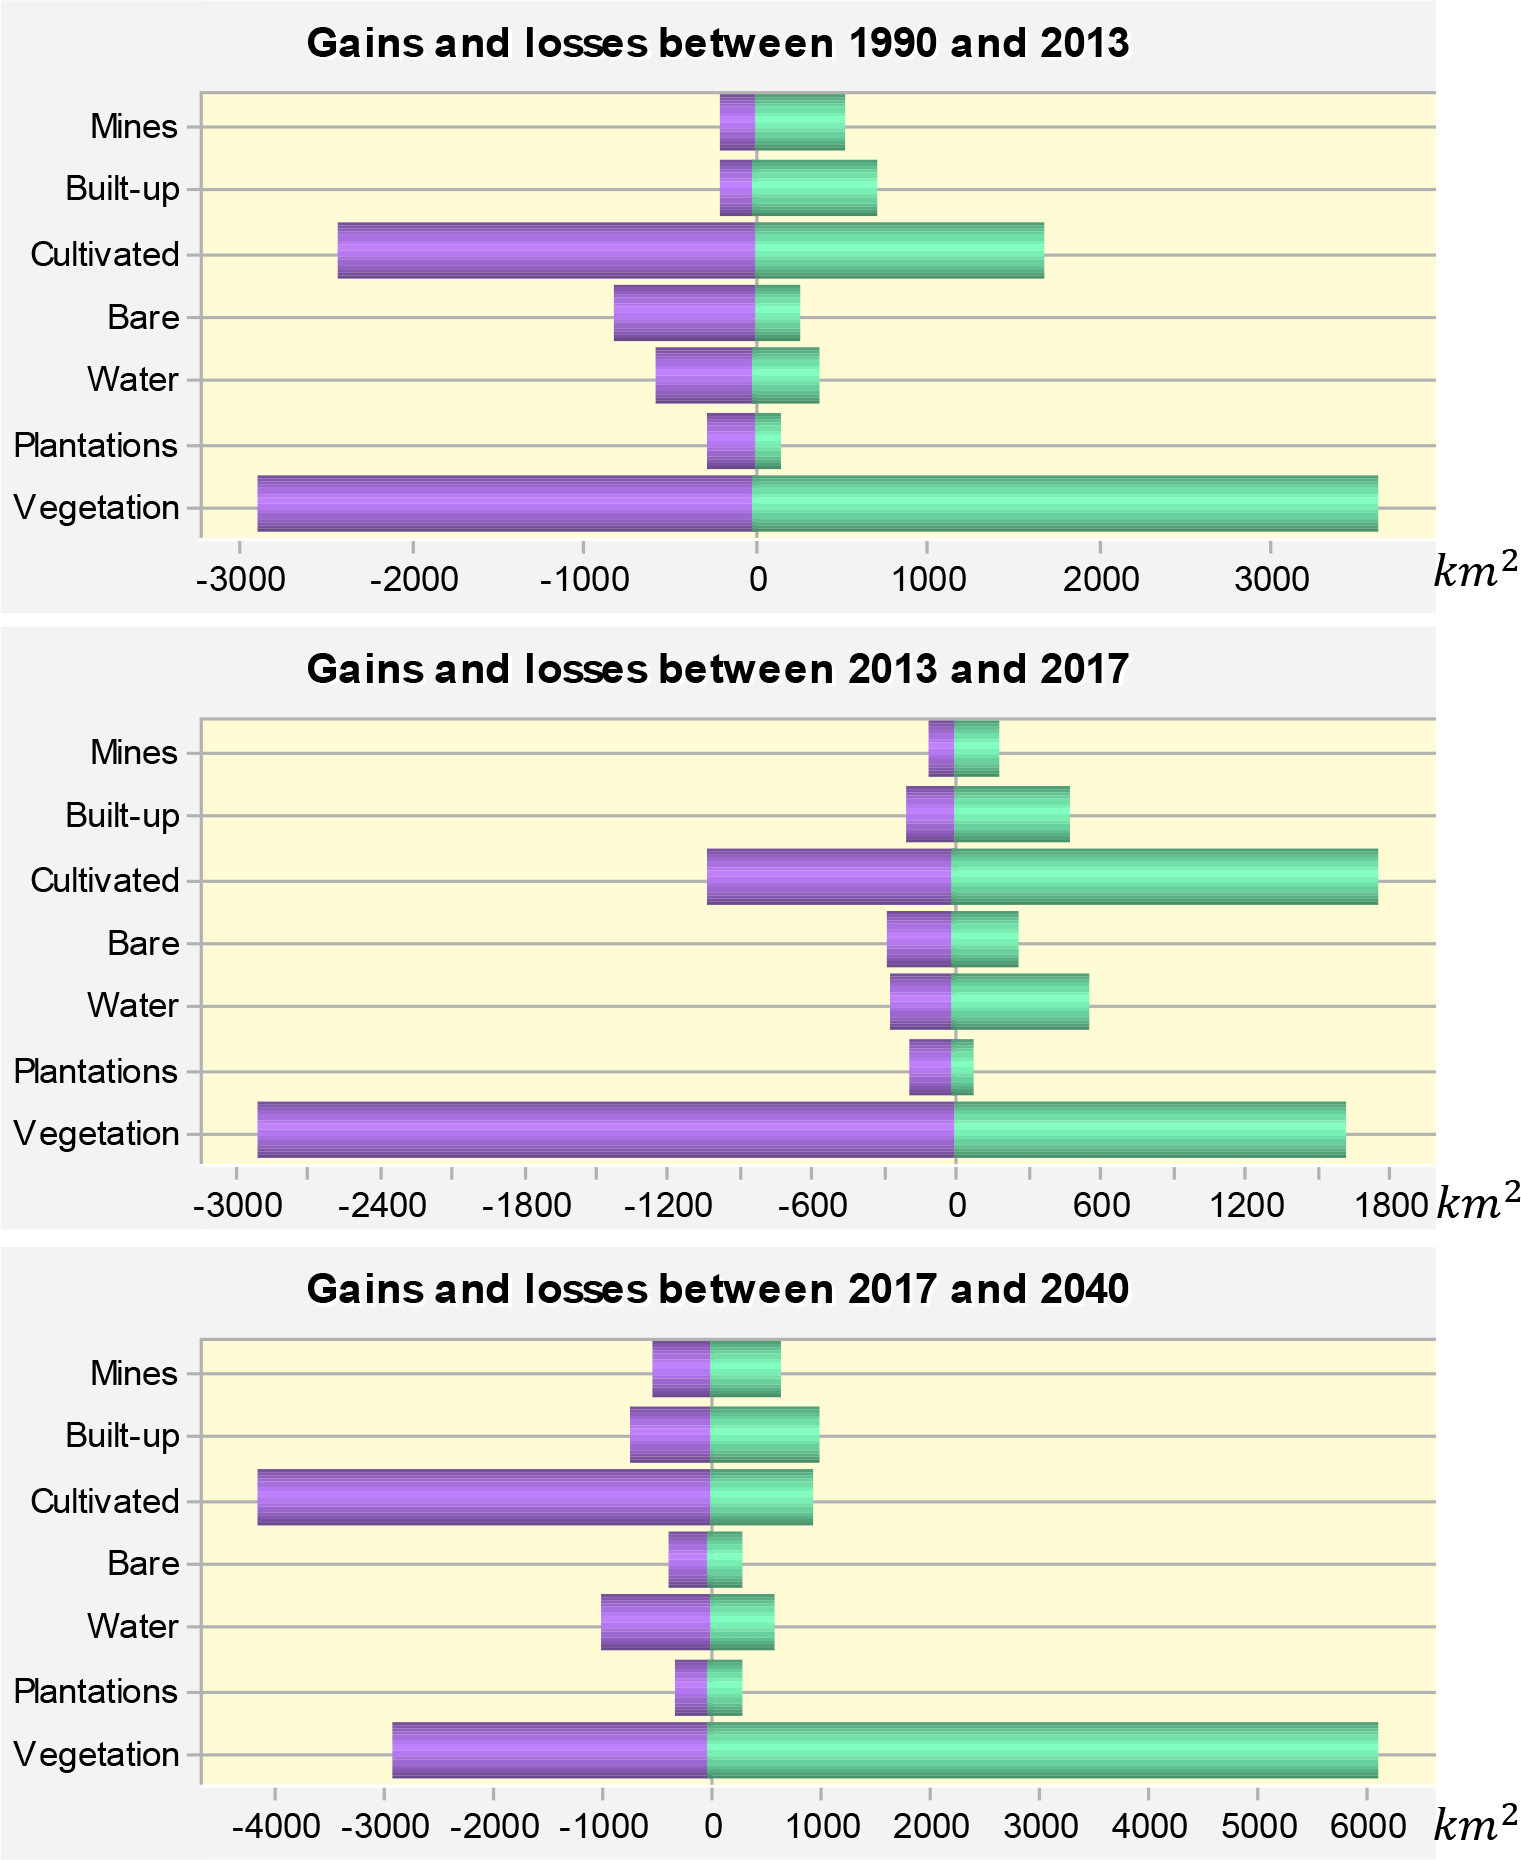
Losses are negative while gains are positive.
Table 2 below shows the transition areas for 2018 which was used as an input parameter for the CAM model simulation. Table 2 is a table 7 × 7 matrix of area categories generated as potentials of LULC to change from one category state to the other e.g., Bare to Plantations is zero meaning no land is allocated for change between these categories from 2013-2018.
Validation was carried out using the KAPPA statistics for the cross-validation between the observed 2018 and simulated 2018 LULC changes as seen in Figure 6. An excellent agreement was achieved with 0.9469 (Overall kappa). 0.9216, 0.9415 and 0.9415.
Once validation was achieved, a predication of future LULC was carried out by first creating transition areas for 2040 and then predicting the 2040 LULC using CAM. The resulting map for 2040 LULC is shown in Figure 5, alongside the 1990, 2013 and 2018 LULC maps. In Figure 6, (Kappa statistics) the 2017 class B represents the 2018 data by Thompson.17

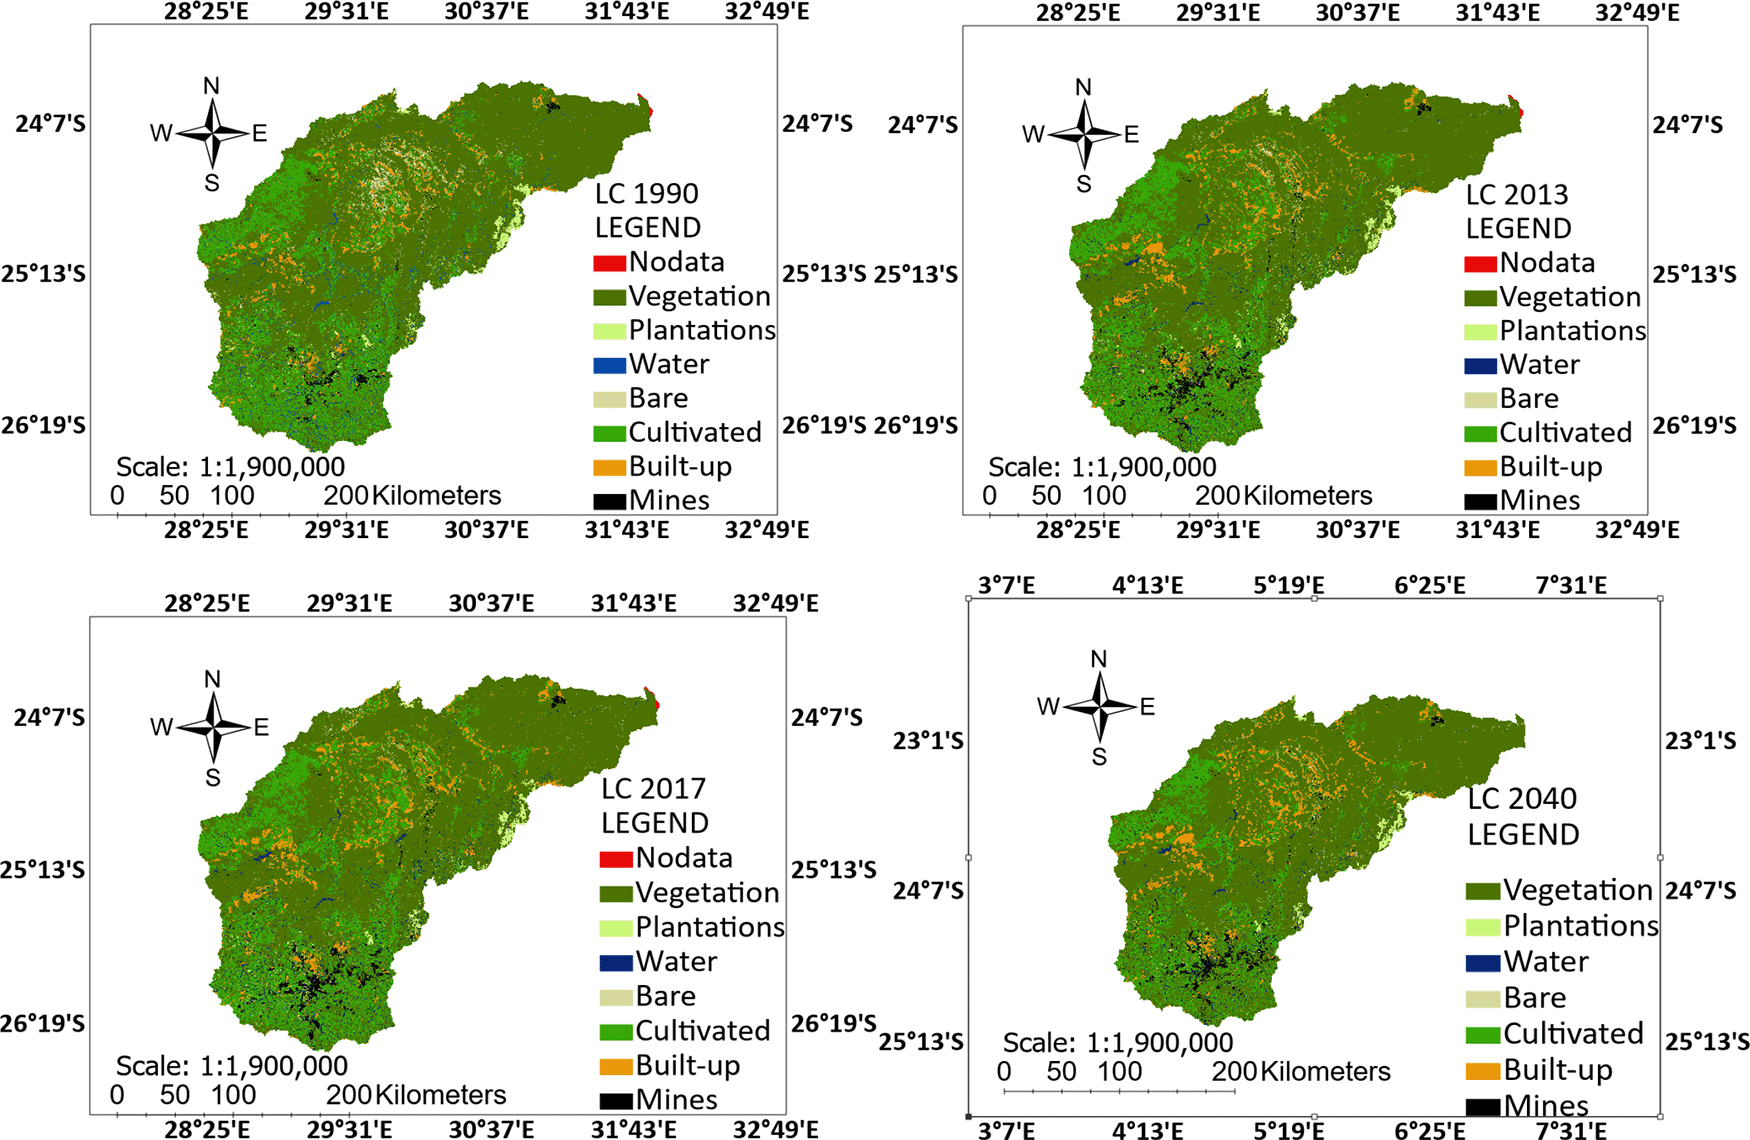
The legends shown in Figure 5 above show which parts of the LRB comprises which land use category. The legend in Figure 5 have been shortened to accommodate the names in the figure but the full names and their aliases are as follows: Vegetation for Natural vegetation, Plantations for Plantations, Water for Water bodies, Bare for Bare land, Cultivated for Cultivated land, Built-up for Built-up areas, and Mines for Mine sites. One can see the changes in land use categories from 1990 to 2040 and the magnitude of these changes have been captured in Figure 4 above.
Table 3 below shows a summary of the percentage differences between the observed and simulated LULC areas for the years 2017/2018 and also shows the new areas of land use for 2040. The percentage difference for the areas are well within the acceptable levels. The highest difference between the 2018 simulated and observed 2018 is +25.4% for 2018 (water) and +31.6% for 2040 (water), which is probably due to some slight error in reflection/refraction angle of water during digitization.33 All other percentage differences are minimal.
From the prediction results for 2040 as seen in the last column of Table 3, more mines will sprout in the LRB by a further 124.5 km2, natural vegetation, and built-up areas will also increase by 3233.1 km2 and 285.3 km2, respectively. Lastly, plantations areas are projected to increase slightly by 19.1 km2. Land used for vegetation, built-up and mines are set to increase, but not significantly, from 2018, while plantations land area, bare ground areas, cultivated land areas, and water bodies will increase.
From the prediction results more mines will sprout in the LRB by a further 124.5 km2, natural vegetation, and built-up areas will also increase by 3233.1 km2 and 285.3 km2, respectively. Lastly, plantations are projected to increase slightly by 19.1 km2.
Once validation was achieved, a predication of future LULC was carried out by first creating transition areas for 2040 and then predicting the 2040 LULC using CAM. The resulting map for 2040 LULC is shown in Figure 6, alongside the 1990, 2013 and 2018 LULC maps. In Figure 6, the 2017 class B represents the 2018 data by Thompson.17
The Lepelle River Basin has always been a mining area and hence it is often seen as the ‘powerhouse’ of South Africa. Eskom has nine major coal-fired facilities in the catchment. A percentage of the coal for these power generators comes from parts of the LRB as well.34 The diverse population groups living in the LRB and along the river in Mozambique all rely on the resources and services that the complex ecosystem in the LRB provides. The life-giving, livelihood-sustaining natural resources of the LRB and its associated ecological services are under threat. Unchecked pollution, inappropriate land resource use, weak and poorly enforced policies and regulations, and poor protection of habitats and biodiversity are degrading the LRB at an alarming rate. Factors such as mining of heavy metals, inappropriate land management, urban sprawl and unsustainable use of natural resources all affect the level of resources and services the ecosystem can provide.
It is therefore important to be able to predict for planning purposes the LULC for the future LRB. Hence the prediction for 2040 was carried out based on the assumption that the rate of change in the catchment will follow the same pattern in history into the next 18 years. Vegetation and built-up areas are projected to increase as seen in the result section. These increases in vegetation could be due to used up abandoned mines and lands rendered unusable due to mining activities as well as less cultivation. Water bodies in the region are projected to dwindle by 420.6 km2 while bare land and cultivated land areas are also on the decrease by 74 km2 and 3175.1 km2, respectively, these were computed from Table 3 (differences between column 2 and column 6). These could be because of several factors such as increasing population, increasing mining activities and conversion of bare lands to built-up areas, which consequently is on the rise as job opportunities increase due to the increase in mining activities observed from the increase in areas being mined.
This study employed the 2018 LULC classes data derived using spectrally based modelling from Sentinel-2 spectral image as well as the South Africa 1990 and 2013/2014 data. These spectrally defined land-cover classes were used for both calibration and validation of the model as well as a base map for simulating into the future. Cellular Automata Markov was used to simulate the 2018 LULC for the LRB using the transition areas for 2018 generated by the LCM from machine learning process of MLP ANN. This simulation was carried out as a validation process since the observed 2017/2018 LULC were available. The overall validation Kappa (0.9469) was excellent. After the validation was achieved LULC for 2040 was successfully predicted using the same CAM. From the 2040 simulation, it is seen that built-up areas as well as areas being mined and plantation areas will increase slightly while natural vegetation increases quite considerably due to used up abandoned mines and less cultivation. The reduce in cultivated areas could mean less cultivation activities perhaps due to inhabitants taking on mining jobs and other formal jobs than farming. The result reveals an array of losses and gains for certain LULC classes in the LRB by 2040: natural vegetation (gain 8.5%), plantations (gain 3.5%), water bodies (loss 31.6%), bare ground (loss 8.8%), cultivated land (loss 29.3%), built-up areas (gain 10.6%) and mines (gain 14.4%). These results indicate the conversion of land use from natural to anthropogenic use by 2040. These changes flag concerning losses associated with ecosystem resources such as water which will destructively impact human wellbeing in the LRB and other areas of the country by exacerbating water scarcity alongside climate change. The model was validated and serves as an auxiliary decision support tool for the establishment of sustainable land resource utilization policies and an early warning system for negative LULC change detection in the LRB.
South African National Biodiversity Institute (SANBI) 1990 and 2013-2014 datasets, and the South African National Land-Cover (SANLC) 2018 dataset are freely available from the GIS Data Downloads website from the Department of Forestry, Fisheries and the Environment (DFFE), Republic of South Africa: https://egis.environment.gov.za/data_egis/data_download/current. This is because the SANBI data formerly found on http://biodiversityadvisor.sanbi.org/online-biodiversity-data/ were migrated to the DFFE website.
| Views | Downloads | |
|---|---|---|
| F1000Research | - | - |
|
PubMed Central
Data from PMC are received and updated monthly.
|
- | - |
Provide sufficient details of any financial or non-financial competing interests to enable users to assess whether your comments might lead a reasonable person to question your impartiality. Consider the following examples, but note that this is not an exhaustive list:
Sign up for content alerts and receive a weekly or monthly email with all newly published articles
Already registered? Sign in
The email address should be the one you originally registered with F1000.
You registered with F1000 via Google, so we cannot reset your password.
To sign in, please click here.
If you still need help with your Google account password, please click here.
You registered with F1000 via Facebook, so we cannot reset your password.
To sign in, please click here.
If you still need help with your Facebook account password, please click here.
If your email address is registered with us, we will email you instructions to reset your password.
If you think you should have received this email but it has not arrived, please check your spam filters and/or contact for further assistance.
Comments on this article Comments (0)