Keywords
lightning, air temperature, relative humidity, COVID-19, thunderstorm
This article is included in the Research Synergy Foundation gateway.
lightning, air temperature, relative humidity, COVID-19, thunderstorm
Literature review has been enhanced with the inclusion of the most recent relevant references based on the recommendation by the reviewers.
Clarity of the meaning of the "mean" value in Table 5 and the "plotted points" in Figures 2,3,5 and 6 have been enhanced.
Results section has been renamed to "Results and Discussion".
See the authors' detailed response to the review by Wooi Chin Leong
See the authors' detailed response to the review by Francisco Javier Pérez Invernón
Many countries have enforced lockdown since the beginning of the COVID-19 pandemic.1-3 Energy-intensive human activities such as travelling and the hospitality sector were drastically reduced resulting in reduced emissions of greenhouse gases.4 The global emission is estimated to drop by 8.8% (−1551 Mt) in the first half-year of 2020 compared to the same period in 2019. Moreover, almost 18% of emissions in recent years were produced from ground transportation.5
With the exception of the preliminary findings by Jones et al.,6 the general expectation by researchers is that the trend of temperature is expected to be reduced due to the reduction in CO2. A significant positive correlation between the atmospheric temperature and emission is reported in.7 Furthermore, COVID-19 lockdown has caused micro-climate changes such as localized variations in air temperature and relative humidity.8 The pandemic is also having an effect on , causing a decline that could possibly lead to short-term cooling.9 Air humidity will also be affected as global warming are dependent on both temperature and humidity.10 This reduction in human activities could also result in drop in aerosol level globally. This reduction in human activities could also result in drop in aerosol level globally. The result of lockdown has disrupted human and industrial activities around the world. The lockdown generally leads to a notable change in carbon dioxide (CO2), temperature, and humidity. However, the reduction in human activities may reduce greenhouse gases and may result in a drop in global temperature. The study by Singh et al. found that implementation of lockdown reduced the percentage of temperature and may mitigate the pace of climate change in the future.8
Lightning, a natural atmospheric discharge, is affected by various environmental factors. Lightning brings about hazards to human life and appropriate risk assessment has to be conducted for any habitable structure.11,12 Atmospheric variables such as climate change, humidity, aerosol level, and wind motion can affect the cloud charge distribution, electric field and threshold electromagnetic fields that give rise to air breakdown. It is predicted that lightning may strike more frequently as a result of the ongoing climate change.13 The lightning intensity may also increase due to the high greenhouse gases in the atmosphere. However, study by Finney et al. stated that many previous studies found a positive correlation between lightning and temperature, and one previous study that found lightning decreases with an increase in temperature.14 This may explain that such relationships become highly uncertain on longer timescales. When warm, wet air rises into the cold air, thunderstorms form. As the warm air cools, moisture in the form of water vapour condenses into water droplets, a process known as condensation. Cooled air descends through the atmosphere, warms up, and rises again. A convection cell is a circuit of rising and descending air. A cloud will form if this happens in a small amount. A thunderstorm can arise if this happens with a lot of air and moisture. The presence of high air temperature and high relative humidity can quickly rise and cause powerful updrafts. These updrafts carried water droplets and quickly froze and collided with ice crystals and graupel, causing the charge transfer process.
Lightning could also be triggered by aerosols released by industrial processes and transportation activities.15,16 Aerosol could affect lightning activity through modification of cloud micro-physics. Aerosol particles serve as cloud condensation nuclei and ice nuclei, and the amount of this particles could affect the formation of cloud droplets and ice particles. More aerosol will suppress the coalescence and making the average size of cloud droplet to be reduced as well as inhibiting precipitation. Therefore, the process enables the water droplets to rise further to upper layers of the clouds and may enhance the lightning processes. During the lockdown period, many industrial sectors stopped operating. Thus, human activities have considerably reduced during the COVID-19 pandemic which may affect the rate of lightning. Lightning ground flash density tends to increase with drier and warmer surface air.17 Furthermore, the frequency of thunderstorms shows a major peak during summer time.19 Previous studies have also found a strong relationship between relative humidity and lightning occurrence.19,20 Studies from Pinto Neto et al.,21 and Perez-Invernon et al.,22 found lightning intensity decreased drastically during lockdown period compared to previous year. This is due to the average value of aerosol which played a major role in lightning events have dropped significantly during lockdown period. Last but not least, Chowduri et al. also concurred that the reduction in particulate matter and aerosol concentration bears strong correlation with the reduction in lightning activity in Kolkata during the COVID-19 lockdown.23
Hence, it is of interest to investigate the correlation between the environmental changes that happened during the period of COVID-19 related restriction of human activities and the lightning occurrence density. This study is an attempt to analyse this situation. This study investigates the trend of five months of lightning occurring from March to July in 2020 compared with the same period (March-July) in 2015-2019 in Europe and Oceania. The outcomes of this work could yield interesting insights into the correlation between human activities and lightning frequency.
Lightning stroke counts (LSC) and two atmospheric factors namely air temperature and relative humidity are considered as the variables in this study. The relationship between LSC with respect to air temperature and relative humidity will be statistically analysed via the dependent t-test and Pearson correlational studies.
From March until July in Europe and Oceania, the total LSC from the year 2015 to 2020 were extracted from LightningMaps.org.24 LightningMaps.org provides historical data of LSC and has been widely used in previous studies.25,26 The distribution of LSC data is presented in Tables 1 and 2.
The air temperature and relative humidity data from March until July in Europe and Oceania from year 2020 are extracted from the Physical Sciences Laboratory using Panoply Version 4.12.0.27 Europe is divided into seven sub-regions such as North Europe, West Europe, Central Europe, East Europe, South Europe, Southeast Europe, and the British Isles. After that, eight points (57.5°N, 10.0°E; 42.5°N, 12.5°E; 50.0°N, 25.0°E; 50.0°N, 5.0°E; 50.0°N, 10.0°E; 50.0°N, 20.0°E; 52.5°N, 0.0°; 42.5°N, 22.5°E) of around the sub-regions of Europe were selected in this study. For the Oceania region, five points (−12.5°N, 132.5°E; −37.5°N, 142.5°E; −27.5°N, 152.5°E; −30.0°N, 115.0°E; −27.5°N, 135.0°E) covering the North, South, East and West of Australia; Three points (−37.5°N, 175°E; −45.0°N, 167.5°E; −42.5°N, 170.0°E) covering the North, South and Centre of New Zealand; one point (−10.0°N, 147.5°E) from Papua were considered. Tables 3 and 4 show the average value of air temperature and relative humidity in Europe and Oceania in year 2020.
A dependent t-test is was conducted using Microsoft Excel 2016 (Microsoft Excel, RRID:SCR_016137) to determine whether there is a statistically significant difference between the LSC during the lockdown period in the year 2020 and the LSC in the same period (March-July) in year 2015 until 2019. The LSC is measured from a single population (Europe or Oceania) and two different timelines (before and during). Period A represents the lightning activities before lockdown period i.e. March to July in year 2015 to 2019. Period B represents the lightning activities during the lockdown i.e. March to July in the year 2020.
The t-test is conducted by comparing the data from Period B and Period A. The null hypothesis, and the alternative hypothesis, is defined as below:
H0: There is no significant difference in lightning frequency in between Period A and Period B.
Ha: There is a significant difference in lightning frequency in between Period A and Period B.
The confidence level of 95% at a significant level, is used. This approach tests the hypothesis and calculates the probability of determining whether there is evidence to reject the null hypothesis. When the P value < 0.05, the null hypothesis is rejected, and vice versa.
Next, the Pearson correlation coefficient is used to evaluate the correlation between the frequency of lightning activities with the atmospheric changes. The Pearson’s correlation coefficient, r, is computed to measure the strength of the relationship between total lightning strikes, air temperature, and relative humidity in Period B.
Furthermore, the correlation between the variables was analysed using regression and correlation analyses. The significant level, P value can be obtained from the regression data analysis. The null hypothesis, and the alternative hypothesis, is defined as below:
Null hypothesis, H0: P = 0, There is no significant relationship between lightning strikes with air temperature or relative humidity.
Alternative hypothesis, HA: P ≠ 0, There is a significant relationship between lightning strikes with air temperature or relative humidity
By using the P-value method (), the decision on rejection or acceptance of the null hypothesis can be made. There is sufficient evidence to conclude that there is a significant correlation between lightning strikes and air temperature or relative humidity as the correlation coefficient is significantly different from zero. Exact P values and the mean value of lightning strikes from May to July are provided in Table 5.
Figure 1 shows the LSC has dropped significantly in the year 2020 when the lockdown started. The dependent t-test shows a statistically significant (P-value <0.05) difference between 2020 and each previous year as shown in Table 5. Notably, LSC in Europe during the five-month lockdown period were reduced by more than 50% compared to the same period in the year 2019, 2018, and 2017.
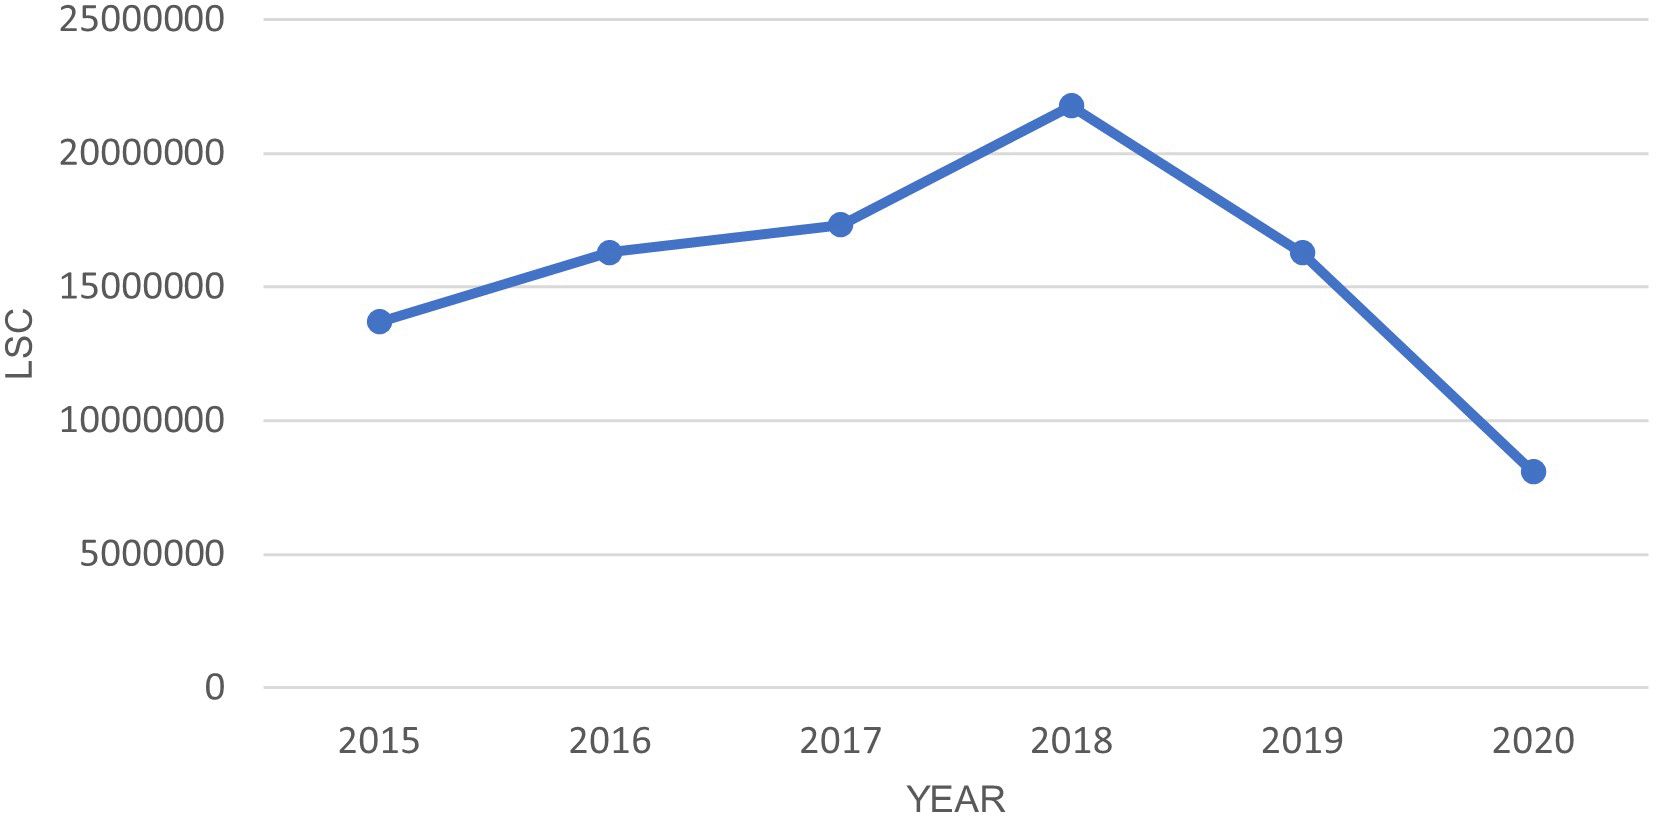
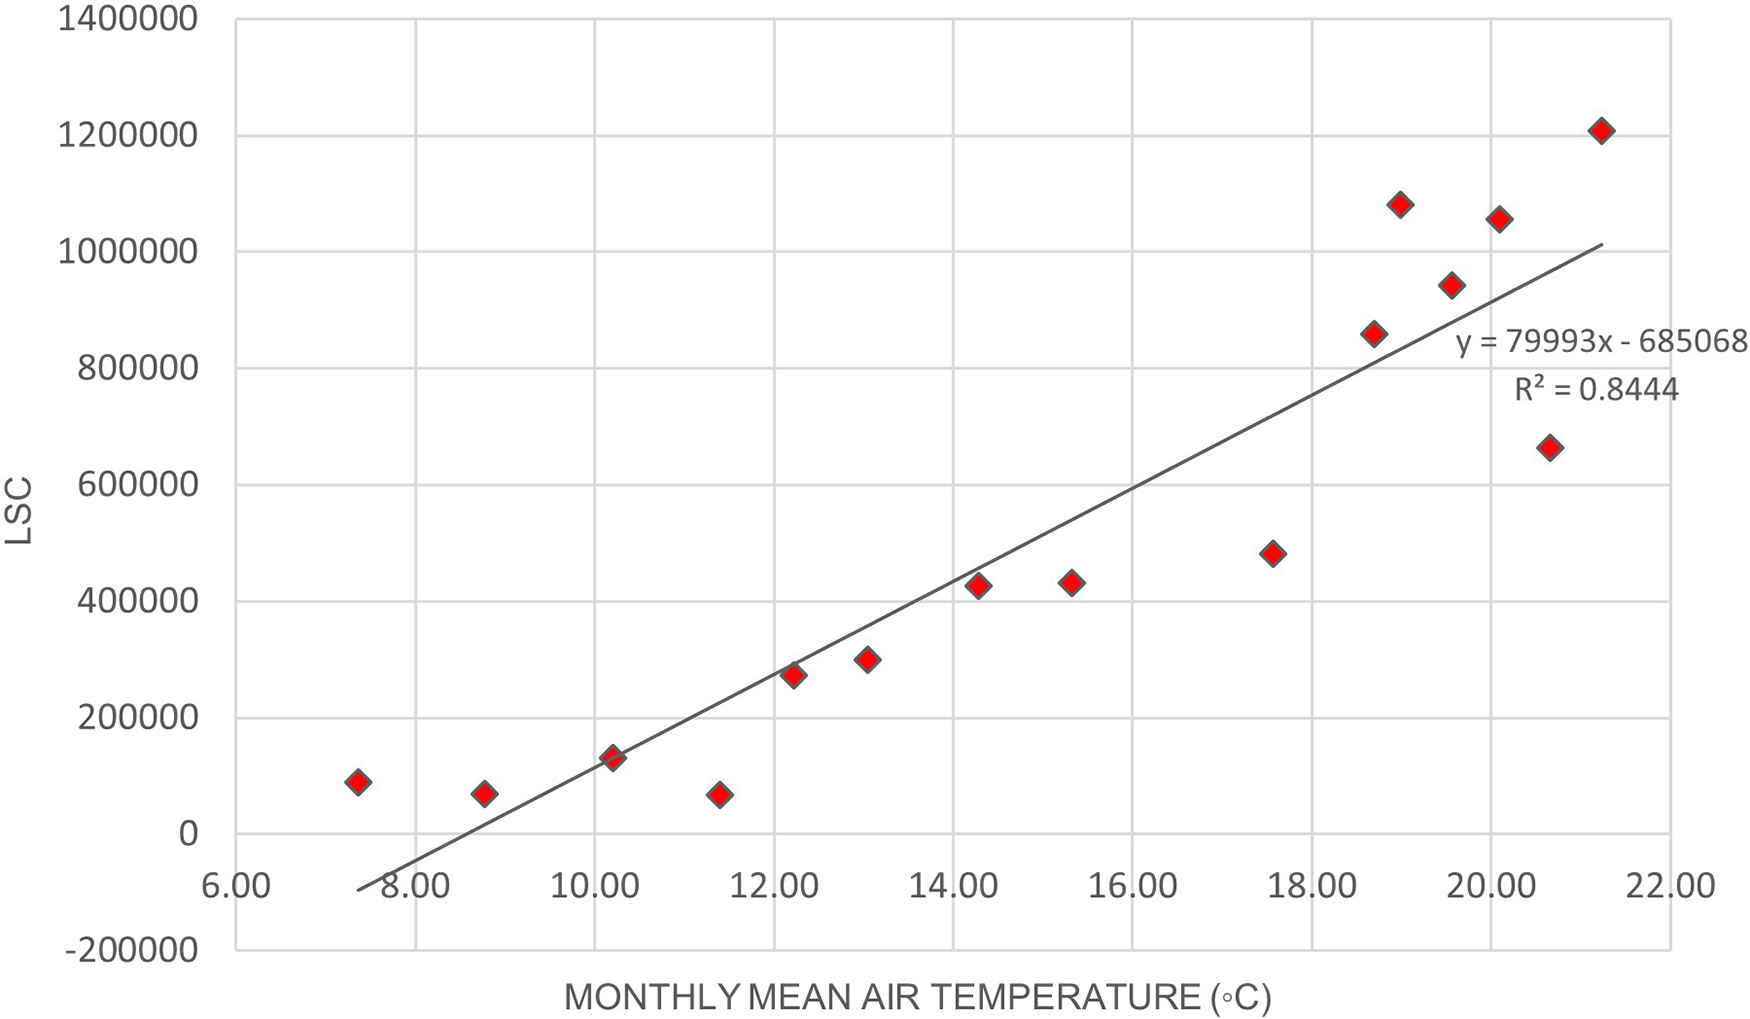
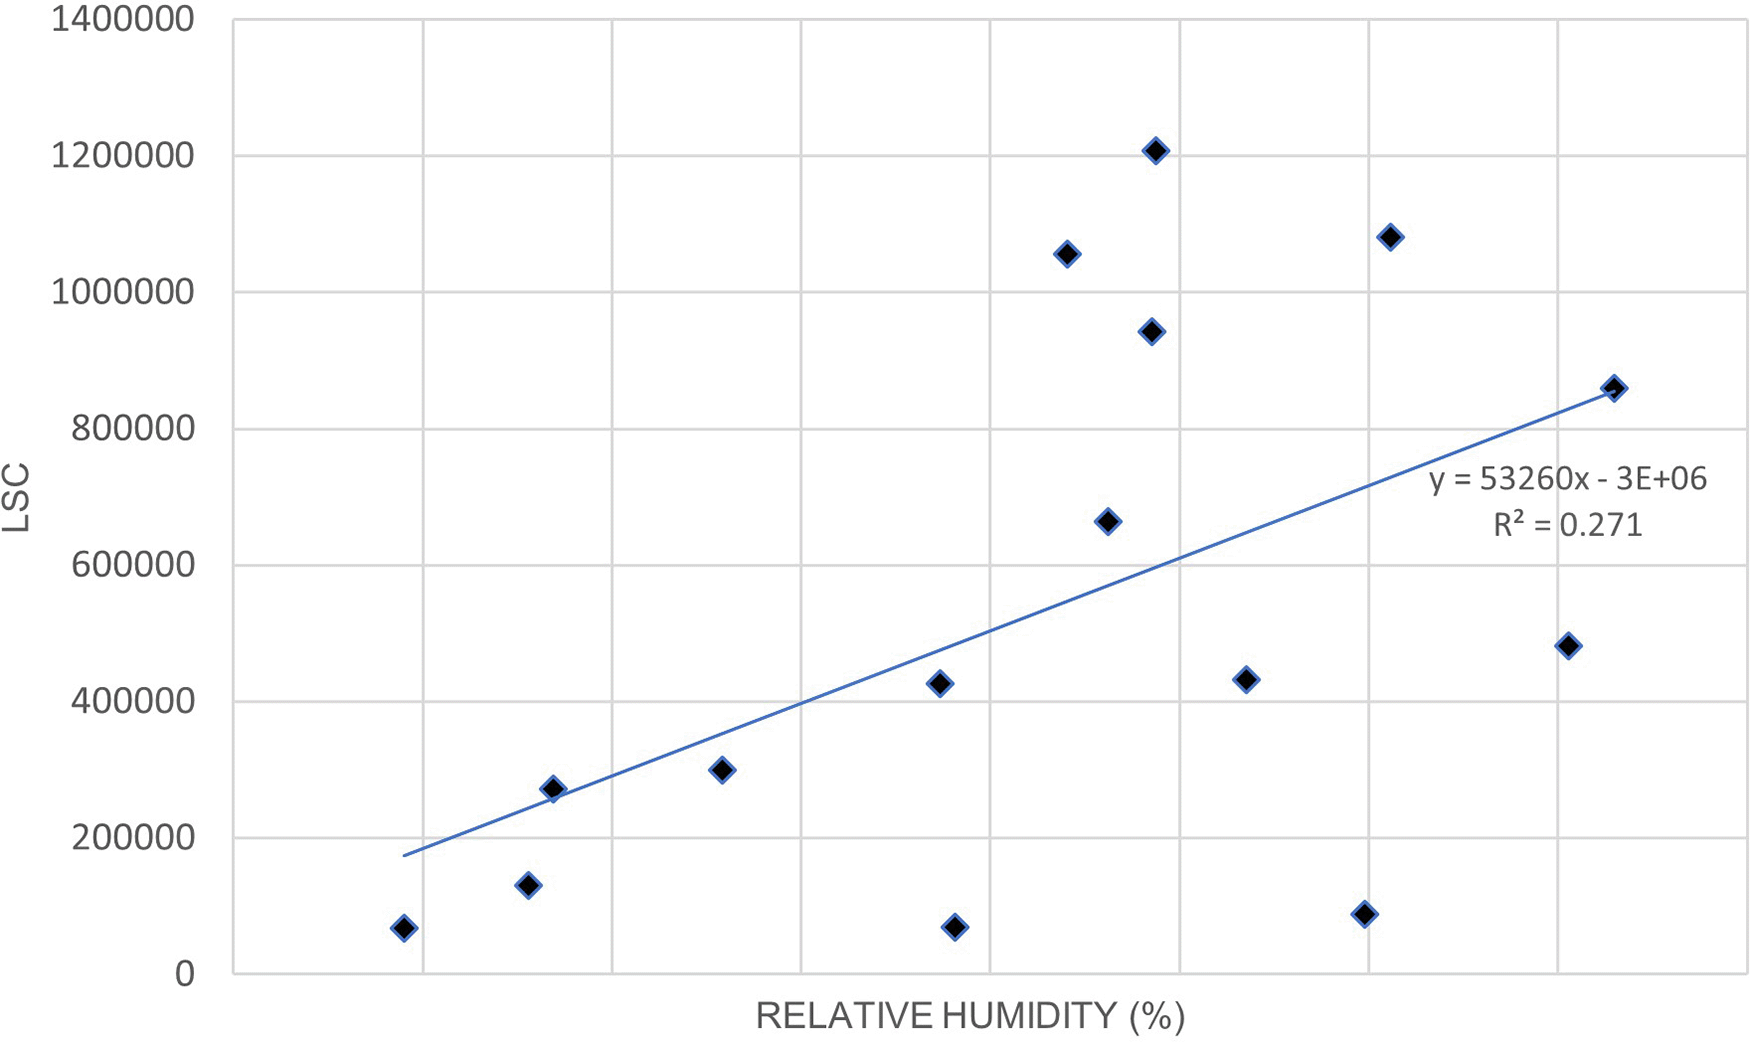
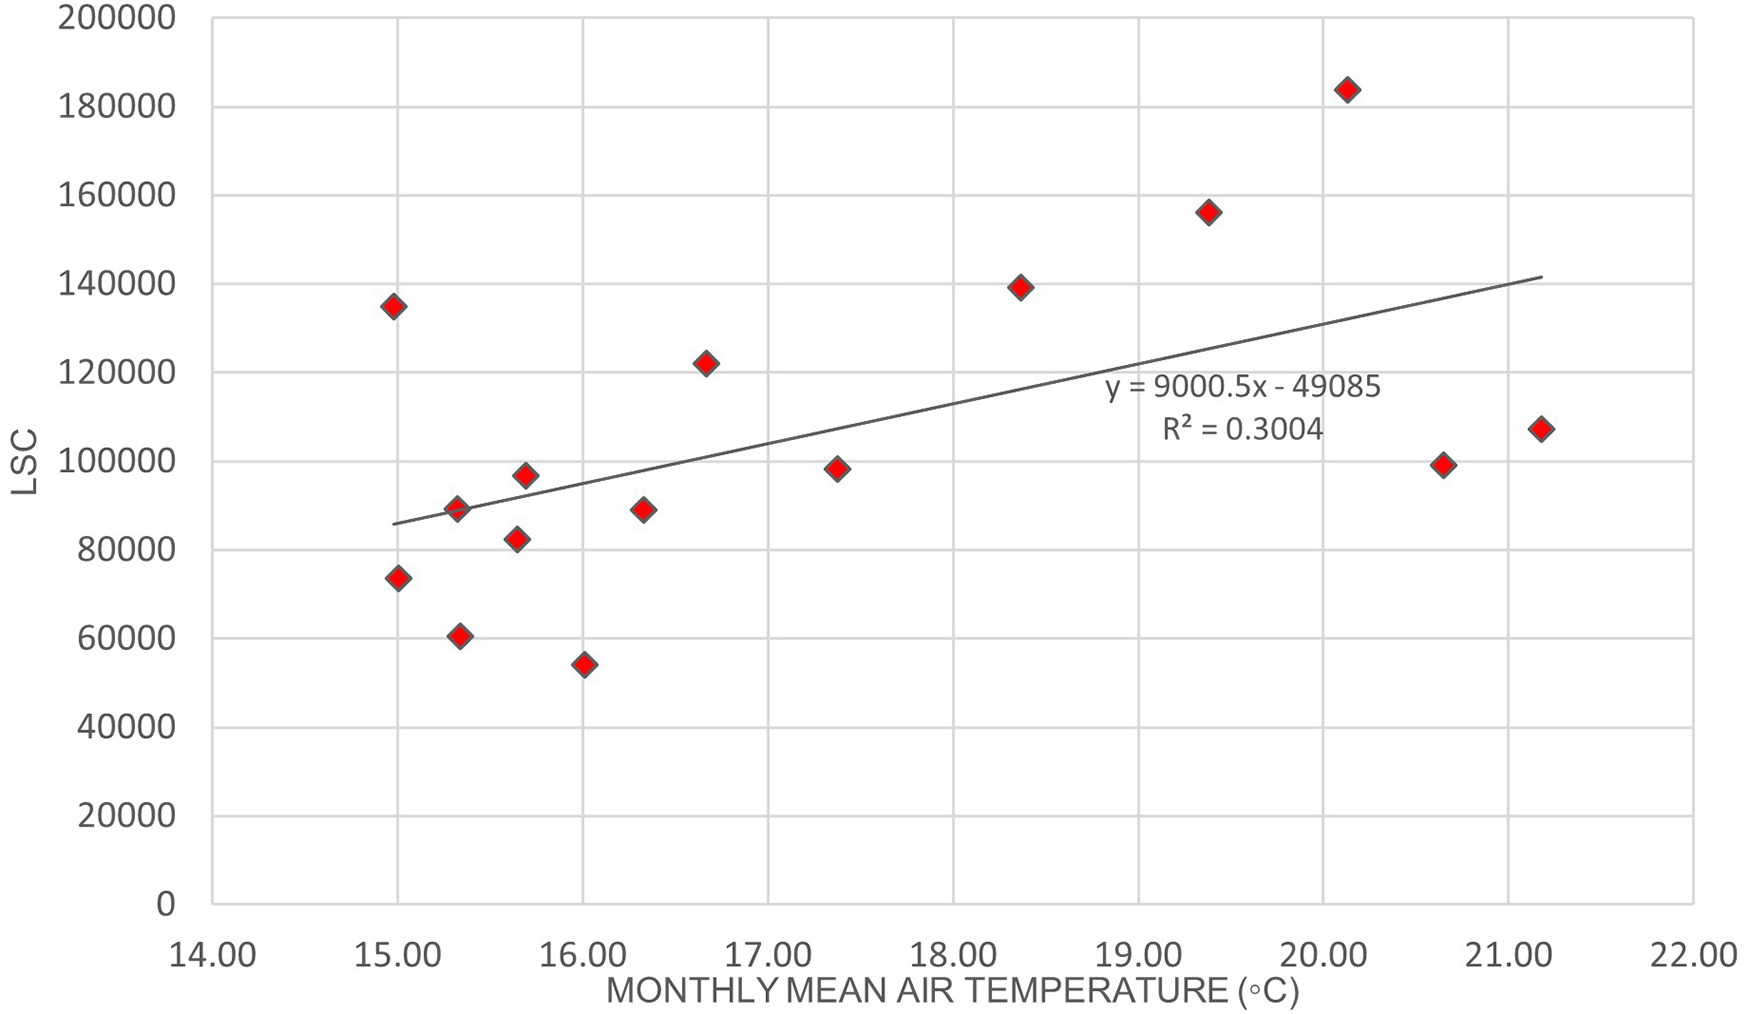
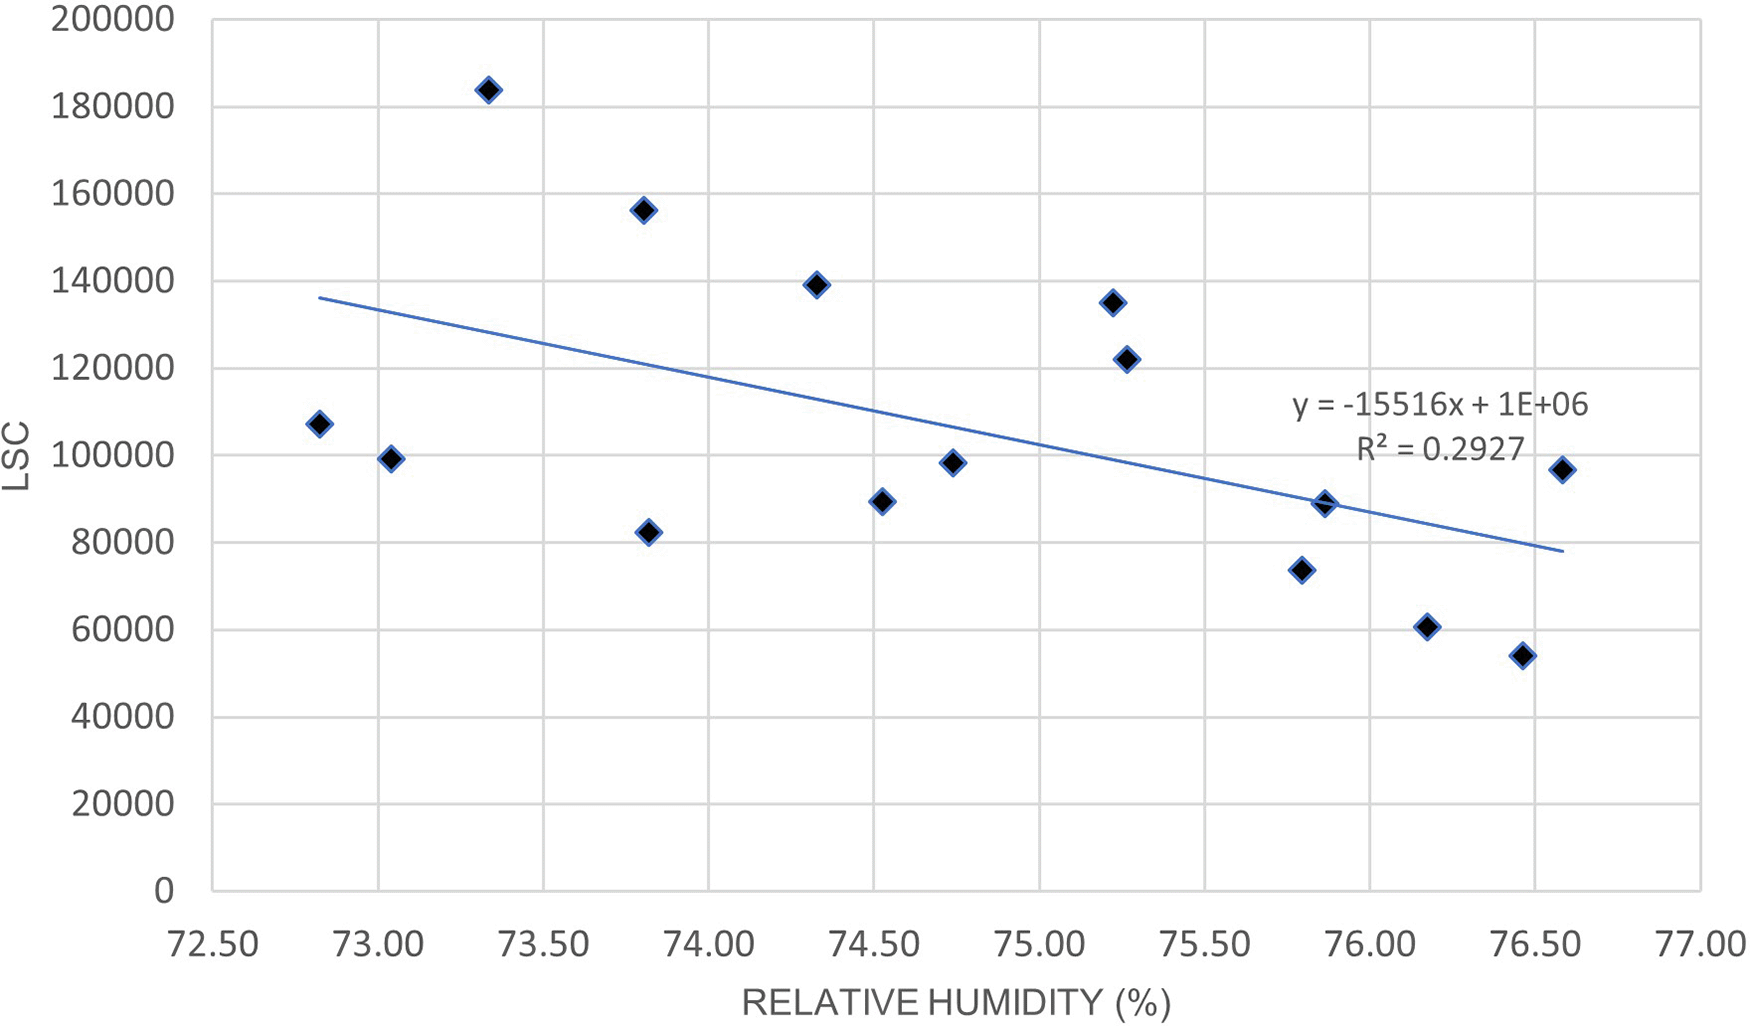
Figure 2 illustrates the variation of LSC against air temperature levels in Europe. Figure 3. illustrates the relationship between LSC and relative humidity in Europe. Table 6 shows that the correlation of lightning strikes with air temperature and relative humidity in Europe are statistically significant. The Pearson correlation between lightning strikes and air temperature is 0.92, indicating a strong positive relationship between the variables. Pearson correlation between LSC and relative humidity is 0.52, indicating a moderate positive relationship between the variables. Higher relative humidity may enhance the upward updraft and easing the particle collision in the cloud. On the other hand, lower relative humidity may lead to weaker updraft and decreased the chance of lightning occurrence. The positive correlation between lightning strikes with air temperature and relative humidity in Europe concurs with the findings of.17,19,20,28,29
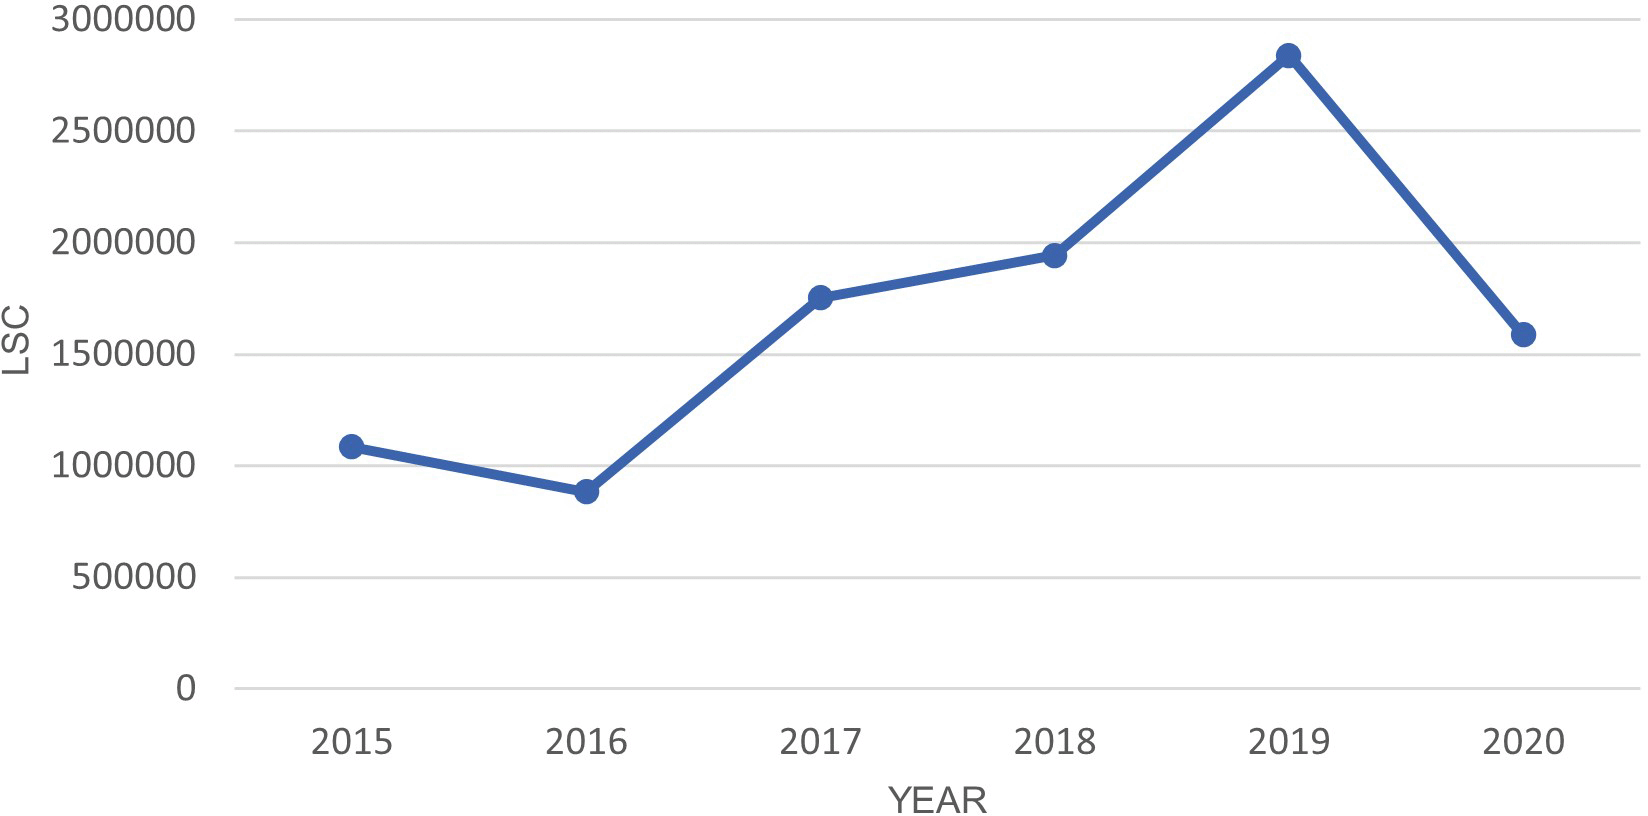
There was a 44% drop in LSC from 2019 to 2020 as shown in Figure 4. Table 7 shows there is statistically significant difference between the year 2020 with all previous years except 2017. Figure 5 and Table 8 indicates a moderate positive correlation between LSC and air temperature in Oceania during the lockdown period. Unlike Europe, Figure 6 and Table 8 shows that the relationship between LSC and relative humidity in Oceania is negatively correlated. The positive correlation of LSC and air temperature is consistent with previous studies.28,29 The negative correlation of LSC and relative humidity in Oceania obtained in this study contradicted the study of Shi et al.20
| Correlation coefficient, R | P-value | Correlation strength | |
|---|---|---|---|
| Air temperature | 0.55 | .034 | Moderate |
| Relative humidity | −0.54 | .037 | Moderate |
In conclusion, there was a drastic drop in LSC in Europe and Oceania during the first lockdown period in 2020. A dependent t-test confirmed that a statistically significant difference in LSC between Period A and Period B. There is a positive relationship between LSC and air temperature in Europe (r = 0.92) and Oceania (r = 0.55). Furthermore, there is a positive relationship between LSC and relative humidity in Europe (r = 0.52) but a negative relationship between LSC and relative humidity in Oceania (r = −0.54).
The difference in correlation findings between lightning and relative humidity in Europe and Oceania remains unexplained. Higher relative humidity will lead to stronger updraft and increased lightning occurrence. However, too much vapor may weaken the updraft by blocking the vapor to rise up to complete the phase transformation.
The differences in correlation between lightning, air temperature, and relative humidity in Europe and Oceania may also be due to other possible factors such as aerosol level, wind motions, and particulate matter. Future work should be replicated in other geographical regions such as America and Asia.
Fazandra Y: Conceptualization, Formal Analysis, Methodology, Writing – Original Draft Preparation, Writing – Review & Editing;
Siow C.L.: Conceptualization, Supervision, Writing – Review & Editing
Chandima G.: Conceptualization, Writing – Review & Editing
Aravind C.: Methodology, Validation
Lee C.P.: Validation, Supervision
| Views | Downloads | |
|---|---|---|
| F1000Research | - | - |
|
PubMed Central
Data from PMC are received and updated monthly.
|
- | - |
Provide sufficient details of any financial or non-financial competing interests to enable users to assess whether your comments might lead a reasonable person to question your impartiality. Consider the following examples, but note that this is not an exhaustive list:
Sign up for content alerts and receive a weekly or monthly email with all newly published articles
Already registered? Sign in
The email address should be the one you originally registered with F1000.
You registered with F1000 via Google, so we cannot reset your password.
To sign in, please click here.
If you still need help with your Google account password, please click here.
You registered with F1000 via Facebook, so we cannot reset your password.
To sign in, please click here.
If you still need help with your Facebook account password, please click here.
If your email address is registered with us, we will email you instructions to reset your password.
If you think you should have received this email but it has not arrived, please check your spam filters and/or contact for further assistance.
Comments on this article Comments (0)