Keywords
COVID-19, low-income households, economic stimulus package, customisation, data analytics, machine learning, Gradient Boosted Tree
This article is included in the Artificial Intelligence and Machine Learning gateway.
This article is included in the Research Synergy Foundation gateway.
COVID-19, low-income households, economic stimulus package, customisation, data analytics, machine learning, Gradient Boosted Tree
The novel coronavirus 2019 (COVID-19) pandemic has created devastation in people’s lives worldwide, both socially and economically (Shah et al., 2020). As a result, governments have adopted various strategies aimed at reducing the pandemic’s impact, particularly the financial strain. The Malaysian government has introduced a series of economic stimulus packages to support various segments of its citizens. One such support is the Prihatin Rakyat Economic Stimulus Package (ESP) to cushion the impact of COVID-19 on low-income households after the first movement control in the country. The ESP consists of cash assistance, utility discount, moratorium, Employee Provident Fund and Private Remuneration Scheme (EPF and PRS) cash withdrawals and Credit Guarantee Scheme and Wage subsidies (Flanders et al., 2020). Following the implementation of ESP, the Department of Statistics Malaysia (DOSM) carried out a special survey from April 10 to April 24,2020 to better understand the implications of COVID-19 on the economy and households. The study included questions on social and economic factors and subsidy preferences.
A typical low-income household often bears considerable debt and has limited savings. When movement control was implemented, households that lost their income sources faced difficulties in accessing necessities, such as food and housing (Flanders et al., 2020). Even though the government offered ESP to help residents cope financially, the demands and desires of citizens in the event of a pandemic are unknown. For example, several households are reluctant to withdraw from EPF and PRS due to its reduction on their savings for old age. A personalised ESP can be built to reduce residents’ financial burden in this crisis if we can foresee their requirements and preferences for various subsidies, such as cash allowance, utility discount, moratorium or EPF and PRS withdrawals. Using data analytics and machine learning approaches, this study attempted to analyse survey data and construct predictive models for customised economic stimulus packages. The following research questions were put forward.
1. Can we develop a general profile of households who prefer moratorium subsidies?
2. Can we develop a general profile of households who prefer utility discount subsidies?
3. Can we develop a general profile of households who prefer EPF and PRS withdrawals?
This study contributes to the literature by using four machine learning techniques on socioeconomic survey data and predicting household subsidy preferences. A comparison of the feature selection methods, such as Gini index, Gain–Ratio and various partitioning ratios of the training and test data sets were carried out. The outcomes of this study can help the government deliver better and improved stimulus packages in the future based on individual preferences.
For planning and execution, this study used the Cross-Industry Standard Process-Data Mining (CRISP-DM), which is the industry-independent de-facto standard for implementing data mining initiatives (Schröer et al., 2021). This process has six phases, namely, business understanding, data understanding, data preparation, modelling, evaluation and deployment. Figure 1 depicts the activities carried out in each phase, as further explained below.
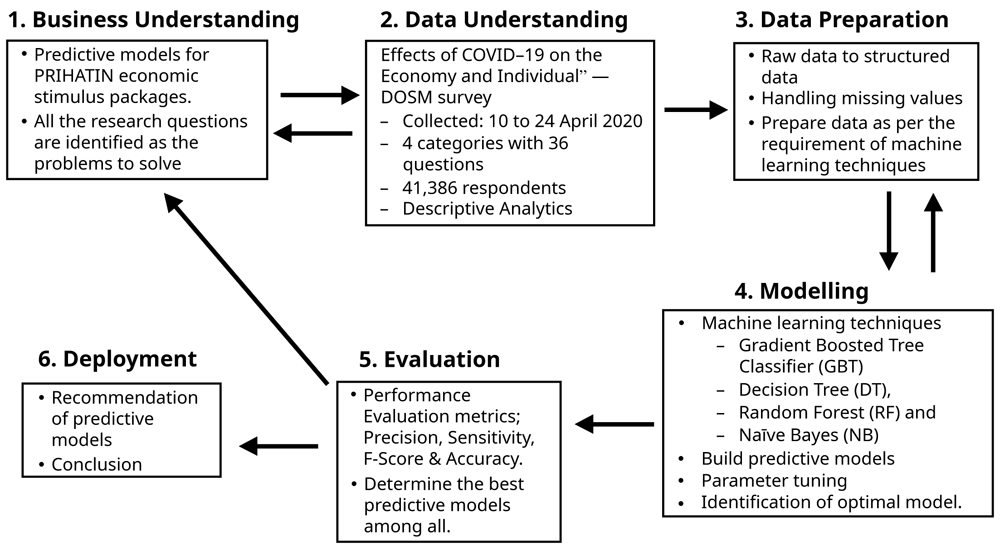
This phase identifies the problems to solve using the machine learning perspective and approach. All three research questions were selected as the problems, and the purpose was to propose predictive models for the moratorium, utility discount and EPF and PRS subsidies in the Prihatin Rakyat ESPs.
Data gathering, evaluating, characterising and assuring its quality are part of this phase. DOSM performed a special survey (Round 2) to investigate the consequences of the COVID-19 epidemic on household economics and status (“Department of Statistics Malaysia Official Portal,” 2020; Malaysia, 2020). The dataset includes 36 questions and 41,386 respondents. However, the data obtained from DOSM were not complete due to missing questions. The missing questions were Q3, Q6, Q19, and Q27 – Q31. In terms of the total respondents, the data were complete and had a total of 41,386 participants, all of them were aged 15 and older. 96.8% of the respondents have received benefits from Prihatin Rakyat ESPs. The raw data were based on responses from respondents, which included qualitative personal opinions on economy, employment, lifestyle, and education. The original dataset was in Malay language, and is translated into English for this study and given below as Table 1.
There were 28 questions available for further analysis in this study, eliminating the missing ones. Question 32 and 33 were excluded from the survey because they focused on the primary food and non-food products purchased during the time of movement control orders. Given that the dataset was cluttered with missing values and errors, a considerable effort was spent on its cleaning before applying descriptive analytics techniques. Q34, Q35 and Q36 had missing values of 2071, 2243 and 2310 respectively and were replaced by the most frequent values. By cleaning the data, the raw data is transformed into structured data. Without losing any information, all lengthy responses were reduced to short and detailed responses. If the original answer for respondent’s dwelling state was "Wilayah Persekutuan Kuala Lumpur," it was converted to "KL." Questions with answers were labelled "Yes," whereas those without answers are labelled "No." One question, for example, inquired about respondents' willingness to eat out as part of the new norm's lifestyle adjustments. Those who agreed said they "will not eat out." Those who opposed to the shift in lifestyle left the question unanswered. As a result, these questions were changed to a "Yes" or "No" format.
Various machine learning techniques were used in this phase to meet the study objectives. To create prediction models, we used four machine learning techniques: Decision Tree, Random Forest, Gradient Boosted Tree and Naïve Bayes. These four machine learning techniques were chosen from a literature review (Mostafa et al., 2021; Sangavi et al., 2020) and used to determine the optimal model by adjusting their parameters. Feature selection methods, such as Gini index, Gain–Ratio and various partitioning ratios of the training and test data sets were also compared (Trivedi, 2020).
In this phase, the best predictive model for each subsidy was selected based on the standard performance evaluation metrics: Sensitivity, Precision, F-Score and Accuracy (Moscato et al., 2021). The formulas used to calculate each of the metrics are given below.
TP = True Positive, TN = True Negative, FP = False Positive, FN = False Negative
The completeness of a prediction model was measured by sensitivity, also known as recall and total positive rate (TPR). This metric determined the proportion of positive predictions by a model that corresponds to true positive values (Moscato et al., 2021). The formula is given below.
Precision in data analytics refers to a model’s ability to correctly forecast outcomes. In other words, precision is a true positive divided by a combination of true and false positives.
F-Score, also known as F1 Score, is a balance of both precision and sensitivity. Hence, this study used F-Score to evaluate the machine learning models.
In the final phase a deployment strategy for the model was created and documented. The best predictive model as determined for each of the subsidies was to be recommended for further deployment. The entire CRISP-DM phases were carried out using the Konstanz Information Miner (KNIME 4.3.2), a free and open-source data analytics software.
The outcomes of this study were organised as descriptive analytics, model optimisation and findings. Descriptive analytics helps to understand the characteristics of each respondent and the relationship between variables. Table 2 provides the descriptive information on the respondents.
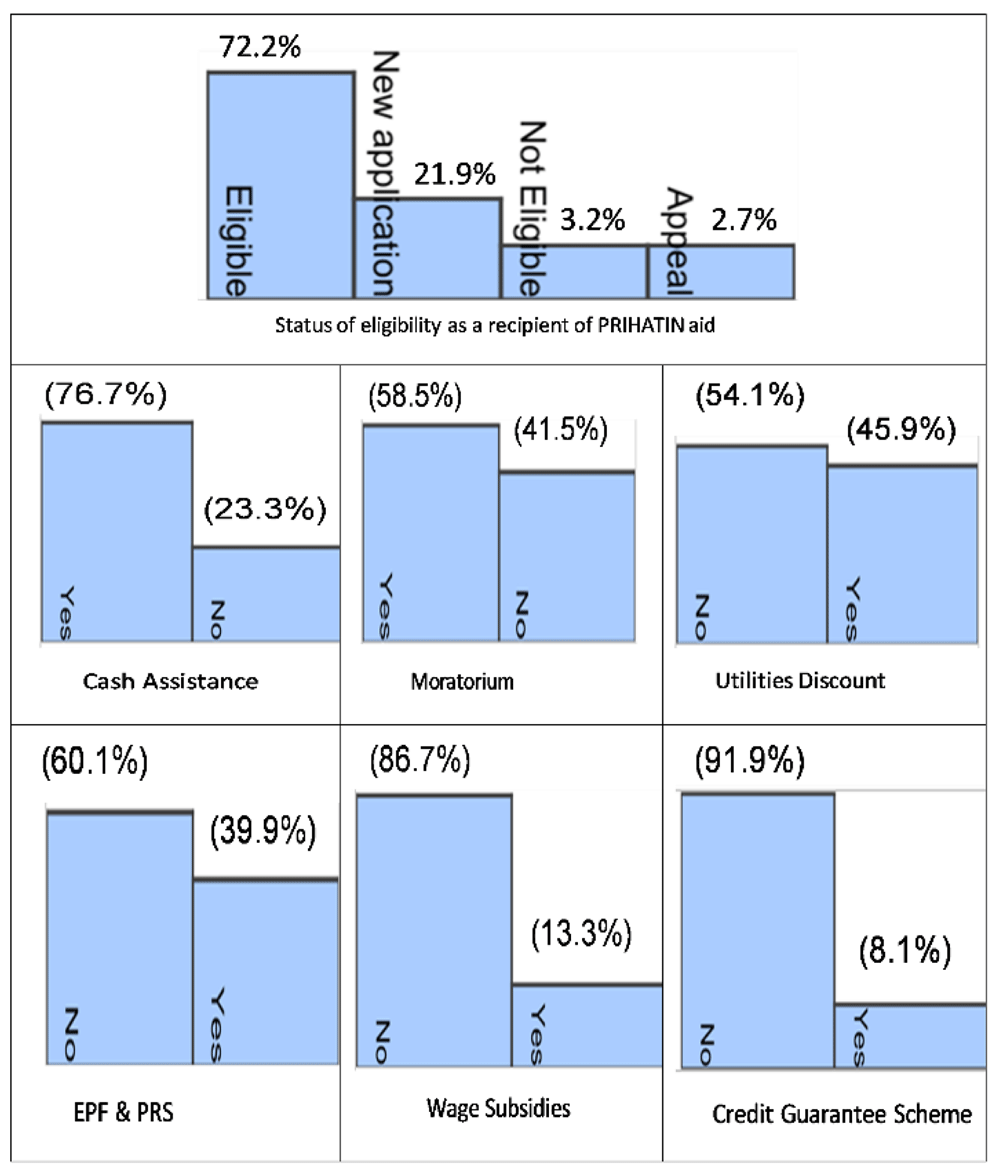
Figure 2 shows the various types of subsidies offered in the ESP. Among the 41,386 respondents, 72.2% were eligible to receive subsidies, 21.9% were newly applied, 3.2% were not eligible and 2.7% had appealed. Figure 2 also shows the most beneficial forms of support. The most popular type of subsidy was cash allowance, followed by moratorium, utility discounts and EPF and PRS cash withdrawals. The least preferred type was the credit guarantee plan and wage subsidies.
Following the descriptive analytics, the four machine learning techniques were applied to develop prediction models for each moratorium, utility discount and EPF withdrawals subsidies. Decision Tree, Gradient Boosted Tree, Random Forest and Naïve Bayes are subjected to parameter tuning to determine the best model and parameter values.
Table 3 to Table 6 show how the optimal model was obtained from each machine learning technique. Partitioning ratio indicates the training and test data. Gain ratio, Gini index and information gain were used to measure the quality of each predictor in classifying the target variable. The results show that the Gradient Boosted Tree and Naïve Bayes techniques performed well when 60% of the data were used to train the machine learning models and the other 40% was used for testing. Random Forest and Decision Tree techniques generated the best models when the training data were 80% and the test data were 20%. F-Score was used as the evaluation measure to select the optimal models. After identifying the optimal models, the best was selected among the four machine learning techniques. Table 7 shows the results. Gradient Boosted Tree outperformed the rest of the techniques in predicting the moratorium preference with 93.8% sensitivity, 82.1% precision and 87.6% F-score.
A similar process was carried out to develop machine learning models for utility discounts and EPF and PRS subsidies. The results show that for both subsidies, Gradient Boosted Tree was the best machine learning technique. Table 8 and Table 9 show that this technique can predict utility discount with 86% sensitivity, 82.1% precision and 84% F-score, as well as EPF and PRS with 83.6% sensitivity, 81.2% precision and 82.4% F-score, respectively.
In this study, Gradient Boosted Tree was found as the best machine learning model for predicting moratorium subsidies. However, this model cannot explain the relationship between the predictors and the target, and thus decision tree rules were derived to understand the overall profile of households who prefer a moratorium. Rule support refers to the number of respondents to whom this condition applies. Rule confidence indicates the probability of having a moratorium as the preferred subsidy. Table 10 shows the basic characteristics of families that choose moratorium subsidies with a rule support of 400 and above.
The first rule shows that households who prefer to have a cash allowance and their race is either Malay or Native Sabah/Sarawak or others, while those aged between 25 to 64 prefer moratorium. Table 11 explains the first rule indicating the general profile of households who prefer moratorium subsidies. Similarly, Table 12 and Table 13 show the general profile of households preferring utility discounts and EPF and PRS cash withdrawals.
| Subsidies | Race | Age Group |
|---|---|---|
| • Cash Assistance (Yes) • Utilities Discount (No) • EOF & PRS (No) • Wage Subsidies (No) • CGS (No) | • Malay • Native Sabah / Sarawak • Others | • 35-44 • 25-34 • 45-54 • 55-64 |
The results imply that households that prefer moratorium subsidies did not favour other financial aids except cash assistance. By contrast, households that prefer for utility discounts, EPF and PRS withdrawals also chose moratorium subsidies and cash assistance. All households preferred cash assistance, which had the highest score among financial aids, followed by moratorium subsidies. Utility discounts, EPF and PRS withdrawals can be implemented according to the household income group preferences.
Wage subsidy and credit guarantee scheme were the least preferred financial assistance. First, the Prihatin wage subsidy is only for eligible Social Security Organisation (SOCSO) subscribers. Hawkers, small businesses and their employees might not subscribe to SOCSO and thus, ineligible to apply for financial aid. Second, the credit guarantee scheme was not preferred due to economic uncertainty from COVID-19. Economic uncertainty adversely affects household income, resulting in their inability to repay the loan instalments.
The following are some of the limitations of this study's findings: The data used are survey responses and cannot be considered to represent the views of all Malaysians. According to DOSM, it should not be used to analyse the impact of COVID-19 in Malaysia and should not be considered official statistics. It can, however, be utilised to assist in the reflection process (“Department of Statistics Malaysia Official Portal,” 2020; Malaysia, 2020).
This study used data analytics and machine learning approaches to derive insights from the “Effects of COVID-19 on the Economy and Individual - Round 2” survey dataset. The CRISP-DM approach was applied to develop prediction models for households’ preferred subsidies, such as moratoriums, utility discounts and EPF and PRS using four machine learning algorithms, namely, Decision Tree, Random Forest, Naïve Bayes and Gradient Boosted Tree. For all three subsidies, the best predictive model was obtained by Gradient Boosted Tree. The findings can be used to design customised ESPs that effectively manage the economic burden of low-income households.
Data used in this study were obtained from a survey dataset “Effects of COVID-19 on the Economy and Individual - Round 2,” available from the Department of Statistics, Malaysia (DOSM). A report published by the DOSM based on the survey can be viewed on the DOSM website. Access to this data requires application, as stated on the DOSM website. A guide for how to apply for dataset access is available on the Data Request page or requests for more information can be emailed to [email protected].
| Views | Downloads | |
|---|---|---|
| F1000Research | - | - |
|
PubMed Central
Data from PMC are received and updated monthly.
|
- | - |
Provide sufficient details of any financial or non-financial competing interests to enable users to assess whether your comments might lead a reasonable person to question your impartiality. Consider the following examples, but note that this is not an exhaustive list:
Sign up for content alerts and receive a weekly or monthly email with all newly published articles
Already registered? Sign in
The email address should be the one you originally registered with F1000.
You registered with F1000 via Google, so we cannot reset your password.
To sign in, please click here.
If you still need help with your Google account password, please click here.
You registered with F1000 via Facebook, so we cannot reset your password.
To sign in, please click here.
If you still need help with your Facebook account password, please click here.
If your email address is registered with us, we will email you instructions to reset your password.
If you think you should have received this email but it has not arrived, please check your spam filters and/or contact for further assistance.
Comments on this article Comments (0)