Keywords
Endophytic Colonisation, Beauveria bassiana, Sesamia calamistis, Entomopathogenic Fungi, Machine Learning, XGBoost, Bio-pesticide
This article is included in the Plant Science gateway.
This article is included in the Artificial Intelligence and Machine Learning gateway.
Endophytic Colonisation, Beauveria bassiana, Sesamia calamistis, Entomopathogenic Fungi, Machine Learning, XGBoost, Bio-pesticide
The agricultural industries continued success is problematic to our future due to global climate changes. However, enhanced pest attacks on crops have decreased productivity in agriculture, which is severely affected by global climate changes. Numerous cereal crops, particularly rice, are crucial for human nourishment and are farmed all over the world especially in West Africa where it has become the primary source of employment and subsistence for destitute households (Bancole et al., 2020; Nguyen and Ferrero, 2006). Its consumption in Africa has significantly increased, making it the continent’s second-largest source of carbohydrates. However, about 140 insect pests attack rice, maize, wheat, sorghum, particularly Lepidopteran stem borers are the most commercially significant insect pests that influence its production, and their management depends on the use of pesticide chemicals that have harmful consequences on people and biodiversity. Other issues brought on by the use of chemical pesticides include environmental issues, residues in food, water and soil, the possibility of harmful effects on humans and non target creatures, as well as their prohibitive cost for small scale farmers (Goulson, 2013; Togola et al., 2018). The use of chemical pesticides has been a major component of the pest management measures against this borer pest. However, because of their elusive feeding habits, negative impacts on the environment, and danger to human health, borer pests are very difficult to manage with chemical insecticides. It has also been demonstrated that many stem borers such as S. calamistis have developed resistance to chemicals. Hence there is a need for the development of an alternate, safe control measure using entomopathogenic fungus like Beauveria bassiana (Balsamo) Vuillemin. Studies and research have shown that B. bassiana is endophytic in a number of crops and have established its function in defending plants against diseases and pest arthropods (Ownley et al., 2008; Ownley et al., 2010; Gurulingappa et al., 2011; Dara, 2013; Hollingsworth et al., 2020; Rai and Ingle, 2012; Silva et al., 2020; Wagner and Lewis, 2000) with many making it a potential mycopesticide (Wei et al., 2020; Zhang et al., 2012; Barra-Bucarei et al., 2020). Endophytic colonisation of entomopathogenic fungi like B. bassiana within the plant system provides more benefits than external application due to its various traits, including parasitism of a wide range of pests, different mechanisms of pathogenicity, environmental safety, endophytic colonisation, and ease of production (Azevedo et al., 2000; Vega et al., 2009; Cherry et al., 1999; Kikuchi et al., 2015). In order to manage different insects, some strains have been injected into different plant species utilising a variety of inoculation techniques, including seed treatments, soil drenches, foliar and flower sprays, and stem injections. Numerous investigations have been conducted to identify the Beauveria bassiana endophytic strains that are most effective in cereal crops. Numerous experimental research have also been conducted to determine the most effective inoculation technique and to identify a safe protection technology using endophytic entomofungal infections.
The creation of machine learning algorithms, which are a group of analytical techniques that automate the process of creating models and iteratively learn from data to gain insights without explicitly programming, has made it possible to use more effective and powerful tools to not only determine the best inoculation technique for protecting cereal crops from insects and other crop infections but also to assess the potential of various promising indigenous isolates of Beauveria bassiana.
Advancement in technology has driven many researchers to apply machine learning approaches to various agricultural sector. For example finding the crop succession and stamp behavior (Hazard et al., 2018; Johnson and Zhang, 2014), using environmental data as training data to determine the ideal future weather conditions for growing good crops (Kamilaris and Prenafeta-Boldú, 2018). Various algorithms, including swarm intelligence optimisation, artificial neural networks, k-nearest neighbour, and genetic algorithms that were also expanded with the aid of pesticides control in the field of plant pathology, have been used in other studies to evaluate crop yield time prediction and crop pest prediction (Teeda et al., 2018; Cai and Sharma, 2021). Furthermore, 26 diseases and 14 crop species have been categorised using deep convolutional neural networks (Mohanty et al., 2016).
Machine learning algorithm has also been used to correctly identify 13 different plant diseases as well as identify bacteria with high prediction accuracy (Schikora et al., 2010; Sladojevic et al., 2016). However, due to the implications for precision agriculture, prediction and quantification of the best biological control agent, and the best inoculation method may be more crucial in the future than disease categorisation and identification. Such studies might result in early insect prevention for cereal crops and lower pesticide costs.
The research’s objective is to use machine learning algorithm to investigate, study and analyse the entomopathogenic fungi, Beauveria bassiana, one of the biological control agent that directly protect rice crops against S. calamistis, the most common rice arthropod in West Africa. Additionally, the inoculation technique highly affects how well rice crops are protected from pests and other crop infections. As a result, the proposed algorithm will also aid in predicting the most effective crop pest inoculation method.
This section follows machine learning workflow to explore and prepare our dataset for modelling purposes. The process consists of learning about the data, cleaning it by removing outliers, converting categorical variables to numerical variables, training the model using various machine learning algorithms, and evaluating the model’s performance using existing regression metrics. This procedure has several phases, which are as follows:
Data collection and description
The experimental data used for this research were obtained from (Bancole et al., 2020) previous studies. The original tabulated dataset contains 63 data points for each targeted rice plant tissues. Each variable in the dataset was classified as categorical or numerical based on its nature. The selected features variables in the original dataset consisted of African rice cultivar such as NERICA-L19, NERICA1, and NERICA8, the five Beauveria bassiana such as Bb3, Bb4, Bb10, Bb21 and Bb35, and the time. The target variables were the percentage of roots, stems, and leaves sections colonised based on their degree of protection after inoculation.
Data preparation
Before developing each model, a pre-processing phase was carried out to enhance the model’s predictive power in order to assess the potential of five promising indigenous isolated Beauveria bassiana as endophytes in rice sections. The least significant data points (controls 1, 2, and 3) were also manually removed from the original dataset because they had no bearing on the colonisation of rice tissue following each inoculation method. Furthermore, the time was normalised in accordance to Equation 1 (Sewsynker and Kana, 2016) by translating the data into the range [0,1].
where Emin and Emax stand for the minimum and maximum values and ei represents the normalised data. Rice plant tissues and Beauveria bassiana strain features were classified in the original dataset as categorical values. But due to the fact that machine learning did not work directly with categorical values, Sklearn library (RRID:SCR_019053) (Pedregosa et al., 2011) was used to automatically encode the features into numerical values. To map categorical values to integer values, OneHotEncoder, a method for converting categorical values to numerical values, was used. Each integer value was represented as a binary vector, with all zero values except the integer’s index marked as one (Seger, 2018). In addition, the target variable was taken as a percentage of roots, or stem, or leaves colonised depending on the inoculation method with the highest number considered as a 100% protection. Finally, a high-level interface for creating appealing and instructive statistical visualisations was provided by seaborn (Waskom, 2021), a Python data visualisation library.
Feature selection
The most important characteristics influencing the rice plant tissue were identified using a process called feature selection. This was achieved by measuring the linear relationship between two or more variables. The rationale for utilising correlation to choose features is that the attributes have a strong connection with the target variable. A further requirement is that attributes should be uncorrelated among themselves while being correlated with the target variable. Due to the potential impact that strongly correlated feature variables may have on an algorithm’s performance, this procedure is crucial to machine learning.
In order to analyse the prediction of the entomopathogenic fungi, computational intelligence techniques including Linear regression (LR) (Pedregosa et al., 2011), least absolute shrinkage and selection operator (LaSSO) (RRID:SCR_003418), support vector regression (SVR), k-nearest neighbor (KNN), ensemble learning (EN), and Extreme Gradient Boosting (XGBoost) (RRID:SCR_021361) were used, with an emphasis on accuracy and efficiency as well as their ability to handle experimental data. Following a thorough analysis and application of the various machine learning prediction techniques, it was discovered that the scalable, adaptable, precise, and reasonably quick XGBoost regression approach offered a more regularised model formalisation and improved over-fitting management.
XGBoost regression is a type of ensemble machine learning algorithm that can be used to solve problems involving classification and regression predictive modelling. In this algorithm, Decision tree models are used to build ensembles and trees are added to the ensemble one at a time and fitted to fix the prediction errors caused by prior models.
Suppose we have K trees as explicitly described in Wang et al. (2019), mathematical prediction output of XGBoost can be written as
In this situation, it minimises the following objective:
Second-order Taylor approximation can be utilised in the general scenario as follows to optimise the objective:
The goal of creating a predictive model is to create a model that is accurate on previously unseen data. This can be accomplished using statistical techniques in which the training dataset is carefully used to estimate the model’s performance on new and unknown data. The most basic technique of model validation is to perform a train/test split on the dataset. A typical ratio for this varies depending on the amount of data, but it is critical to have enough training data. After training the model with the hyper-parameters provided by the algorithms, predictions on test data must be made and compared to the expected results.
In the current study, the datasets were split into training sets, which comprised 80% of the datasets, and testing sets, which comprised 20% of the datasets. The hyper-parameters were supplied as arguments while creating an instance of an XGBoost regressor from the XGBoost library. This stage is crucial for controlling how effectively the machine learning techniques are being used. The training section of the datasets was used to train the adopted algorithms with tuning parameters, and the testing portion of the datasets was used to demonstrate the developed model’s response to new data being processed for the first time.
Random-state was also assigned to maintain reproducibility of the results. Root mean squared error and the coefficient of determination R2 were computed on validation data and used to assess the accuracy of the model. Parameters tuning was conducted to avoid over-fitting and under-fitting. This was achieved by varying some XGBoost parameters between its minimum and maximum value while all other parameters were maintained at their default values.
Our main focus were on the four main parameters such as number of estimators, learning rate, colsample-bytree, max-depth, and the regularisation parameters. As for other parameters, default values set in XGBoost package were considered. When training a deep tree, XGBoost rapidly consumes memory, thus we should be cautious when choosing big values of max-depth (Tianqi, 2016). In order to achieve this, suitable hyper-parameter values can be determined through systematic testing, such as grid searching across a range of values, or by trial and error for a given dataset. It is important to emphasise that cross-validation was used to choose the optimum parameters and decrease the weight of each step in order to strengthen the model.
It is critical to identify the most influential features via correlation in order to speed up the prediction process and avoid potential over-fitting by reducing the number of attributes considered. This was accomplished by examining the data to determine how features variables affect the colonisation of roots, stems, and leaves following the two inoculation methods. Furthermore, a model performance evaluation was presented, in which the accuracy of the prediction results was verified and the competency of the four algorithms was compared for different k-fold cross-validations.
For correlation analysis with regard to feature engineering results, the most predominate attributes are taken into account. Correlation values closer to 1 signify a strong and direct correlation between the two features since attributes can be thought of as the Pearson Coefficient. A high yet inverse correlation, however, is indicated by correlation values that are closer to -1. For instance, the seaborn library was used to plot the correlation plot between variables.
Figure 1 (Kana et al., 2022) presents a one to one relationship between variable. Every variable shows a relationship with another variable regardless of the inoculation method. We can see a strong positive correlation between number of colonised stem sections and the passage of time (30-60 days). This shows that the degree of stems protection increases with an increase number of days following foliar spray treatment. Also, Beauveria bassiana isolates Bb10 and Bb3 have a 0.26 and 0.19 correlation values with the number of stem section colonised value, respectively, indicating that Bb10 and Bb3 are the most effective strain regarding the rice stem tissue. Nerica1 has a 0.2 correlation value with the rice stems specie, indicating that the level of colonisation of the rice stems favor the rice cultivar, Nerica1. On the other hand, Nerica8 and the rice stems tissue have a -0.26 correlation value, indicating that the colonisation of rice stem specie do not favour the rice cultivar, Nerica8. There is also a moderate negative correlation between number of stems section colonised, Bb21 and Bb35, indicating similar levels of pathogenicity of the Beauveria bassiana isolates.
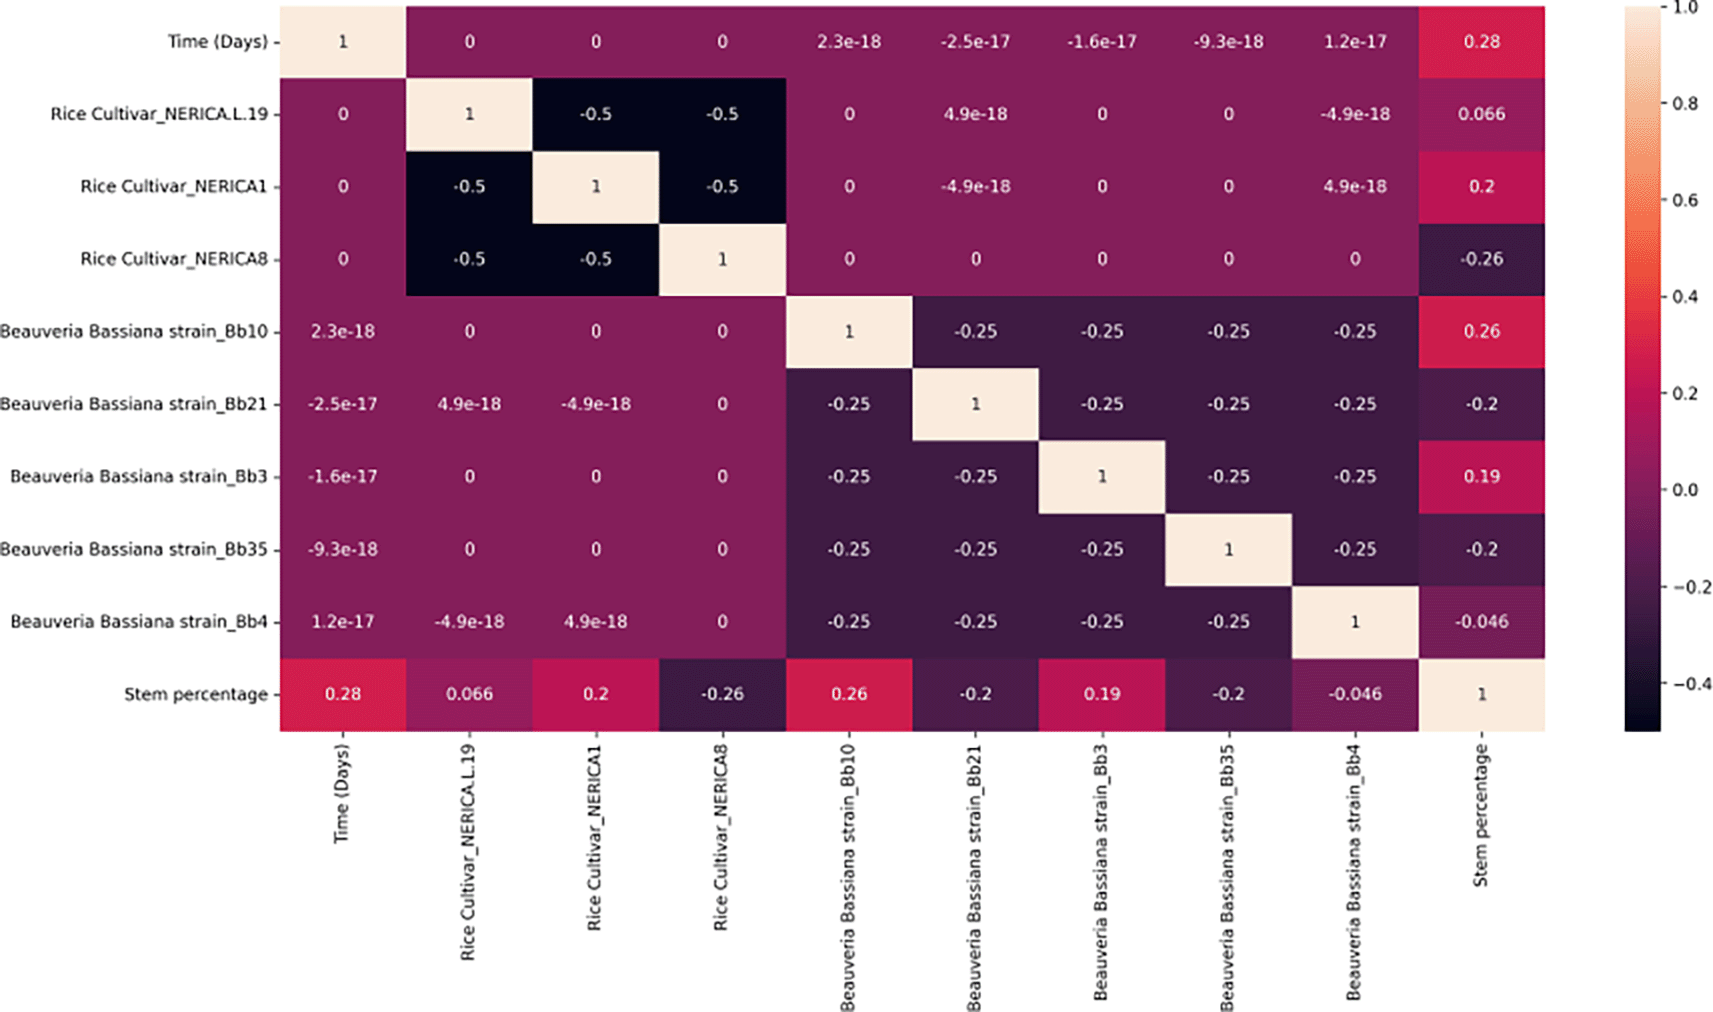
The colour represents the correlation coefficient’s value. The intensity of the colour is proportional to the correlation coefficient, with both positive and negative correlations displayed. Reduced colour intensity denotes lower correlations.
After foliar spray treatment, a weak but favourable connection between the level of roots colonised over time was observed between Nerica1, Bb10 and Bb4 as presented in Figure 2. This shows that the level of colonisation of the roots increases with an increase number of days, and the Beauveria bassiana isolates Bb10 and Bb4 are the most effective strain killing most of S. calamistis larvae. Furthermore, we noticed a weak negative correlation in the level of colonisation of the roots between Nerica8, Beauveria bassiana isolates Bb21 and Bb3.
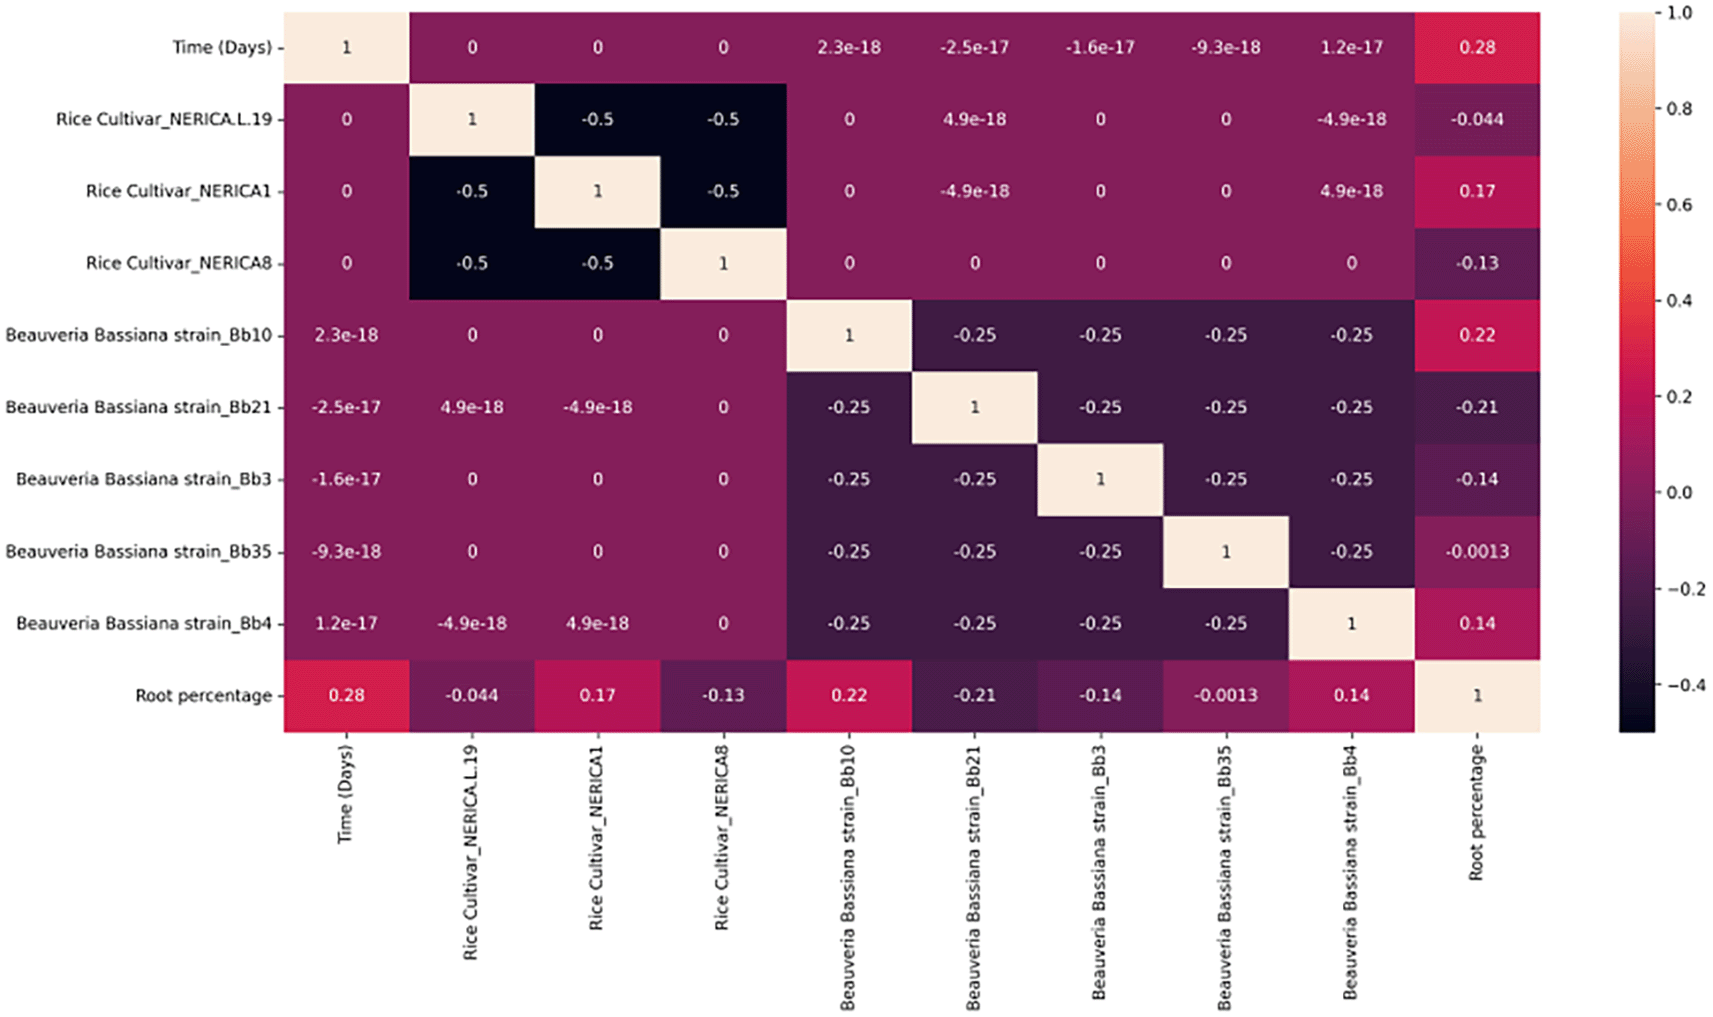
The colour represents the correlation coefficient’s value. The intensity of the colour is proportional to the correlation coefficient, with both positive and negative correlations displayed. Reduced colour intensity denotes lower correlations.
Positive weak correlation was also observed in the level of colonisation of the leaves between Nerica-L19, Nerica1, Bb3, Bb4 and Bb10 as shown in Figure 3, indicating that Bb3 and Bb10 were the most effective strain in the colonisation of leaves. Additionally, Nerica-L19 and Nerica1 had a 0.2 and 0.15 correlation value, respectively, with the rice leaves species, indicating that the level of colonisation of the rice leaves favoured the two rice cultivar species as reported in Figure 3. There is also a moderate negative correlation in the level of colonisation of leaves between Nerica8, Bb21, and Bb35.
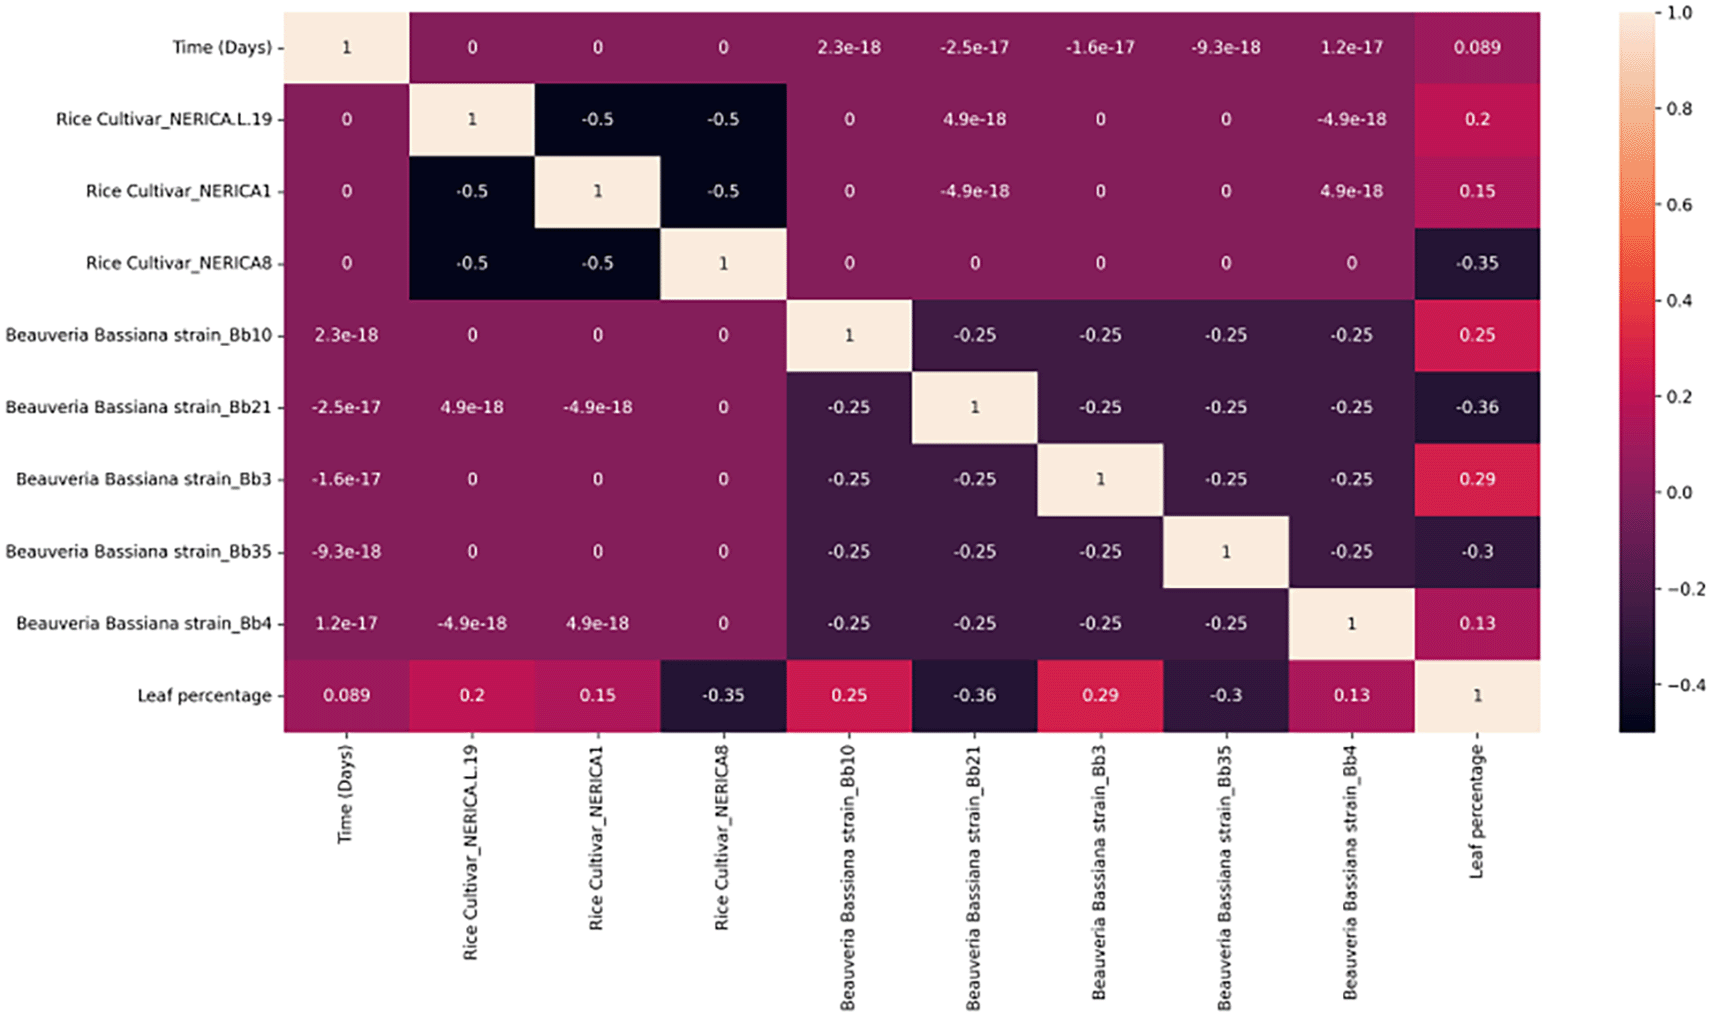
The colour represents the correlation coefficient’s value. The intensity of the colour is proportional to the correlation coefficient, with both positive and negative correlations displayed. Reduced colour intensity denotes lower correlations.
These correlations are useful for understanding the data in depth because they show how one variable affects the other.
Following seed treatment, a favourable connection between Beauveria bassiana isolates and a particular rice cultivar was seen in the colonisation of stems. Figure 4 presents a moderate positive correlation of the colonisation of stem between Nerica1. This shows that the level of colonisation of the rice stem favoured the rice cultivar species. Moreover, Beauveria bassiana isolates Bb10 seemed to be the most effective strain in the colonisation of stem with the correlation value of 0.13. It can be seen that Nerica8, Bb3 and Bb4 represent the other three factors influencing the stem rice plant tissue. Strong negative correlation occurred in the level of colonisation of stem between NericaL-19, indicating that the level of colonisation of the rice stem do not favour the rice cultivar species. In addition, time (in days), Bb21 and Bb35 affect the stem rice plant tissue with a weak negative correlation.
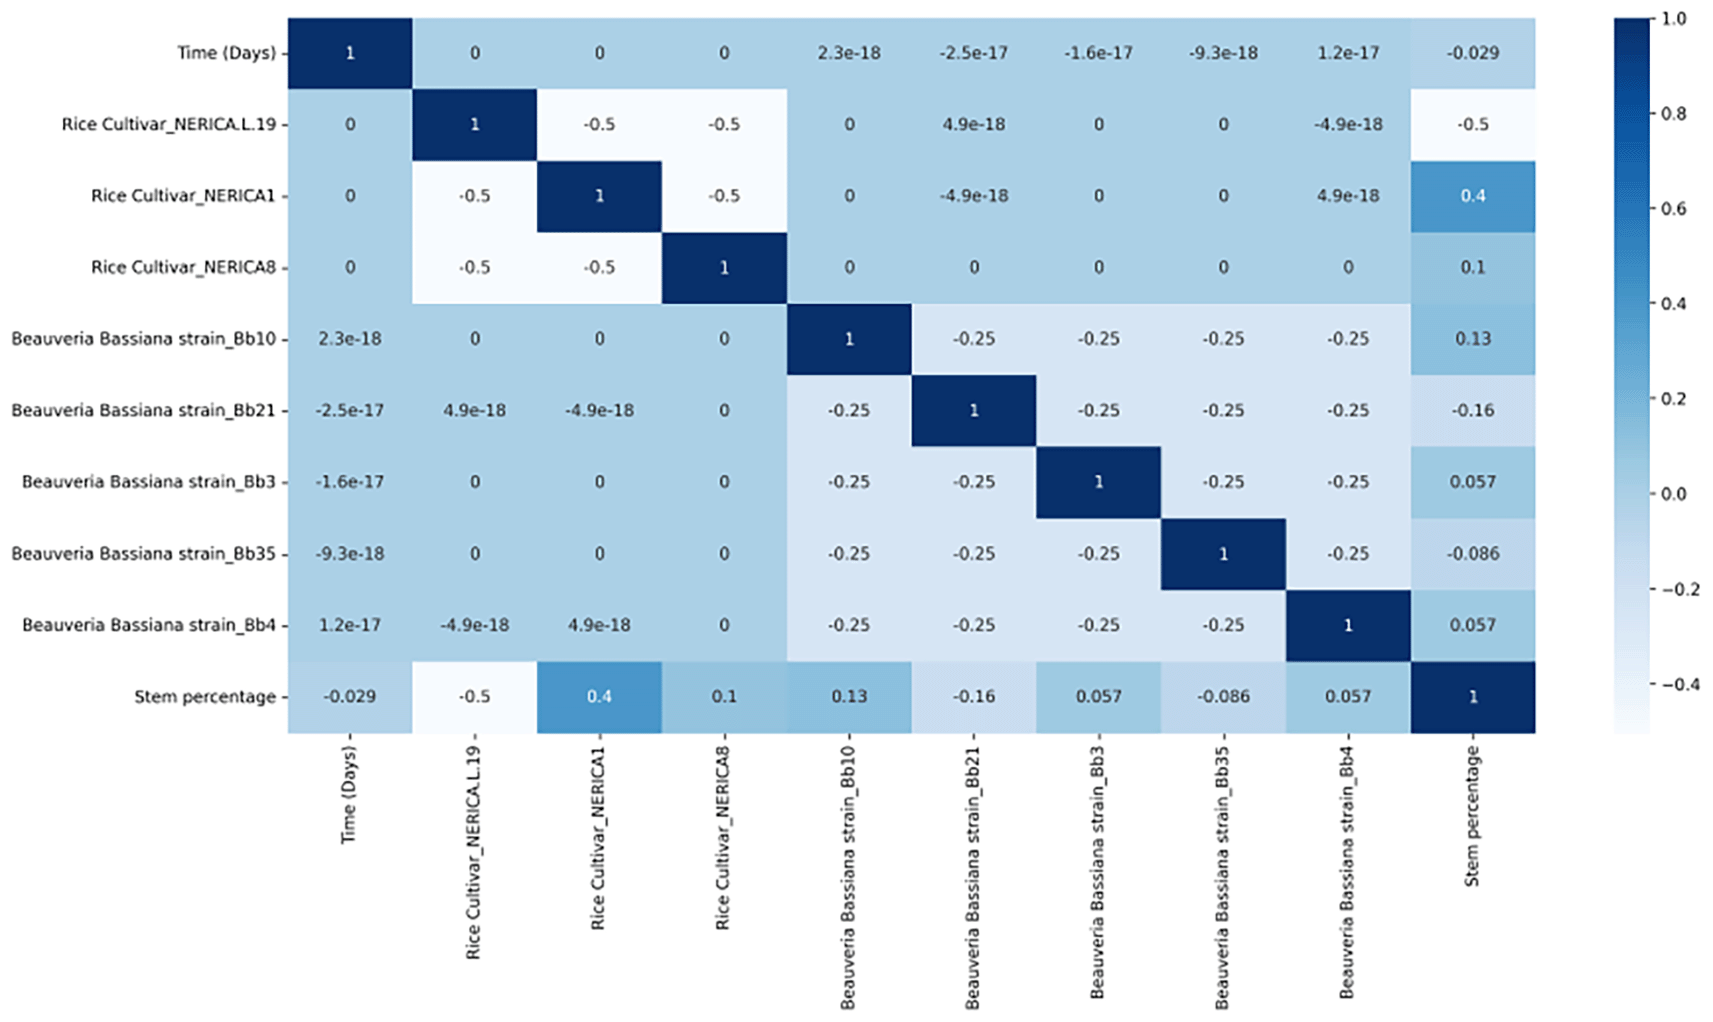
The colour represents the correlation coefficient’s value. The intensity of the colour is proportional to the correlation coefficient, with both positive and negative correlations displayed. Reduced colour intensity denotes lower correlations.
As displayed in Figure 5, a weak positive correlation was also observed in the colonisation of roots between Beauveria bassiana isolates and rice cultivar. Furthermore, a moderate positive correlation in the colonisation of roots between Nerica1 was observed. This shows that the level of colonisation of the rice roots favoured the rice cultivar species. Additionally, Beauveria bassiana isolates Bb10 seemed to be the most effective strain in the colonisation of roots with the correlation value of 0.18. There was also a negative correlation between the number of root sections colonised, Nerica-L19, Bb21 and Bb35 with the Nerica-L19 being the rice cultivar that does not favour the colonisation of roots.
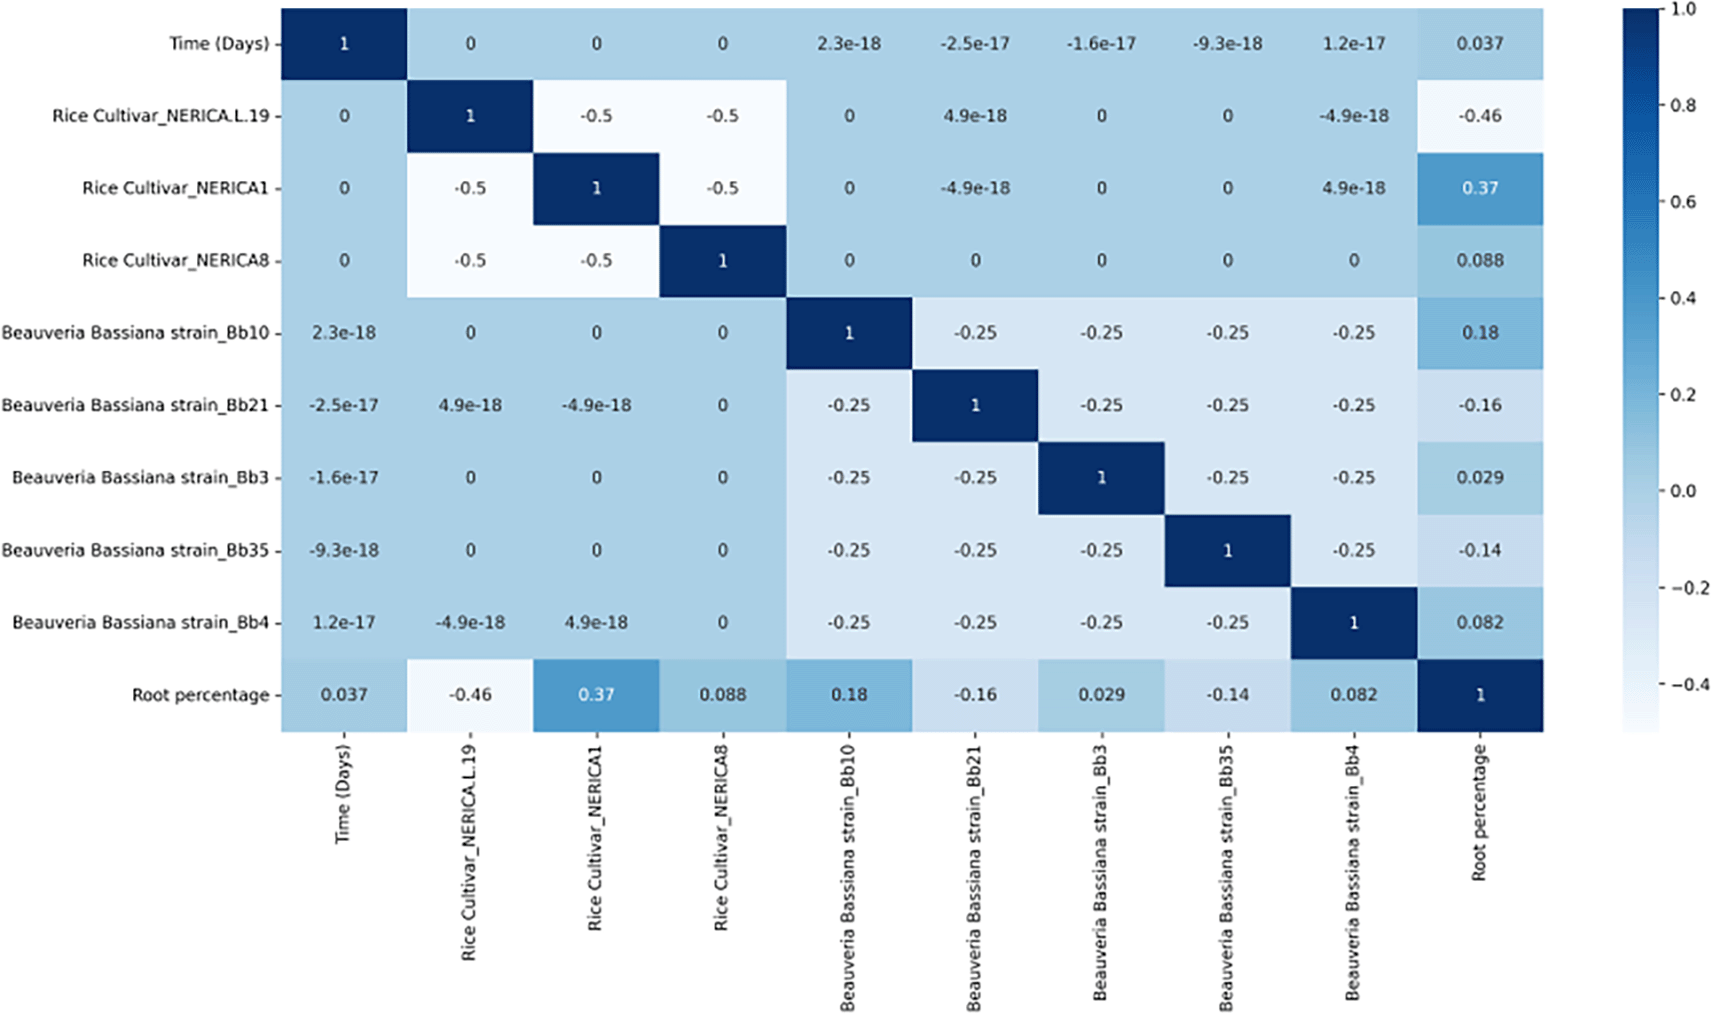
The colour represents the correlation coefficient’s value. The intensity of the colour is proportional to the correlation coefficient, with both positive and negative correlations displayed. Reduced colour intensity denotes lower correlations.
Figure 6 shows a weak positive correlation in the colonisation of leaves between Nerica1, Nerica8 and Beauveria bassiana isolates Bb10. This demonstrates that the level of colonisation of the rice leaves favour the two rice cultivar species. On the other hand, there was a moderate negative correlation in the level of colonisation of leaves between NericaL-19, indicating that the level of colonisation of rice leaves do not favour the rice cultivar species. Time (in days), Bb3, Bb4, Bb21 and Bb35 were the other factor influencing the stem rice plant tissue with a weak negative correlation.
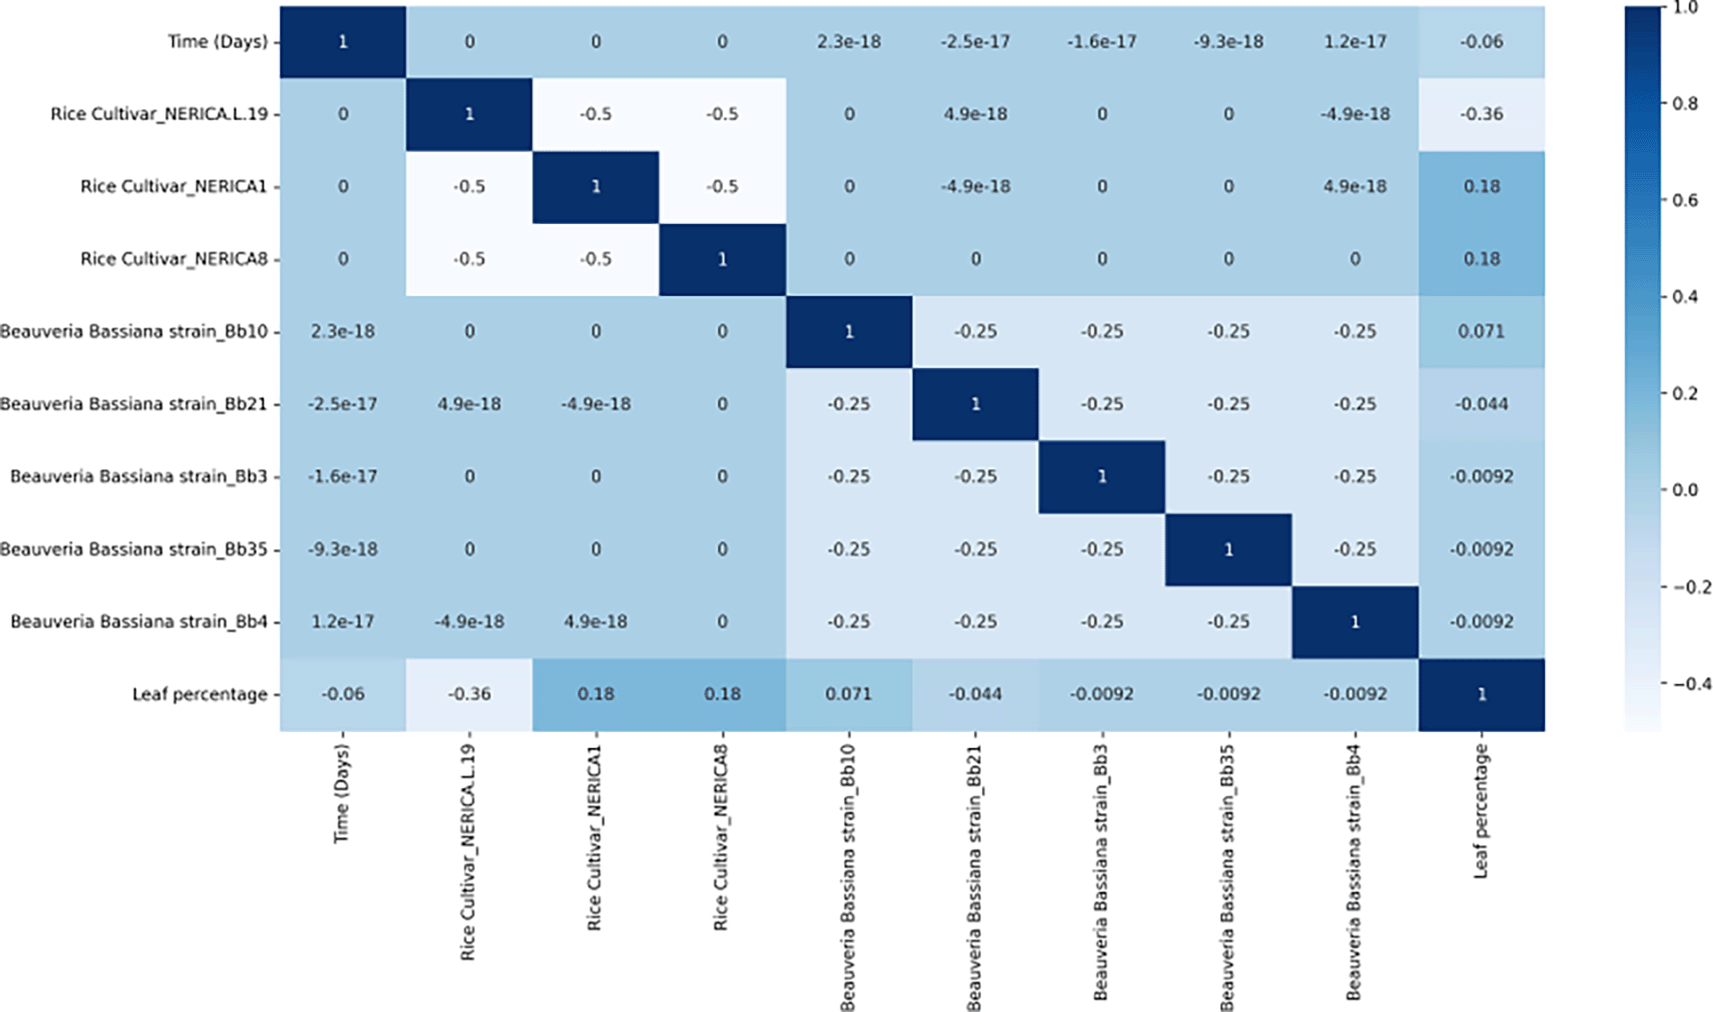
The colour represents the correlation coefficient’s value. The intensity of the colour is proportional to the correlation coefficient, with both positive and negative correlations displayed. Reduced colour intensity denotes lower correlations.
Model’s evaluation
The experimental data that were gathered were divided into a training set and a testing set. The training set was used to generate the final strong learner, while the testing set was used to demonstrate the model’s accuracy in predicting the best biological control agent that directly protects rice crops from stem borer. For the model’s training, 80% of the datasets were randomly chosen, while the remaining 20% were utilised to gauge the model’s effectiveness. A range of assessment metrics, including root mean squared error (RMSE) and coefficient of determination (R2) were calculated according to Equation 7 and Equation 8.
where SSE is the sum of residuals, which equal to , and SST the total sum of square, which equal to . During the training process, the RMSE between the predicted and the observed data reduced to 12.24 and 4.58 following seed treatment and foliar spray method for the colonisation of roots, and to 10.97 and 0.28 following seed treatment and foliar spray method for the colonisation of stems, also to 19.68 and 7.96 following seed treatment and foliar spray method for the colonisation of leaves. The XGBoost model accurately predicted the residual value of the colonisation of roots, stems and leaves, with the highest accuracy of 0.87, 0.91 and 0.75, respectively, following seed treatment method and 0.98, 0.99, and 0.94, respectively, following foliar spray method. This study shows that the foliar spray treatment method has excellent prediction accuracy on the colonisation of roots, stems and leaves.
A trend or correlation between the predicted variables and the observed variables is depicted visually using the line of best fit. Figure 7 depicts a plot of predicted versus observed values of colonisation of rice plant tissues following foliar spray (left) and seed treatment (right) methods. The coefficient of determination R2 for both methods was also shown in the figures. The left panel of Figure 7 revealed that the large majority of the data points of colonisation of roots plant rice following foliar spray are congregated along the predictive trend with R2 = 0.93, thus demonstrating the closeness between the predicted and observed values. On the other hand, the right panel of Figure 7 following seed treatment method showed that the data points are dispersed on either side of the prediction trend with R2 = 0.81, thereby demonstrating a fragile relationship between the predicted and the observed values.

The best-fit regression line depicts expectations under a one-to-one relationship between predicted and observed values.
The left and right panel of Figure 8 presents the relationship between the predicted and the observed values of colonisation of stem plant rice following foliar spray and seed treatment method, respectively. The coefficient of determination R2 are also displayed on the two plots. Results from the left and right panel of Figure 8 revealed that the large majority of the data points of colonisation of stem plant rice following both methods are congregated along the predictive trend with R2 = 0.95 and R2 = 0.93, respectively, thereby demonstrating how closely the predicted and observed values match up.

The best-fit regression line depicts expectations under a one-to-one relationship between predicted and observed values.
The graph in Figure 9 compares predicted and observed values for the colonisation of rice plant tissues after foliar spraying (left) and seed treatment (right). The figures also included the R2 coefficients for both approaches. The left panel of Figure 9 revealed that the large majority of the data points of colonisation of leaves plant rice following foliar spray are congregated along the predictive trend with R2 = 0.88, thus highlighting the similarity between the predicted and observed values. Furthermore, the right panel of Figure 9 following the seed treatment method revealed that the data points are dispersed on the predictive trend with R2 = 0.75, thereby indicating a weak relationship between the predicted and the observed values.

The best-fit regression line represents expectations under a one-to-one connection between predicted and observed values.
The left and right plot displayed in Figure 10 compared the distribution plot of the observed values (orange curve) and the predicted values (blue curve) of colonisation of roots plant rice following foliar spray and seed treatment method of train data. The sharp block like structures are histograms and the smoothed curves are called probability density function. It’s observed from the left panel of Figure 10 that the probability density function of both observed and predicted curves are filled for foliar spray method. Moreover, there is an overlap between the probability density function of both observed and predicted curves for the seed treatment method as shown at the right panel of Figure 10.

The left and right plots depicted in Figure 11 compared the distribution plot of the observed values (orange curve) and the predicted value (blue curve) of colonisation of stem plant rice following the foliar spray and the seed treatment method of train data. The sharp block like structures are histograms and the smoothed curves are called probability density function. It’s observed from the left panel of Figure 11 that, the probability density function of the observed and predicted curves are filled for foliar spray method. Furthermore, there is an overlap between the probability density function of the observed and predicted curves for the seed treatment method as shown on the right panel of Figure 11.

The left and the right panel of Figure 12 compared the distribution plot of the observed values (orange curve) and the predicted values (blue curve) of colonisation of leaves plant rice following foliar spray and seed treatment method of train data. The left panel of Figure 12 showed that the probability density function of observed and predicted values are filled for foliar spray method. Moreover, there is an overlap between the probability density function of the observed and predicted curves for the seed treatment method as shown on the right panel of Figure 12.
Finding the biological control agent that would directly defend rice crops and other cereal crops against the stem borer, which is common in West Africa, is made possible by the specialised, powerful, adaptable, and intelligible predictive machine learning algorithms. Researchers can tremendously benefit from coherent, accurate, and integrated prognostic models for biological control agent prediction. Farmers can also choose the best inoculation technique to apply pest control on cereal crops.
Models for predicting biological control agents were created and the residual value estimates made by the support vector regression, LaSSO, and KNN regression models were noticeably inaccurate. This led to the proposal of a novel method for creating a single classification model from multi-dimensional class data.
The XGBoost is a novel ensemble-based prediction model built using decision tree models. In order to repair the prediction mistakes caused by earlier models, trees are added one at a time to the ensemble and fitted. Any arbitrary differentiable loss function and the gradient descent optimisation procedure are used to fit the models. In order to evaluate the model’s proficiency, two evaluation metrics such as RMSE and R2 were used.
Regarding the coefficient of determination result, the colonisation of rice cultivar plant tissues following foliar spray method had the highest prediction accuracy of 0.99 for the stem, followed by 0.98 for the roots and 0.94 for the leaves. The seed treatment method obtain a prediction accuracy of 0.91 for the stem, followed by 0.87 for the roots and 0.75 for the leaves. A significant discrepancy was observed in the coefficient of determination of leaves following foliar spray method (0.94) and the one following seed treatment (0.75). Evaluation of these models revealed that they effectively captured the extremely non-linear relationships between the feature variables and related target variables within the given data. Foliar spray method showed the highest colonisation of predictive accuracy on various plant tissues used to investigate the bio-control proficiency.
For future research, more sophisticated methods such as deep learning algorithms will be applied in finding a better method to handle insect in cereal crops and discover the most appropriate plant tissues. Additionally, better data collection and assortment techniques can be applied, allowing acquired datasets to be archived, organised, analysed, and regenerated for results that are more accurate. Furthermore, the suggested modelling methods can be refined and further developed for greater performance and more precise prediction outcomes.
M.T selected the algorithms, collected, gathered and processed the data, and wrote the manuscript. E. K supervised the project. B. B conceptualised the experiment and provided the data used for this research. All the authors discussed and revised the manuscript.
Figshare: Machine Learning Model to Predict Endophytic Colonisation of Rice Cultivar Plant Tissues by B. bassiana Isolates and their Potential as Bio-control Agents Against Rice Stem Borer using Existing Knowledge. https://doi.org/10.6084/m9.figshare.20934613 (Kana et al., 2022).
This project contains the following underlying data:
• seed_inoculation.csv
• foliarSpray_inoculation.csv
• foliarsprayleaves.ipynb
• foliarspraystem.ipynb
• foliarSprayroot.ipynb
• Seedleaves.ipynb
• Seedroot.ipynb
• Seedstem.ipynb
Data are available under the terms of the Creative Commons Attribution 4.0 International license (CC-BY 4.0).
We would like to thank everyone who took part in the study for their hard work and contributions. We’d also like to thank the open-source Python community for providing free tools (Python Programming Language (RRID:SCR_008394)). We thank Google Colaboratory (Google CoLab (RRID:SCR_018009)), Anaconda (Conda (RRID:SCR_018317)), scikit-learn (RRID:SCR_002577), Pandas (RRID:SCR_018214), NumPy (RRID:SCR_008633), and Jupyter Notebook (RRID:SCR_018315).
| Views | Downloads | |
|---|---|---|
| F1000Research | - | - |
|
PubMed Central
Data from PMC are received and updated monthly.
|
- | - |
Is the work clearly and accurately presented and does it cite the current literature?
Yes
Is the study design appropriate and is the work technically sound?
Yes
Are sufficient details of methods and analysis provided to allow replication by others?
Partly
If applicable, is the statistical analysis and its interpretation appropriate?
Partly
Are all the source data underlying the results available to ensure full reproducibility?
Partly
Are the conclusions drawn adequately supported by the results?
Yes
Competing Interests: No competing interests were disclosed.
Reviewer Expertise: Biological Control, Insect Pathology, Microbiology, Entomology, Integrated Pest Management.
Is the work clearly and accurately presented and does it cite the current literature?
Yes
Is the study design appropriate and is the work technically sound?
Yes
Are sufficient details of methods and analysis provided to allow replication by others?
Partly
If applicable, is the statistical analysis and its interpretation appropriate?
Partly
Are all the source data underlying the results available to ensure full reproducibility?
Partly
Are the conclusions drawn adequately supported by the results?
Yes
References
1. Ramos Aguila LC, Sánchez Moreano JP, Akutse KS, Bamisile BS, et al.: Comprehensive genome-wide identification and expression profiling of ADF gene family in Citrus sinensis, induced by endophytic colonization of Beauveria bassiana.Int J Biol Macromol. 2023; 225: 886-898 PubMed Abstract | Publisher Full TextCompeting Interests: No competing interests were disclosed.
Reviewer Expertise: entomopathogens, endophytes
Alongside their report, reviewers assign a status to the article:
| Invited Reviewers | ||
|---|---|---|
| 1 | 2 | |
|
Version 1 03 Nov 22 |
read | read |
Provide sufficient details of any financial or non-financial competing interests to enable users to assess whether your comments might lead a reasonable person to question your impartiality. Consider the following examples, but note that this is not an exhaustive list:
Sign up for content alerts and receive a weekly or monthly email with all newly published articles
Already registered? Sign in
The email address should be the one you originally registered with F1000.
You registered with F1000 via Google, so we cannot reset your password.
To sign in, please click here.
If you still need help with your Google account password, please click here.
You registered with F1000 via Facebook, so we cannot reset your password.
To sign in, please click here.
If you still need help with your Facebook account password, please click here.
If your email address is registered with us, we will email you instructions to reset your password.
If you think you should have received this email but it has not arrived, please check your spam filters and/or contact for further assistance.
Comments on this article Comments (0)