Keywords
Eco-Intensification, Eco-system, Plantain, Diversity, Microfauna
This article is included in the Agriculture, Food and Nutrition gateway.
This article is included in the Ecology and Global Change gateway.
Eco-Intensification, Eco-system, Plantain, Diversity, Microfauna
The changes made from version 1 to version were:
Abstract, The word Dominion was changed to Dominance
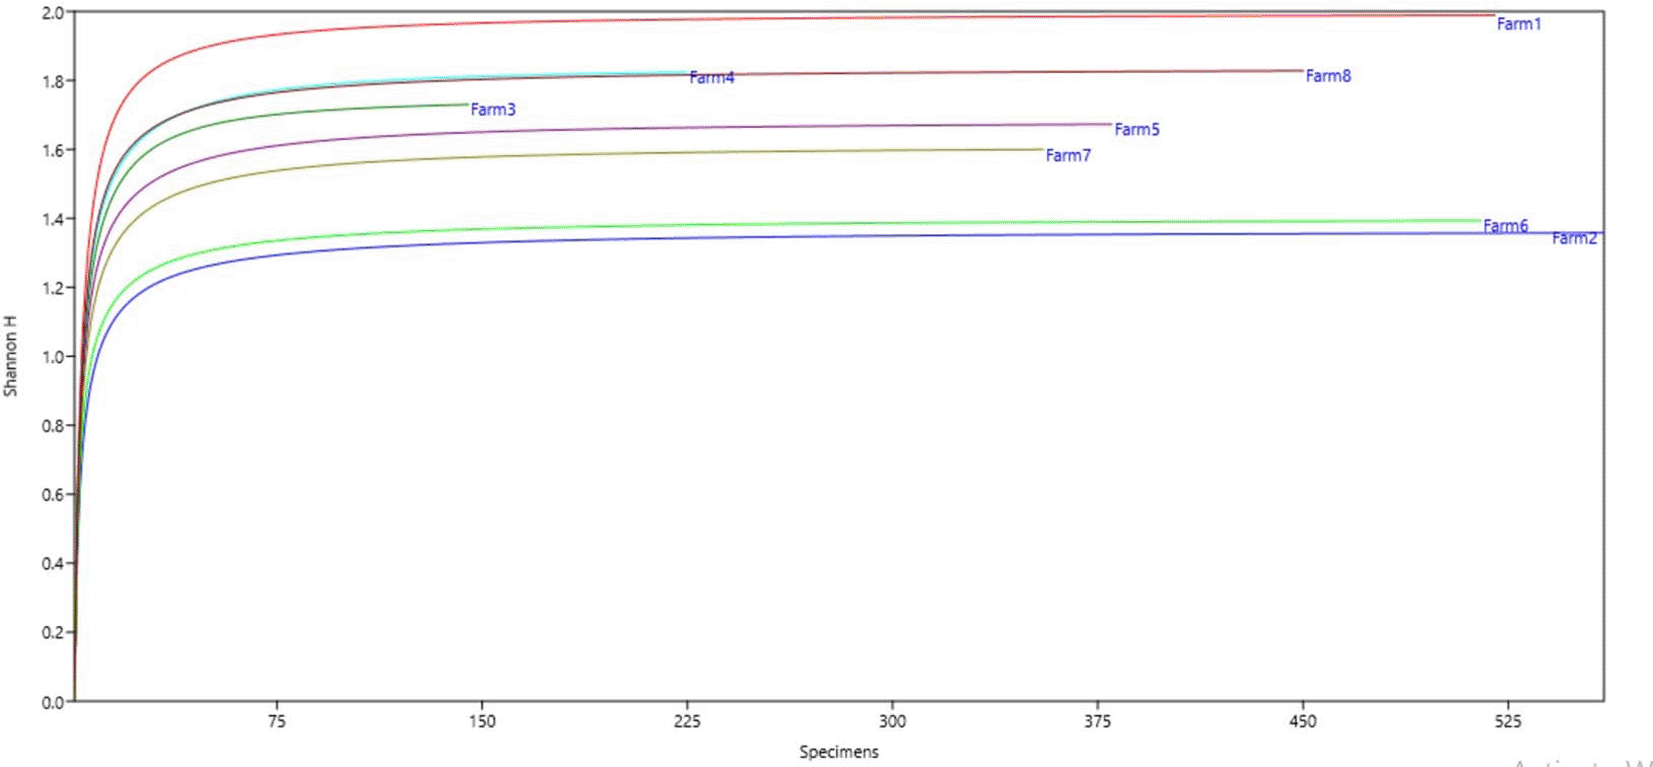
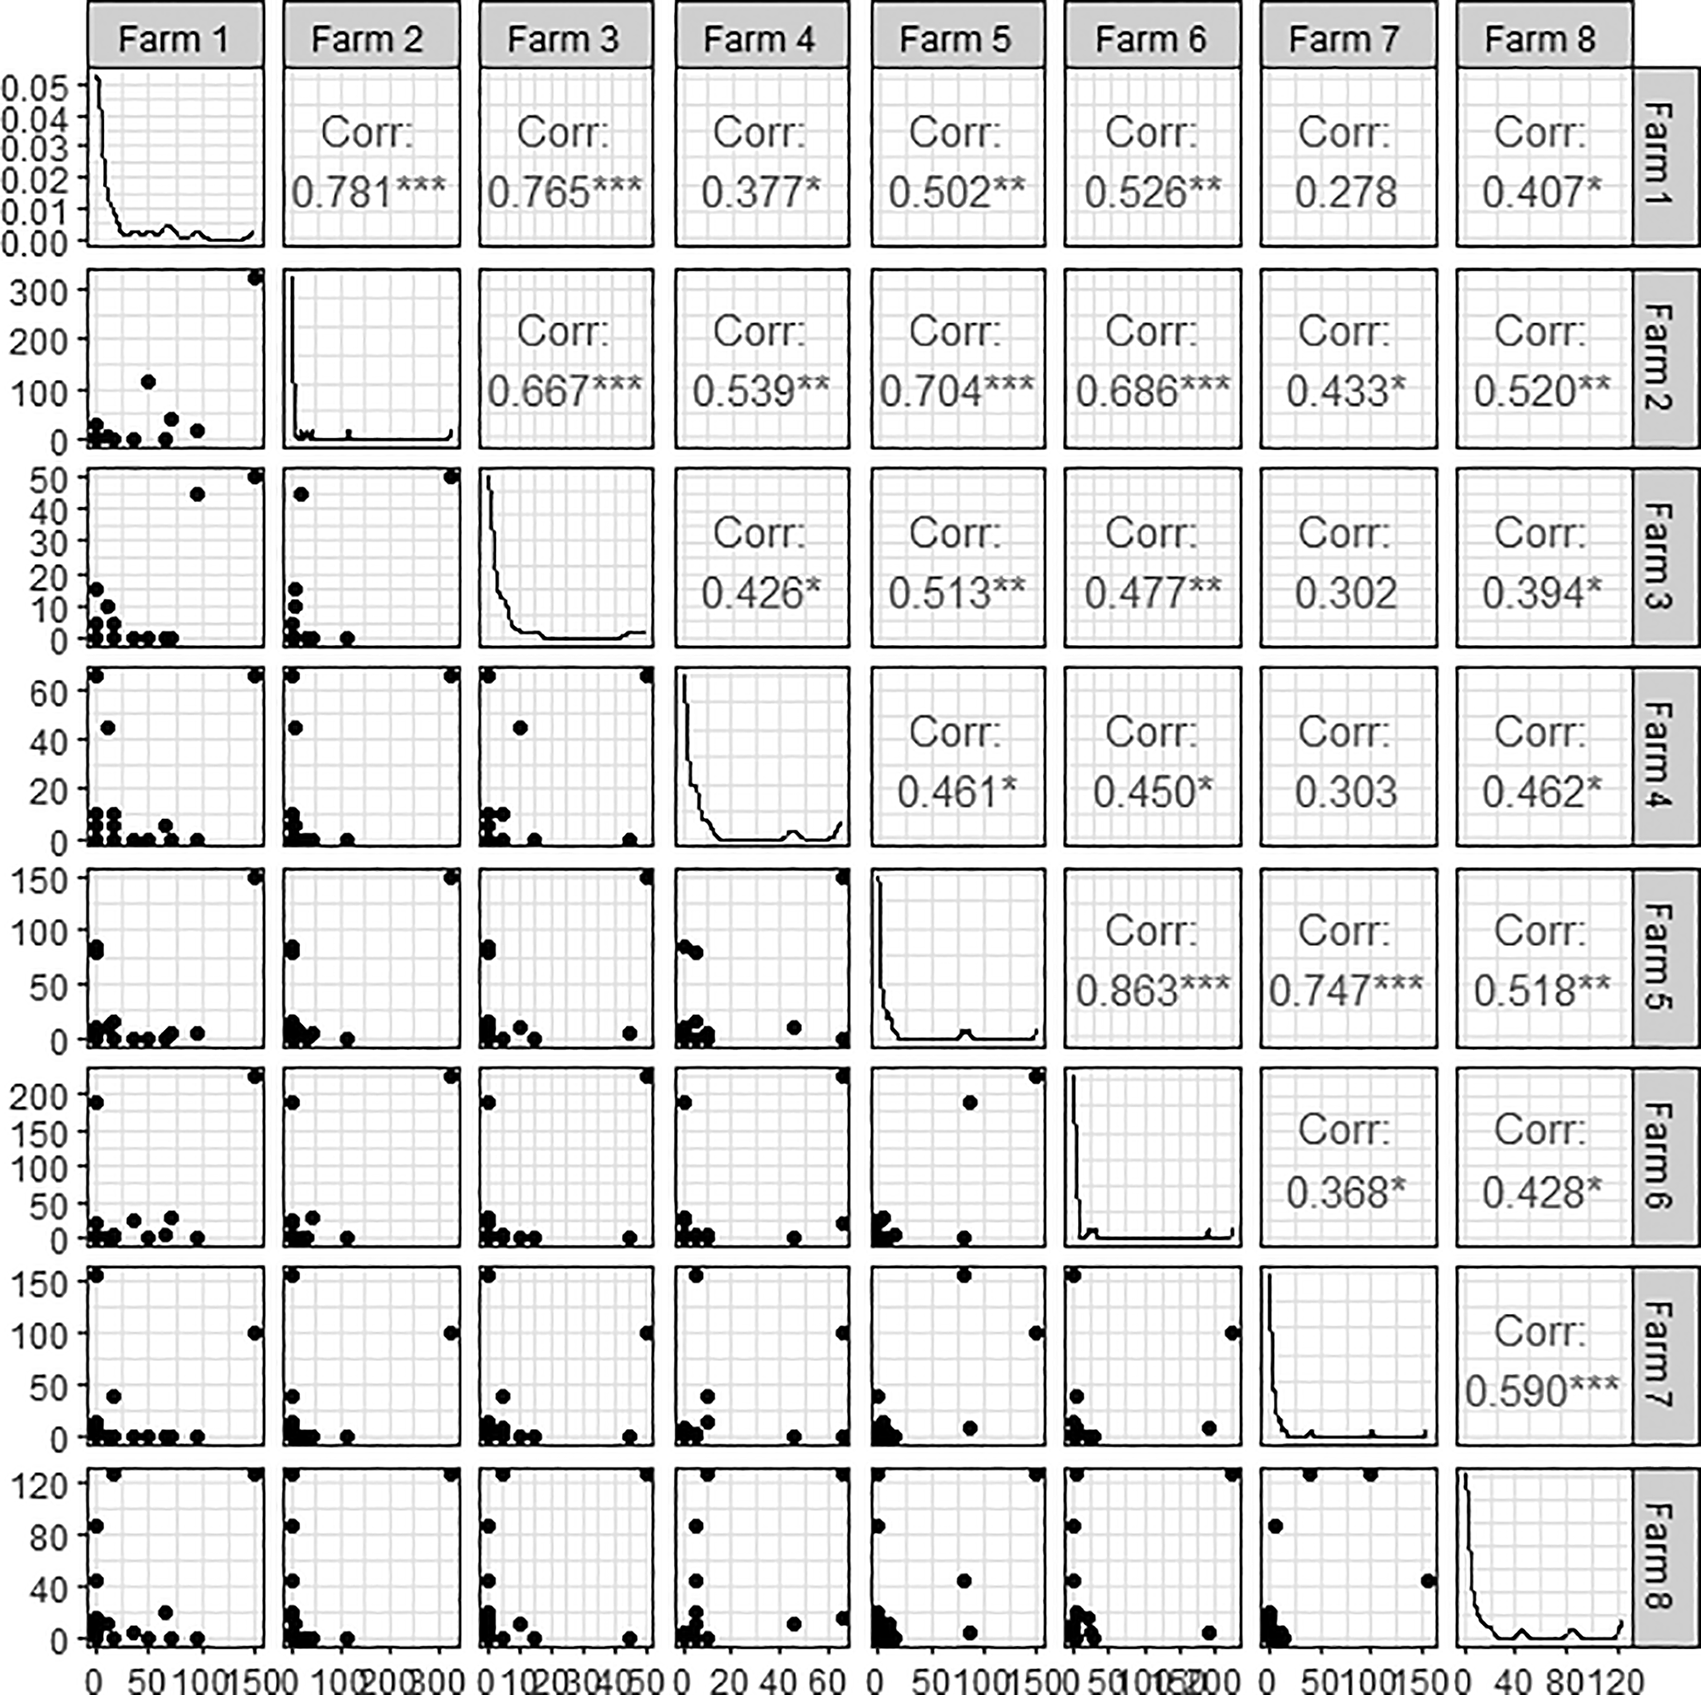
Figure 2 The name of the taxa was changed and improved the quality of the plot. Figure 3 added worm and Hymenoptera for the X-axis and the productivity for the Y-axis. Figure 4 added taxa richness. Fig. 5 and 6 were added, Fig. 5 refers to the Shannon Index, and Fig 6 refers to the Pairwise Person correlation plot.
Table 2 improved the Latitude and Longitude. Table 3 and 4 was changed the title. Table 5 was changed the taxa and not the species. Was translated into ind.m-2, add errors, and remove totals by location. Table 6 corrected the word lumbrices. Table 7 explains how the taxa and individuals improved. Table 8 adds "ind.m-2" not "x m2". Table 9 clarifies what you mean by earthworm production and adds units. Table 10 added banana production.
The text was revised and improved for the English grammar and language. The results were compared with past studies. The word Dominion was changed to Dominance. The number of citations was reduced (no more or three). It described the management of the plots (conventional/organic, tillage, pesticides, fertilization, irrigation, and so on). In the text, sampling is based on litter and monolith extraction and inspired by the TSBF method. Was clarified The size and the sampling area. Was change measured variables by diversity components. In the section Diversity and productivity were clarified regarding extra sampling for this topic. "In four farms the last was added.
Data availability was put from the two sites into one file. We are using the standard reporting template for soil macrofauna communities: https://doi.org/10.5281/zenodo.7691884
See the authors' detailed response to the review by Jérôme Mathieu
See the authors' detailed response to the review by Angel Sol
Soil management in banana agroecosystems is essentially successful for resilient agro-ecological production, adapted to climate change, and biodiversity, fundamentally in Latin America. Berning et al. (2022), Gliessman (2013), Rousseau et al. (2012), and Delgado et al. (2010b) indicate that agro-ecological conditions of the soil represent one of the ways to adapt precisely to the development of production in the banana sector (McLaughlin et al., 1995; Challinor et al., 2009; Rousseau et al., 2013). The combination of Musa acuminata × Musa balbisiana (AAB) constitutes a food source in the Latin American diet (Belalcázar, 2003). For this reason, it is important to develop agricultural practices linked to the benefit of edaphic biodiversity and thus have productive and intensive agriculture characterized by various degrees of intensification of traditional, customary, transitional and organic agriculture (Delgado et al., 2010a). Improving ecosystems and taking advantage of the usefulness of biodiversity in this process requires understanding the structure and function of biological and physical-chemical combinations. They include stability of the edaphic structure, reuse, storage, and supply of organic matter (OM) and nutrients, available soil moisture, and management of damage to micro, and macrofauna.
Similarly, authors such as McKelvie-Sebileau et al. (2022), Samudio (2010), Shiyam et al. (2010), and Gizzi et al. (2009) suggest that in nutritional irrigation systems where crops such as corn, beans, pumpkin, papaya, pineapple, coffee, cocoa are included, they demand the conservation of fungi, bacteria, viruses, harmful insects, nematodes and weed organisms, to do more effective environmental perceptions and producer profitability (López, 1995; MIFIC, 2007).
Likewise, Gutiérrez-Luna et al. (2022), Rodríguez et al. (2013) and Brown et al. (2001) investigated that the impact of cultural practices or soil health should be evaluated through chains that maintain soil fertility. From this perspective, soil fertility studies of plantain should include previously unexplained constituents of the macrofauna as indicators of the richness in biodiversity, abundance, and degree of alteration of the ecological functions of the population.
On the other hand, invertebrate pests attract a lot of attention, and they cost farmers and producers millions of dollars (Tresson et al., 2022; Velásquez et al., 2012; Alcaraván, 2003; Decaëns et al., 2004; Cardona et al., 1998).
Brown et al. (2001) and Pocasangre, Brown and Quesada (2009) show that limited physical-chemical elements and fertility can lead to population decline. In the same way, they added that beneficial invertebrates for their basic and fundamental functions have received little attention. In general, Velasquez et al. (2007) shows that their behavior is taken for granted and the management of agroecosystems is rarely altered for their benefit. The importance of the invertebrate edaphic macrofauna is closely related to the quantitative and qualitative analysis of biomass period (MO) and generation of genetic biology components.
Medina et al. (2021), Djigal et al. (2012), Laossia et al. (2008) and Ruiz (2008) indicate that these organisms can experience a shortage of oxygen and light, fewer open spaces, poor availability and quality of food and a very strong variability of microclimates to be able to live in the soil, examples of these microorganisms are the centipedes, termites, earthworms, insects, mites, flying worms and butterflies (Medina et al., 2021). Populations of all megafaunas reach millions per hectare and their biomass varies in tons per hectare (Priego-Castillo et al., 2009; Wardle et al., 1995). Their diversity can exceed 1,000 species in complex ecosystems (such as tropical forests), but precise data on the specific diversity of tropical edaphic megafauna in specific ecosystems is still lacking (Anderson, 1993; Zerbino, 2010; Zerbino et al., 2008).
This work focused on evaluating the diversity and abundance of macrofauna in eight banana-producing farms in the North Pacific area of Nicaragua. The sampling was based on litter and monolith extraction and is inspired by the TSBF method (Soil Monolith; MAD-N and MAD-S: Mulch scrutiny; FORM-E and FORM-O: soil washing with formaldehyde; CD: Direct capture). The period of sampling was in 2020 year. The taxa covered were Richness (number of species), DAFGA (RRID:SCR_003319), Relative abundance (Density number of individuals 1 m2 for each species), Functional Groups (Density number of individuals 1 m2 for each species), Shannon-Wiener Index (SW), Margalef Diversity Index, Proportional abundance indices, Dominance indices, Simpson index, Equity indices, and Pielou index. The taxonomical resolution depends on the degree of differentiation of morphological characteristics within the individual tribes, so in this studies the diversity by functional groups. Table 6 it is organized the Taxonomic classification of the edaphic macrofauna in kingdom, phylum, subphylum, class, order, family and genus (Zuniga-Gonzalez et al., 2022b).
Table 1 shows the statistical description of the data used in this study. The full protocol can be found on protocols.io. The data descripts the total population of species collected in litter strata by 0-20 cm2 soil depth. The first column refer the number of farm studied, four in Leon municipally and other four in Posoltega municipally. The second column descript the number of species find in each find identified by 30 genus. The third and fourth column refer the maximum and minimum of ind. x species find in each farm. The column fifth, sixth and seventh refer the mean, Std. Desviation and variance of the ind. x species find by each farm.
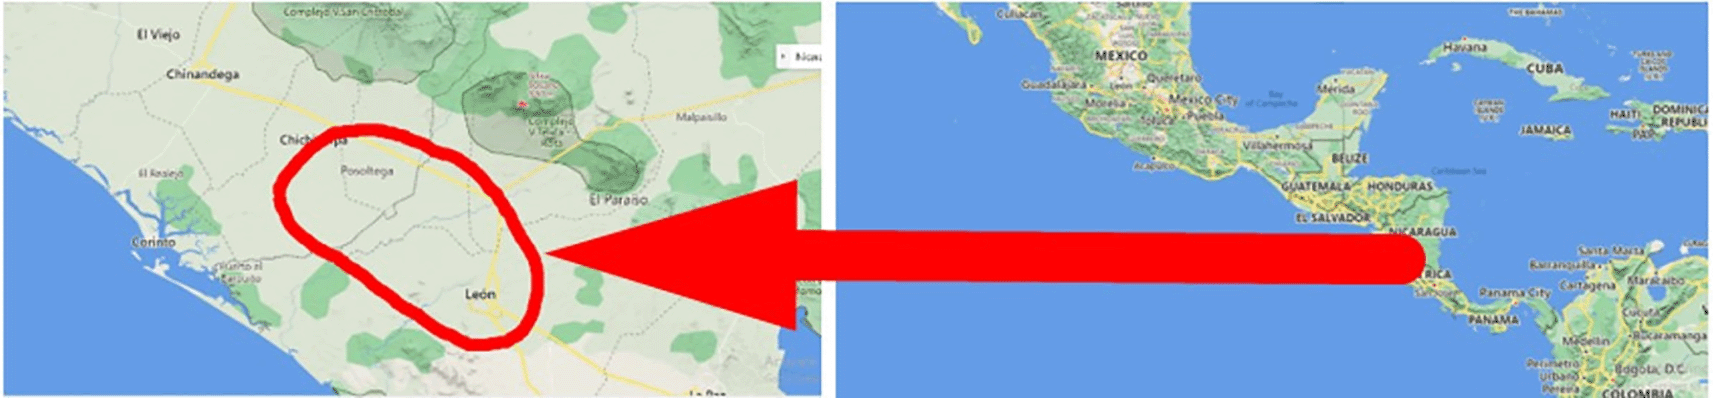
The study was carried out in eight banana farms in the city of León and Posoltega (Table 2). The climatic conditions in the León area are characterized by having a rainfall of 1,529.7 mm, an average temperature per year of 38°C, and an altitude of 60 meters. The Posoltega area is characterized by an average annual temperature of 39°C, 2,000 mm of rain and an altitude of 70.42 meters above sea level, both areas are located in the western region of Nicaragua, see Figure 1 (MIFIC, 2007).
The 8 selected farms or plots are in a process of changing production systems. Previously, these farms had a monoculture production system. These were annuals like cotton, peanuts, sugar cane. These systems heavily used insecticides and mechanized labor. However, these farms are currently moving to a production system from conventional to organic or agroecological production. The cultivation of Musa acuminata × Musa balbisiana (AAB) is managed in association with horticultural items, changing chemical inputs for organic ones, such as the use of organic fertilizers and good agricultural practices. Administratively, the farms in Chinandega are managed by cooperatives, while those in Leon are managed by individual producers.
Table 2 and 5 show eight farms that describe the name, area, community and municipality. In these farms, the investigation begins with the field phase where 40 edaphic samples of 0–20 cm depth and 40 biomass samples (leaf litter) were collected on the surface. A total of 80 samples of macrofauna populations were identified, coded, stored in the second phase. The study area in each farm was 0.7 ha delimited 1 in 1,000 m2 (50 cm long × 20 cm wide), as described in Rousseau et al. (2012, 2013), and Medina et al. (2021). The area where the sample was collected are: Farm1 246.5 ha, Farm2 14.1, ha, Farm3 67 ha, Farm4 7 ha, Farm5 4.2 ha, Farm6 2.1 ha, Farm7 3.5 ha, Farm8 4.9 ha. In total 80 sample were collected in 1000 m2 for 40 biomass sample and 40 edaphic sample in 0-20 cm depth.
After selecting the sampling area, sampling points are placed to collect soil samples. A wooden box 20 cm wide by 20 cm long was used to mark the sampling points, and to remove approximately 1 kg of soil. Divided into two consecutive layers (fallen leaves, 0–20 cm), each of them is surrounded to prevent microorganisms from escaping from the bottom, after which the material is sieved and separated manually and the insects found are placed in an airtight plastic bottle. After measuring 500 cubic centimeters in volume, they are labeled and preserved in 70% alcohol.
The collected individuals were analyzed by order, family and quantified and identified by sex, the microorganisms were placed in Petri dishes and then observed under a 4–400× stereo microscope, to detail the specific structures of each of the species. Large animals include all organisms greater than 1.5 mm in length.
The diversity and richness of species present in this study were analyzed using the indicators reported by the authors Zerbino (2010) and Rousseau et al. (2012, 2013). Richness (number of species): the number is the number of species for each farm, which was determined and totaled for each sampled system. The total number of individuals per species was counted and estimated.
Population abundance and species richness were determined by three main functional groups: herbivores, detritivores, and predators. To estimate the density, PAST (RRID:SCR_019129) 4.03 software was used, the indices selected for the study were: Dominance (D), Shannon-Wiener (H′), Margalef (Mg), Simpson (1-D), and Pielou (J′).
Dominance Index (D): It is the comparative importance of a species related to the degree of influence it has on the individuals of the plantain agro system. It is based on competition for resources, which is why the characterization of the collected sample is used and then organized by functional group. Its inverse is the Simpson index.
Shannon-Wiener Index (H′) (Equation 1): Considers the number of species found in the study area (species richness) and the relative frequency (abundance) of each of these species. It is used to determine the number of species and how those species are distributed. It is usually expressed as H′, expressed as a positive number that varies between 0.5 and 5. Values between 0.5–2 indicate a situation with low diversity, 2–3 is a normal situation, and 3–5 or more indicates a situation of high diversity.
S: Richness or number of species; pi: ratio of individuals of the species (i) with respect to the total number of individuals (that is, the relative abundance of the species i).
Margalef Diversity Index (DMg) (Equation 2): measures the specific richness of an area and the relationship between individuals and the total sample. The value 0 is when there is only one species in the sample (s=1, therefore s-1=0), values less than 2 are considered areas of low biodiversity and values greater than 5 are indicative of high biodiversity. Where:
S = number of species; N = total number of individuals.
Simpson's Index (1-D) (Equation 3): this index is based on dominance. This is the inverse parameter of the concept of community unity or equality. Consider the representativeness of the most important species without evaluating the contribution of the remaining species. Values from 0 to 0.5 bring the value closer to a situation of high diversity, and values from 0.5 to 1 bring the value closer to low biodiversity.
Pi = the number of individuals among the total species (i). Strongly influenced by the importance of the dominant species. Its value is the reciprocal of fairness, so the diversity is known as 1 – λ.
Pielou Index (J) (Equation 4): stock market index. It measures the relationship between the observed diversity and the maximum expected diversity. Its value is between 0 and 0.1, so 0.1 corresponds to situations in which all species occur equally.
Using IBM SPSS Statistics (RRID:SCR_016479) v.22 program, the data of individuals collected and ordered by categories were processed. Tables were created showing the groups of species present in each farm studied. For the analysis of the diversity indices, the PAST (RRID:SCR_019129) 4.03 software was used. Finally, Pearson's correlation was applied to identify the most dominant and most common group useful to understand the dominant interrelationship and its productivity within the plantain agro system.
The results showed that diversity and richness of the edaphic macrofauna was evaluated in eight farms in the western area. A total of 78.72% of the individuals were identified in the soil from 0–20 cm2, while the remaining 21.26% in the foliage. In the first four farms in the León area, 23 genera were found, and in the Posoltega farms, 21 genera. The relative abundance of León was 1,450 individuals per m2, while in the Posoltega area it was 1,700 individuals per m2.
The farms selected for this study have agro-climatic differences and in farm management, the 4 farms in the Chinandega area have a higher rainfall regime and management is by associated cooperatives. The 4 farms in Leon have less rainfall and management is individual, that is, each producer manages his own farm.
Tables 1, 3 and 4, and Figure 2 (Zuniga-Gonzalez et al., 2022a) show the general relative abundance of macrofauna found in the four banana plantations in the city of León between the litter layer and soil depths of 0–20 cm. The genera Geophilus and Leptothorax had dominance with 70 individuals (Ind. m2), Philoscia with 160 Ind. m2 and Oxidus with 110 Ind. m2 and Hypoponera are 165 Ind. m2, and earthworms are 590 Ind. m2. In theses plots was less mulch and leaf litter in the streets of the plantation. In the municipality of Posoltega, Pheidole sp. 280 Ind. m2, Solenopsis sp. 290 Ind. m2, Asiomorpha 170 Ind. m2, Earthworm 600 Ind. m2. A characteristic of the Chinandega area is that there was more leaf litter on the ground, covered ground, higher soil moisture, more vegetation between the streets (Tables 5 and 6). The genus Pheidole sp., was found in the soil of a banana plantation in the city of León, and the genus Solenopsis. However, the frequencies of Earthworm individuals are similar in both communities. Zerbino et al. (2008) presented the two most abundant groups of the subclass Oligochaeta of the order Opisthopora and insects of the order Hymenoptera, representing 46 and 20% of the total number of individuals collected, respectively. This confirms our findings with earthworms (Opisthopora) and Hymenoptera (Pheidole and Solenopsis) accounting for 37.77 and 18.25%, respectively, of all individuals collected.
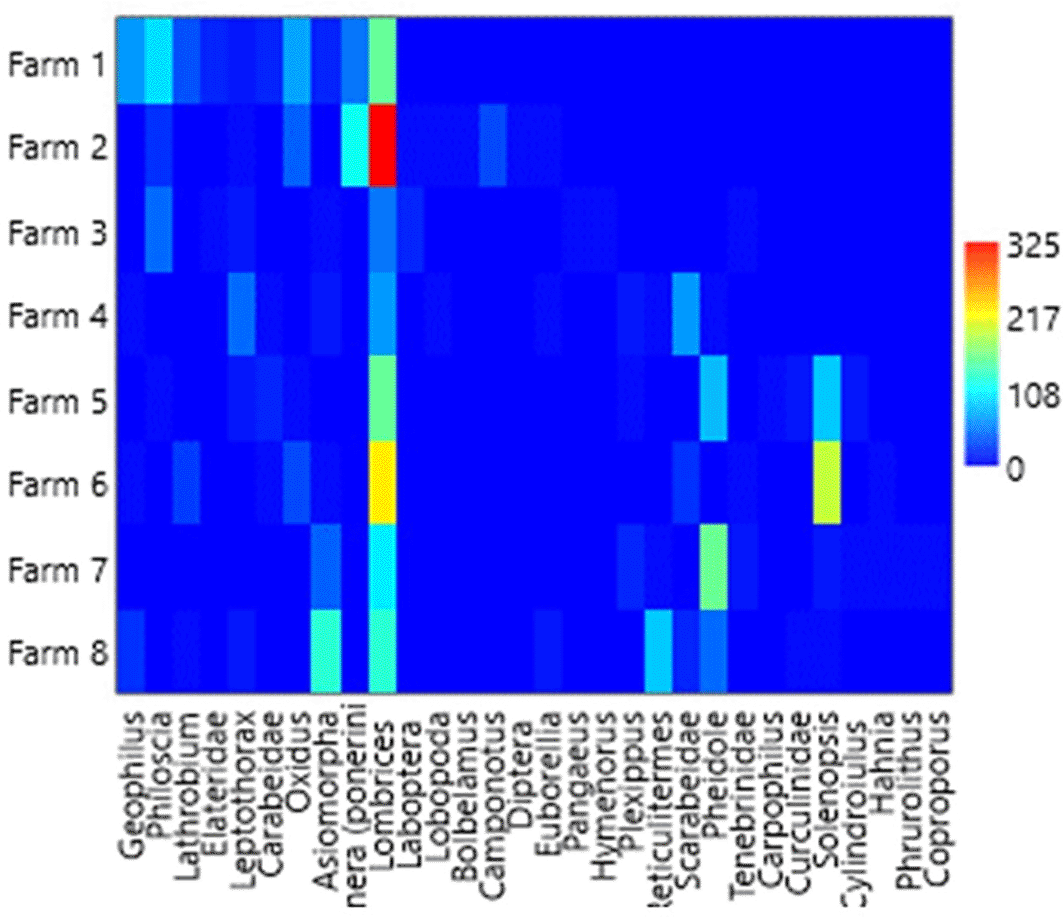
This heatmap was constructed using PAST software.
In a study by Priego-Castillo et al. (2009) and Castillo and Vera (2000), reported that the Hymenoptera group was the most abundant, with 62.49% of the total individuals collected during the 2,000 agricultural cycle in organic and conventional banana plantations in Guacimo, Costa Rica. This means that the soil is moist throughout the year. However, the presence of Earthworms (Opisthopora) was 11.92% and abundant in all stages, this is due to rainfall patterns, that is, humidity, although rainfall is higher in Chinandega.
In the municipality of Leon, Farm 1 shows that Earthworms dominated at 150 Ind. m2 and Oxidus dominate with 70 Ind. m2. In farm 2, Earthworms dominated at 325 Ind. m2, and Hypoponera spp. with 115 Ind. m2, likewise in farm 4 El Verdón, stand out, genus Leptoxthorax (Opisthopora) of 45 Ind. m2, 65 Ind. m2 of Scarabaeidae and 65 Ind. m2 of Earthworms, however, in farm 3, only the genus, Philoscia, in Farm 3, measures 45 Ind. m2 and Earthworms dominated at 50 Ind. m2 (Tables 5 and 6). The municipal of León has a greater wealth of sexes with 23 representative genus, but a lower overall dominance (Ind. m2). In four farms (San Martín, Santa Isabel, Quinta Cony, and El Verdon) Earthworm frequencies were found to be similar, but less common genera such as Leptothorax and Asiomorpha were found. climatic conditions and agroecological management are factors that have influenced these results that are similar to Priego-Castillo et al. (2009) in Costa Rica.
These data on Earthworm populations in litter and layers from 0 to 20 cm2 have been confirmed by Castillo and Vera (2000), Pashanasi (2001), Zerbino (2010), and these populations have a beneficial role in the soil. Training is very important and sensitive to management practices in the banana farms of León and Posoltega. In this area, the rains have created favorable conditions for the macrofauna and the management of the soil make these results more notable than in Leon.
Table 4 shows the relative abundance by farm and by functional group, noting that the detritivores group is more abundant, followed by predators. The leaf litter and humidity conditions make organic matter a propitious environment for the detritivores group. These dominance groups exerted a beneficial function on the soil, allowing increased production yields because they are the responsible for breaking down OM and providing nutrition for plants (Brown et al., 2000).
For the municipality Posoltega, in farm 6, earthworms dominate with 225 Ind. m2 and Solenopsis spp. with 190 Ind. m2, farm 8 had Asiomorpha spp. with 125 Ind. m2 (Tables 5 and 6). Plantain farms in Posoltega are repopulated with Solenopsis worms and ants (Pashanasi, 2001; Zerbino, 2010; Rousseau et al., 2012). This is likely because they occupy the same ecological niches in which they coexist, interact with similar food sources, land, husbandry and management skills, and benefit from abundant and prosperous communities. These data are supported by Zayas et al. (2022), Quiroz-Medina et al. (2021), Castillo y Vera (2000), and Rousseau et al. (2013).
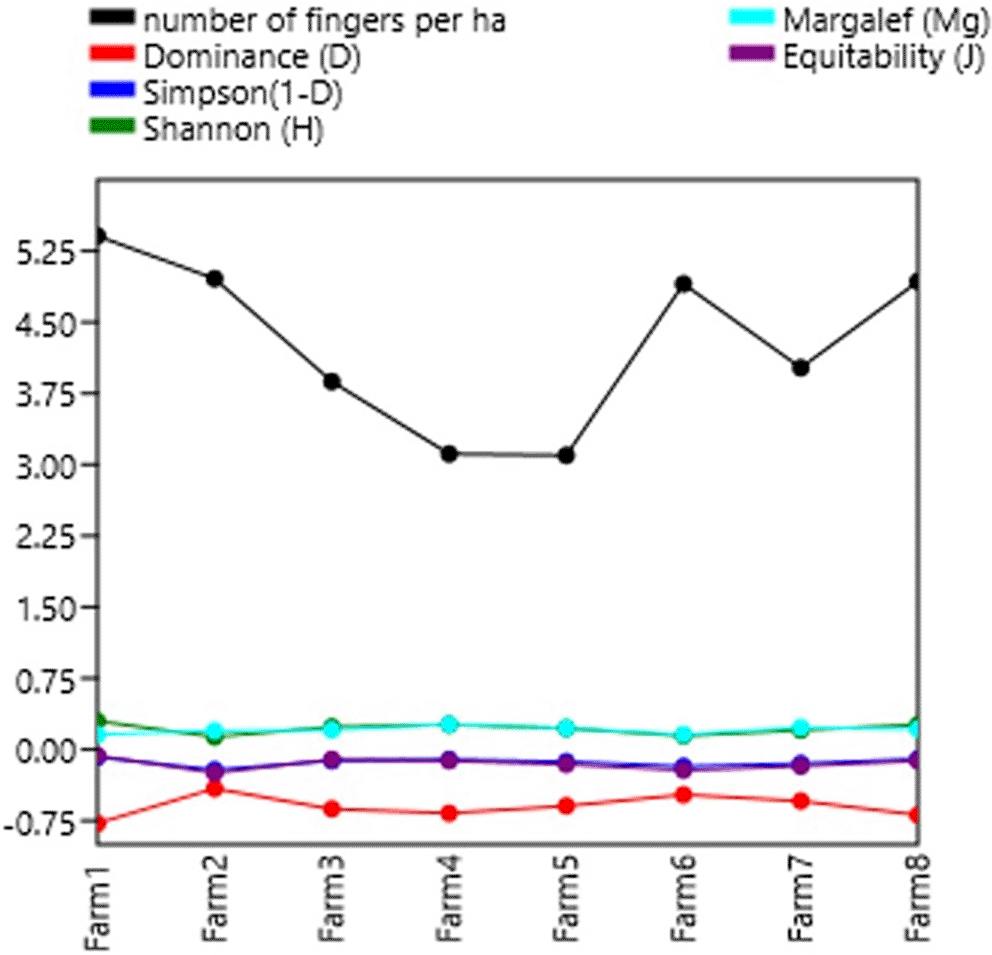
Table 7 shows the diversity indices per farm. In general, the farms studied present a taxonomic variety of biomass (3,150 individuals). In general, a low dominance (less than 40%) is observed in each of the farms. The Shannon-Wiener index shows low diversity with values less than 2, except for farms 1, 4 and 8 with values close to 2, meaning normal diversity. The Shannon indexes are not superior to those of Melo (2010), who had a high diversity value of the Shannon index of H′ = 2.61, which indicates that the Kikuyu prairie has the highest richness in both families and organisms. Rousseau et al. (2012, 2013), present low-quality data on diversity, dominance, wealth, and stock market indices.
The Simpson index confirms this low diversity with values close to 1. The specific richness of the area and the relationship between individuals and the total sample reflected by the Margalet index (DMg) with values less than 2. This is considered as areas of low biodiversity. The Pielou evenness index indicates that not all farms presented situations where all species were equally abundant (Krebs, 1999).
Table 3 shows a summary of the relative abundance of biodiversity in the study area by functional group (Castañeda et al., 2022; Quiroz-Medina, 2021). As mentioned above, the species equity indices are not equal. The lowest percentage of taxonomic presence is in the functional group of herbivores. The biomass has a greater presence (above 50% in the group by function of detritivores and in the group of predators below 50%).
In studies reported by Zerbino et al. (2008) and Zerbino (2010), shown that the discrepancies in the constitution of the megafauna’s community and proportions of functional groups are aspects influenced by the species, the richness of plant species and management, and states that it affects living organisms. This is because they determine the available resources and influence the interactions between herbivores, their controllers, and the destroyers identified by Moore et al. (2004).
This supports the findings regarding the fact that monoculture influences the available resources and, therefore, is capable of affecting the interactions between functional groups Ind. m2 in the city of Posoltega. The results indicated that the texture of the biocenosis is consistent with the edaphic properties and the quantity and quality of the residues (Almonte, 2022; Leyva, 2012; Curry, 1992). In zero tillage, management practices that promote the presence of residues with spatial and temporal diversification of plant species have richer, more diverse and equitable communities, with a predominance of deterioration functional groups (Priego et al., 2009; Zerbino, 2010; Zerbino et al., 2008). This is consistent with the findings in the present study.
The analysis confirmed that Posoltega had lower populations of herbivores per m2 and 460 carnivores per m2 (Table 3). This confirms the conditions for the detritivores with the decomposition of the organic matter that produces the rainy regime and the greatest amount of litter.
Table 8 shows the diversity indicators by functional groups. These are predominantly detritivores of 400 Ind. m2, and predators 205 Ind. m2, in contrast to El Verdón on farm 4, which has a low population of herbivores of 45 Ind. m2, detritivores 150 Ind. m2 due to the large population of predators found. Similarly, at Farm 8 Los Angeles there were only 10 Ind. m2 herbivores. This is due to the large population of 85 Ind. m2 predators, also to the agro climatilly conditions (Tables 3-5 and 6).
The data collected in the León area show that the herbivorous functional group has a low proportion of Diversity by the values of the Shannon-Wiener index (H) with a value close to 1 denoting low diversity, this is considered within normality, Dominance Simpson (1-D) with a value close to 1 and Pielou Equity (J′) very close to 1 as in the case of farm 2, meaning equally abundant species. However, the Margalef Diversity Index (DMg) showed a value below 2 considering for areas of low diversity, similar to the work of Frederick et al. (2018).
Three indicators dominance in the functional group of detritivorous organisms in the city of León. Margalef Diversity (DMg) with a value below 2 means that no farm with this group can be considered as having high diversity. For Simpson Dominance (1-D) it can be said that they are at a midpoint between 1 and 0 with a normal diversity and a Pielou Equity Index (J′) with a value close to 1 situation where all species are equally abundant, of the indices for the Predators group were dominated by three indices: DMg in farm 4, which almost reaches value 2, it can be said that they are within the normal range, and Shannon-Wiener Diversity (H) with values lower than 1 indicating low diversity. This contrasts with the Posoltega area, where Simpson (1-D) dominates with a value close to 0, which implies a high diversity, these organisms are favored because on these farms, litter was found in the alleys creating decomposing matter favored by humidity (Depaquit et al., 2016).
Table 8 shows the estimates of the indices of population abundance and species richness, determined by functional groups. According to the DMg, the value found was less than 2 considered as a zone of low biodiversity, which assumes that the number of individuals is equal to the number of species. In the Simpson index, the probability that eight individuals taken at random are of the same species is 0.2 in the case of León and 0.19, this constitutes a low probability, since most of the farms are made up of the genus Earthworms, and that had a lot of abundance of the same species. The Pielou Equity Index (J) confirms these with values close to 1 where all species are equally abundant (Bottinelli et al., 2010).
Samples were taken for the comparative study between plantain production and the two most abundant genera, earthworms and Hymenoptera, both of which are beneficial in the decomposition of OM and the supply of nutrients to the plant. In the dominance of worms, the Quinta Cony (Farm 2) was found where 325 Ind. m2 collected, followed by the Montes Verde farm (Farm 6) with 225 Ind. m2. Hymenoptera were dominant on the San Joaquín farm (Farm 5) with 175 Ind. m2 and on farm 7 with 165 Ind. m2 (Pimentel et al., 1997) (Table 9 and Figure 3).
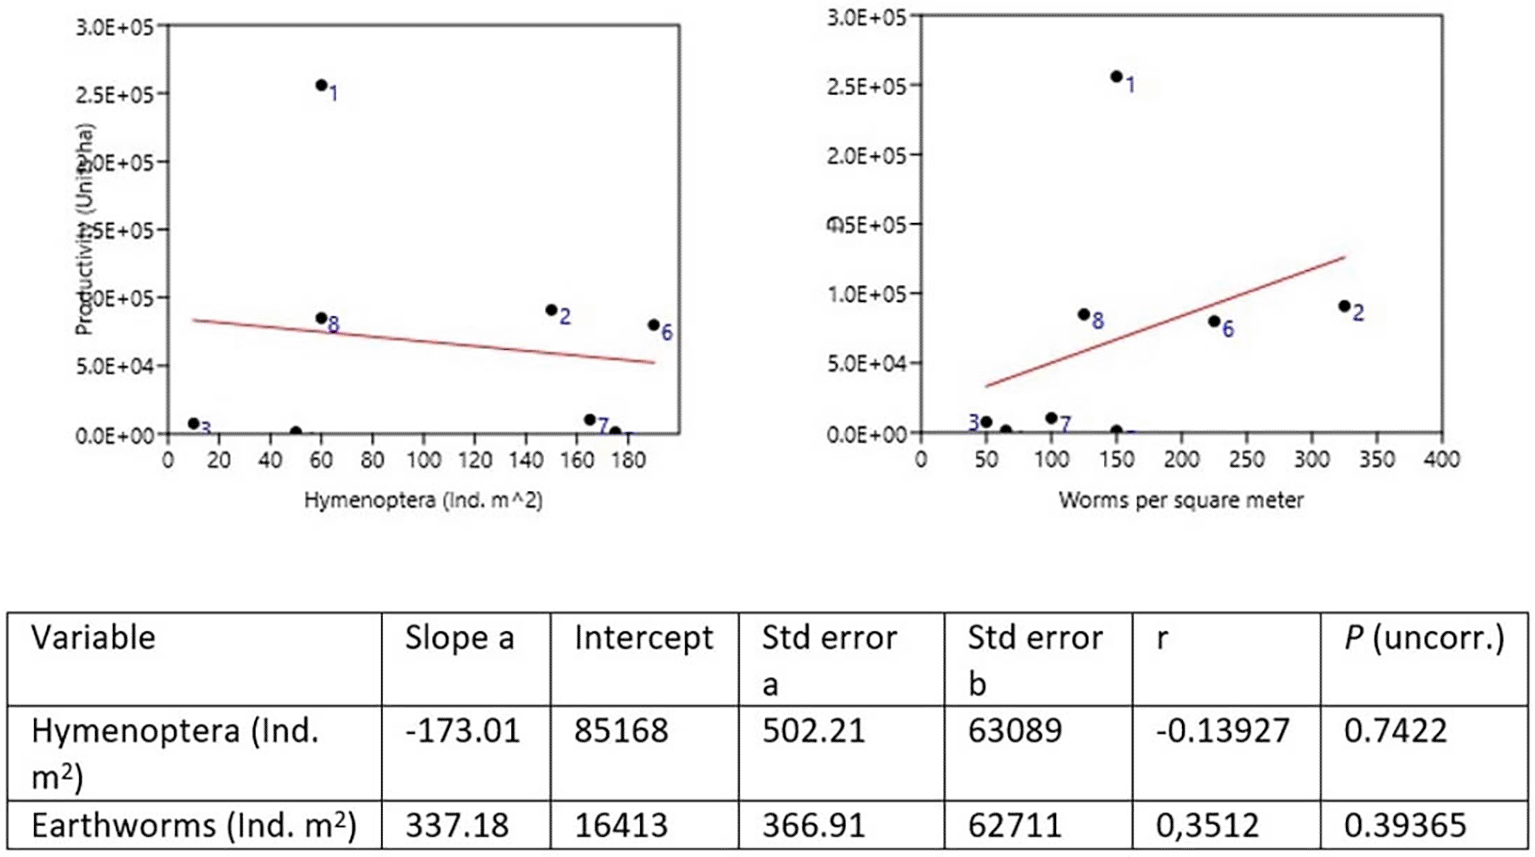
To compare the psyllium production of each farm, the proportion of worms and insects of the two most abundant genera, the order Hymenoptera, was taken, indicating that a greater number of worms indicates a greater production. It was observed that for Hymenoptera, the production is lower. The farms with the highest production in the León area were Quinta Cony with 91,000 ha and Santa Isabel with 25,600 ha. The farm of 80,000 ha in farm 8 and farm 6 with 85,000 ha in Montes Verdes for the Posoltega area (Figures 3, 4 and 5).
Pearson's correlation analysis commonly correlates agricultural production (plantain units ha) and the abundance of earthworms and hymenopteran insects, projecting a correlation close to 1 with 95% confidence. The relationship between plantain production per ha and the abundance of earthworms of Ind. m2 establishes a direct relationship, with a Pearson correlation coefficient of 0.743, close to 1, and a perfect or strong relationship in the Pearson correlation analysis (Table 10). That is, by increasing the number of earthworms in the soil, the production of plantain per ha increases in the farms studied in both regions (León and Posoltega). On the other hand, a Pearson correlation coefficient of 0.261 (Table 9) was obtained, which indicated that the relationship between production and abundance of Hymenoptera is very close to 0, thus showing a weak correlation between production and abundance of Hymenoptera insects (Ma et al., 2022).
| Study zone | Banana Production | Earthworms | Hymenopteras |
|---|---|---|---|
| Both areas | |||
| Banana Production | 0.743* | 0.261* | |
| Earthworms | 0.743* | 0.608* | |
| Hymenopteras | 0.261* | 0.608* | |
| León | |||
| Banana Production | 0.988* | 0.942* | |
| Earthworms | 0.988* | 0.968* | |
| Hymenopteras | 0.942* | 0.968* | |
| Posoltega | |||
| Banana Production | 0.465* | -0.484* | |
| Earthworms | 0.465* | 0.469* | |
| Hymenopteras | -0.484* | 0.469* |
The city of León has three strong ties. The first relationship (Pearson correlation coefficient 0.988) between productivity (psyllium units per ha on the farm) and earthworm abundance (Table 10) shows a strong correlation. The second relationship between productivity and abundance of Hymenoptera insects has a Pearson correlation coefficient of 0.942 (Table 10), indicating a strong correlation. A third relationship between the abundances of earthworms and hymenopteran insects is a Pearson correlation coefficient of 0.968 (Table 10), which is very strong because the coefficient is close to 1, indicating that the number of earthworms becomes a direct relationship as it increases. In the municipality of Posoltega, the relationship between earthworm production and abundance is weak, with a Pearson correlation coefficient of 0.465. A Pearson correlation coefficient of -0.484 (Table 10) indicates a negative relationship, with a decrease in the second abundance ratio of earthworms and hymenopterans. However, the abundance of hymenopteran insects is preserved. The increase in the number of worms increased the production and abundance of Hymenoptera, with a Pearson correlation coefficient of 0.469, favoring a direct relationship. On the other hand, the relationship between the number of hymenopteran insects and production is inversely correlated, with a Pearson correlation coefficient of -0.484 (Table 10). That is, as the number of Hymenoptera decreases, production decreases (Table 10). Table 11 and Figure 6 show the Pearson correlation coefficients by farm.
| Farm1 | Farm2 | Farm3 | Farm4 | Farm5 | Farm6 | Farm7 | Farm8 |
|---|---|---|---|---|---|---|---|
| 1 | .781** | .765** | .377* | .502** | .526** | .278 | .407* |
| .781** | 1 | .667** | .539** | .704** | .686** | .433* | .520** |
| .765** | .667** | 1 | .426* | .513** | .477** | .302 | .394* |
| .377* | .539** | .426* | 1 | .461* | .450* | .303 | .462* |
| .502** | .704** | .513** | .461* | 1 | .863** | .747** | .518** |
| .526** | .686** | .477** | .450* | .863** | 1 | .368* | .428* |
| .278 | .433* | .302 | .303 | .747** | .368* | 1 | .590** |
| .407* | .520** | .394* | .462* | .518** | .428* | .590** | 1 |
The Shannon-Wiener (H′) Diversity values were in the range of 1.6–1.9, which indicates a situation of low diversity, Margalef Diversity (D) obtained values between 1.4–1.8, lower than 2, considered as areas of low biodiversity, the Simpson's dominance (1-D) presented values between 1.4–1.8, considering that the closer it is to 1, a situation of low diversity is considered, and that of equality of Pielou (J′) presents 5-.8, so that the values close to 1 correspond to situations where all species are equally abundant. These results were due to the relative abundance of two detritivore genera (earthworms and Hymenoptera), which are organisms that decompose OM and provide nutrients to the plant.
Finally, it is concluded that these two genera are important in the production of the plantain agro system due to the decomposition of OM and its nutritional contribution to the plant, observing a direct correlation with earthworms and an indirect one with Hymenoptera.
| Views | Downloads | |
|---|---|---|
| F1000Research | - | - |
|
PubMed Central
Data from PMC are received and updated monthly.
|
- | - |
Provide sufficient details of any financial or non-financial competing interests to enable users to assess whether your comments might lead a reasonable person to question your impartiality. Consider the following examples, but note that this is not an exhaustive list:
Sign up for content alerts and receive a weekly or monthly email with all newly published articles
Already registered? Sign in
The email address should be the one you originally registered with F1000.
You registered with F1000 via Google, so we cannot reset your password.
To sign in, please click here.
If you still need help with your Google account password, please click here.
You registered with F1000 via Facebook, so we cannot reset your password.
To sign in, please click here.
If you still need help with your Facebook account password, please click here.
If your email address is registered with us, we will email you instructions to reset your password.
If you think you should have received this email but it has not arrived, please check your spam filters and/or contact for further assistance.
Comments on this article Comments (0)