Keywords
methylation, outlier, rare disease, diagnostic odyssey
This article is included in the Bioinformatics gateway.
This article is included in the Bioconductor gateway.
methylation, outlier, rare disease, diagnostic odyssey
Multiple inborn diseases resulting from disorders of genomic methylation are well characterized. A growing body of literature reports associations between DNA methylation and conditions including Parkinson’s Disease (Chuang, et al., 2017) and methylation-based studies have also suggested the causative or correlative role of aberrant methylation in diverse rare inherited conditions (Guastafierro, et al., 2017; Sharp, et al., 2017; Sobreira, et al., 2017).
Methods for profiling DNA methylation traditionally focused on wide genomic regions, particularly CpG islands. While microarray methylation profiling continues to be utilized, next-generation sequencing has enabled analysis at read count-level resolution and greatly increased numbers of genomic CpG sites (Wu, et al., 2015). High-resolution methodologies have enabled complex pictures of methylation to emerge, including association of multiple specific-site or even single-site methylation with developmental processes or disease (Bui, et al., 2012; Choi, et al., 2018; Claus, et al., 2012; Fürst, et al., 2012; Hashimoto, et al., 2013; Nile, et al., 2008; Pogribny, et al., 2000; Scantamburlo, et al., 2017; Sohn, et al., 2010; Takahashi, et al., 2017).
DNA sequencing results in the diagnosis of up to 40% of genetic disease cases previously unsolved using standard clinical testing (Sawyer, et al., 2016). RNA-Seq has been investigated and has shown benefit in complementing DNA testing (Cummings, et al., 2017). With the growing evidence linking methylation to disease, the application of methylation-based sequencing for undiagnosed cases of rare inherited disease is a logical progression from current testing paradigms. Expanded methylation profiling will offer the ability to detect diagnostic signals unique to the epigenome, undetectable in DNA and RNA due to lack of measurable manifestation in those materials, or due to shortcomings in current technologies or analytical approaches.
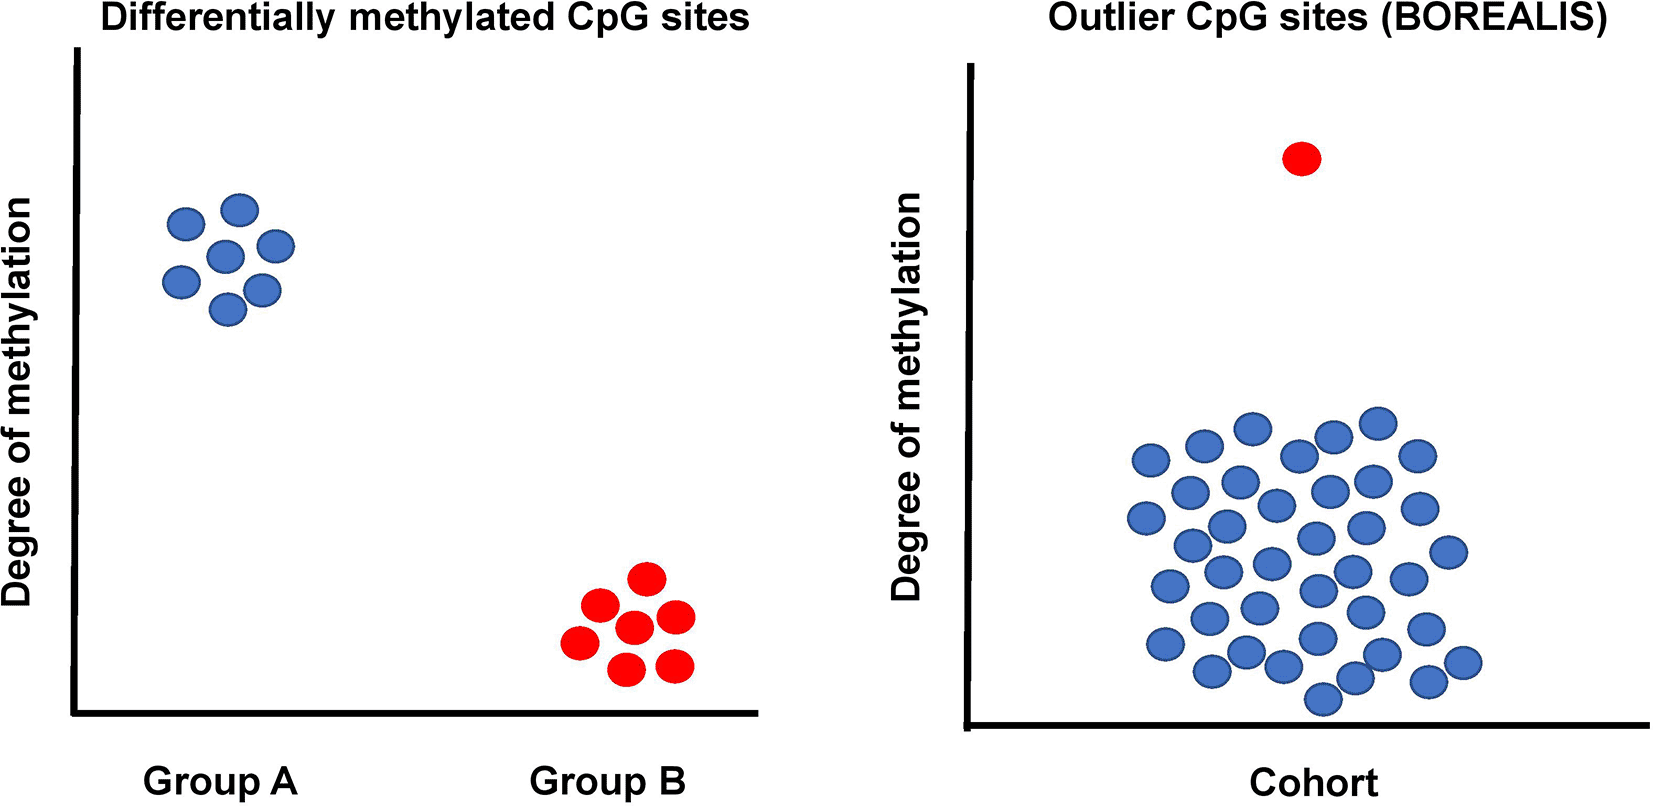
An ideal method to detect deviant methylation should offer the ability to profile at single CpG sites while enabling flexibility to consolidate calls across regions. In the context of genetic disease, we can assume that disease-associated methylation aberrations in an individual will show significant differences from individuals with unrelated phenotypes. A similar rationale was successfully used by us and others in outlier-based RNA analysis (Jenkinson, et al., 2020). However, existing solutions for the detection of differentially methylated CpG sites from bisulfite sequencing focus on traditional group vs group or multi-group experimental designs (Wreczycka, et al., 2017) and are therefore not suited to genetic disease or other outlier-based analyses (Figure 1).

While traditional approaches to differential methylation analysis are based on group case vs. control analysis, BOREALIS utilizes a one vs. many outlier approach whereby individual(s) are compared to a cohort. This approach is especially useful when multiple similar cases are difficult to identify, as is the case in rare genetic disease studies. By comparing every affected individual to a cohort of heterogeneous individuals, outlier methylation can be identified at individual CpG sites for all members of the cohort, without the requirement for multiple similar cases.
At a given CpG site, we assume we have data in the form of methylated counts xi and total read counts ni for individuals i = 1, …, I in a cohort of size I. If every individual in the population had the exact same probability p of methylation at this site, i.e., p1 = p2 = … = pi = p where pi is the (true-but-unknown) probability of methylation for the ith individual at this site, then the methylated counts xi would be binomially distributed with parameters p and ni. However, we expect varying degrees of sample-to-sample variability in the probability of methylation at a given site even in a healthy cohort. Therefore, it is more biologically accurate to assume that pi for i=1, …, I have been sampled from a distribution over the unit interval. A common and mathematically convenient choice for this distribution is a beta distribution with parameters α and β. Thus the observed number of methylated reads xi for the ith individual can be viewed as being generated from a two-step process whereby the probability of methylation is selected pi ~ Beta (α,β) and given this probability the number of methylated reads is binomially distributed xi|pi ~ Binomial (pi,ni). Viewed in this way, we say the methylated reads are beta-binomially distributed xi ~ Beta-Binomial (ni,α,β) with parameters α and β, and popular packages for differential DNA-methylation detection such as Dispersion Shrinkage for Sequencing (DSS) (Feng and Wu, 2019) use this same distribution for methylated counts.
What BOREALIS does differently from traditional tools such as DSS (Park and Wu, 2016) is that it builds its statistical model explicitly for the purpose of outlier detection compared to a cohort, which requires alternative statistical framing and considerations as compared to group-versus-group analyses (Jenkinson, et al., 2020). Specifically, at each CpG site, BOREALIS takes the input data {(xi,ni): i = 1, …, I} and estimates the population-level parameters α and β using gamlss library (https://www.gamlss.com) (Feng and Wu, 2019). We implement Laplace Smoothing on the counts (i.e. we use as counts = xi+1 and = ni+2) as a regularization step to help deal with any samples with low counts. From these estimated α and β parameters, we (for the ith sample) compute the left-sided p-value by looking at the probability that a value of xi or fewer methylated reads were generated from a Beta-Binomial (ni,α,β), and likewise a right-sided p-value would evaluate the probability that a value of xi or greater methylated reads came from this distribution. We implement this probability calculation using the pBB function of gamlss. The two-sided p-value is computed as two times the lesser of these one-sided p-values.
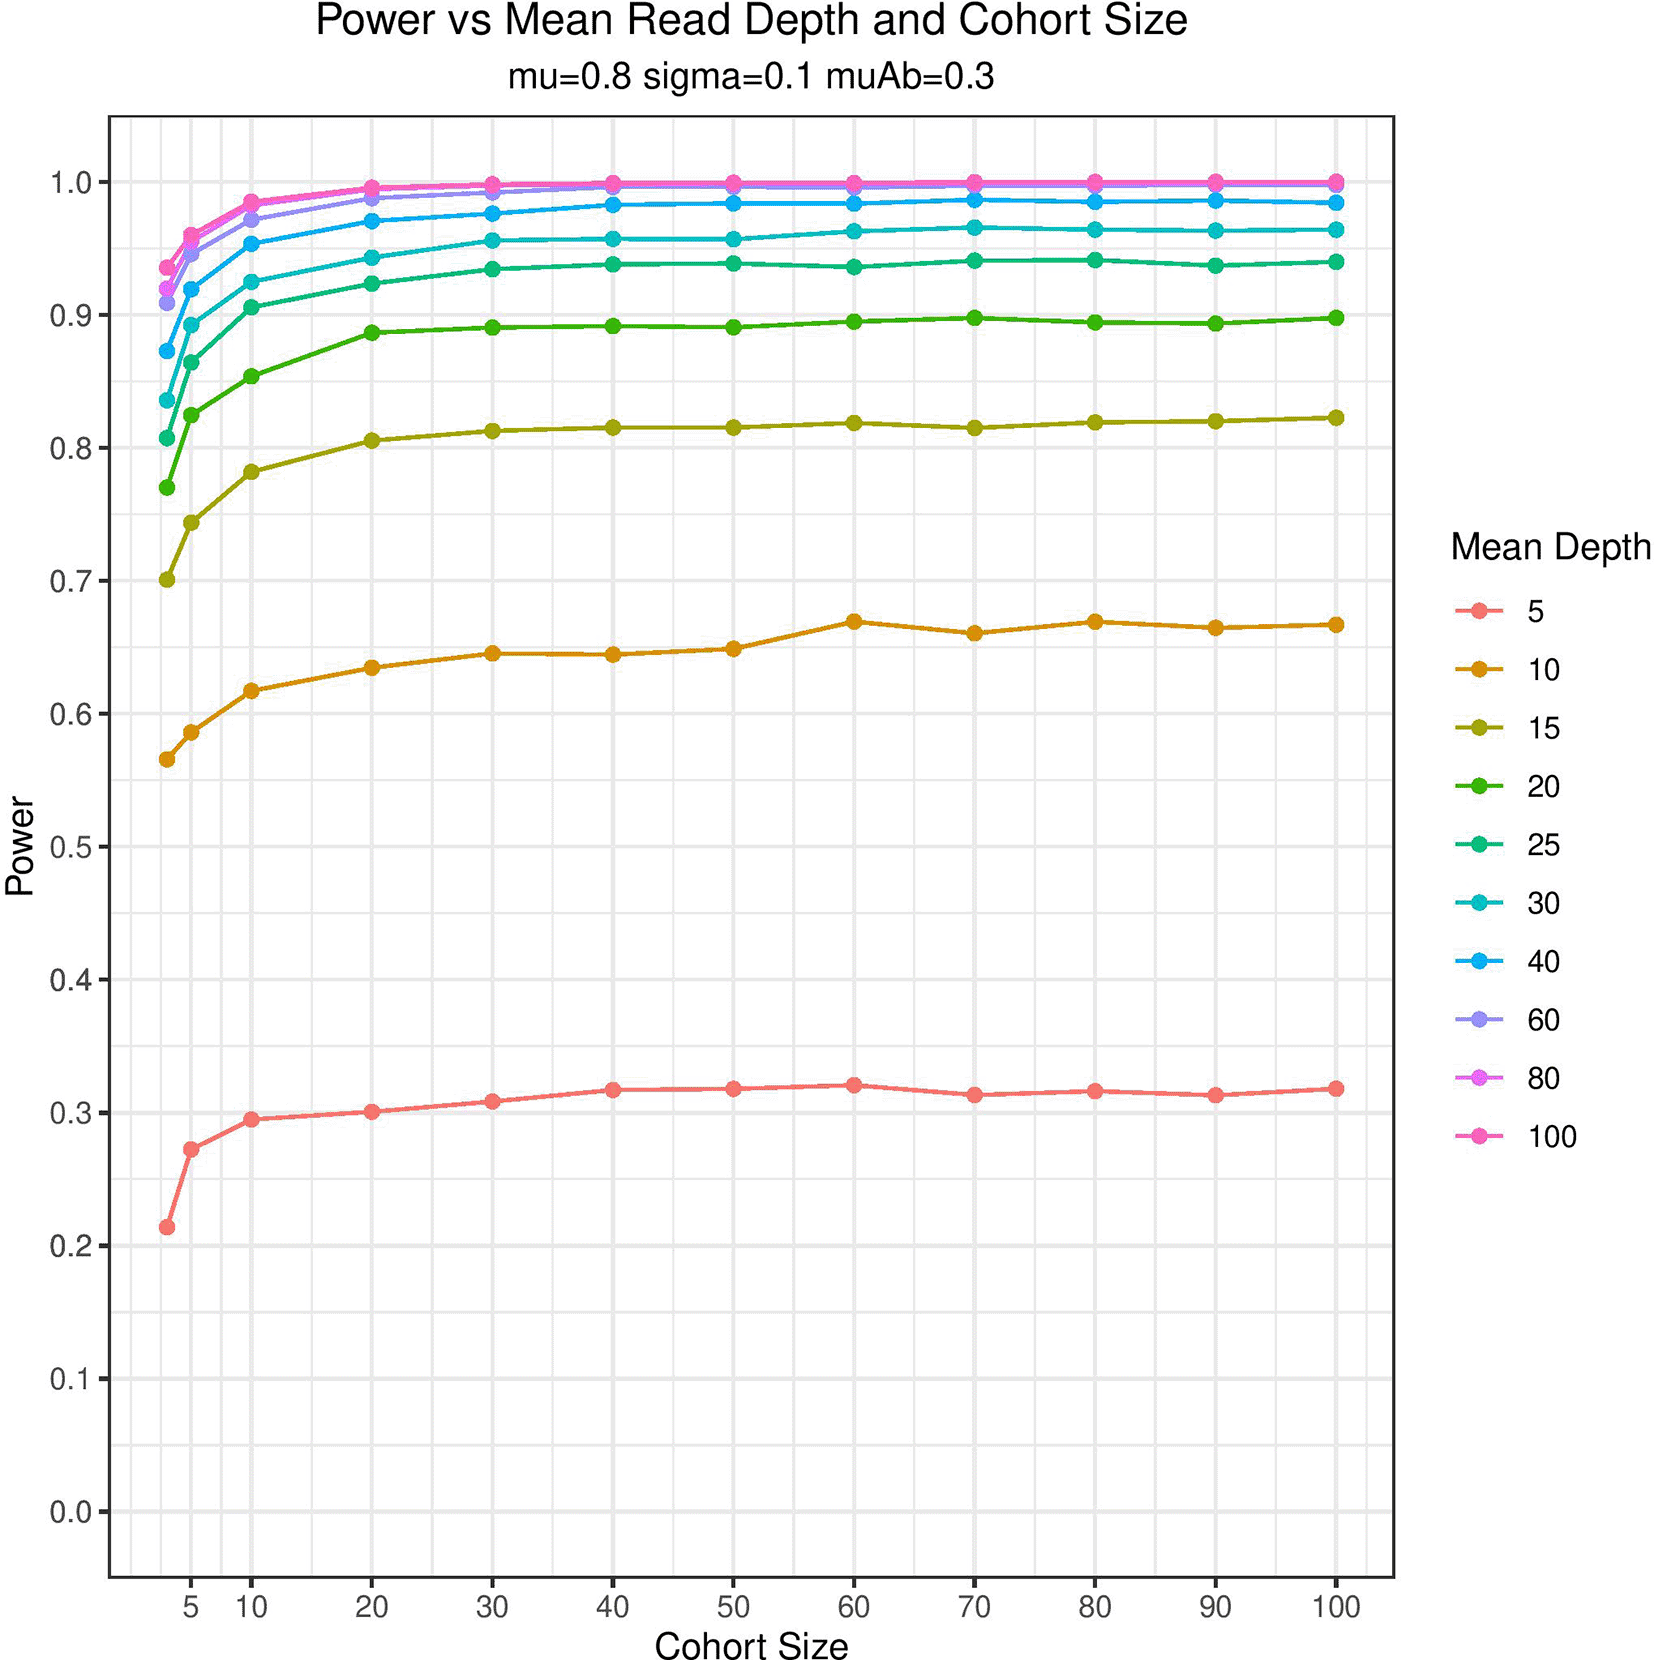
To validate performance of the BOREALIS method, we performed Monte Carlo simulations of an outlier sample in cohorts of varying sizes sequenced at varying depths of coverage. Namely, after selecting a cohort size I and an average depth of coverage D we conducted 10,000 Monte Carlo simulations wherein each sample i in the cohort has sequencing depth di drawn from a Poisson distribution with mean D. The number of methylated reads in cohort sample i is drawn from a Beta-Binomial distribution with mean 0.8 and dispersion 0.1, and then these simulated cohort data are fit using the BOREALIS model. An outlier sample is then simulated with sequencing depth d drawn from a Poisson distribution with mean D and number of methylated reads given by a Binomial distribution with mean 0.3. BOREALIS is then used to compute a p-value thresholded at level 0.05, and the power is given by the fraction of the 10,000 simulations that correctly reject the null hypothesis. Full code to replicate the power analysis is provided as described in the Data Availability section.
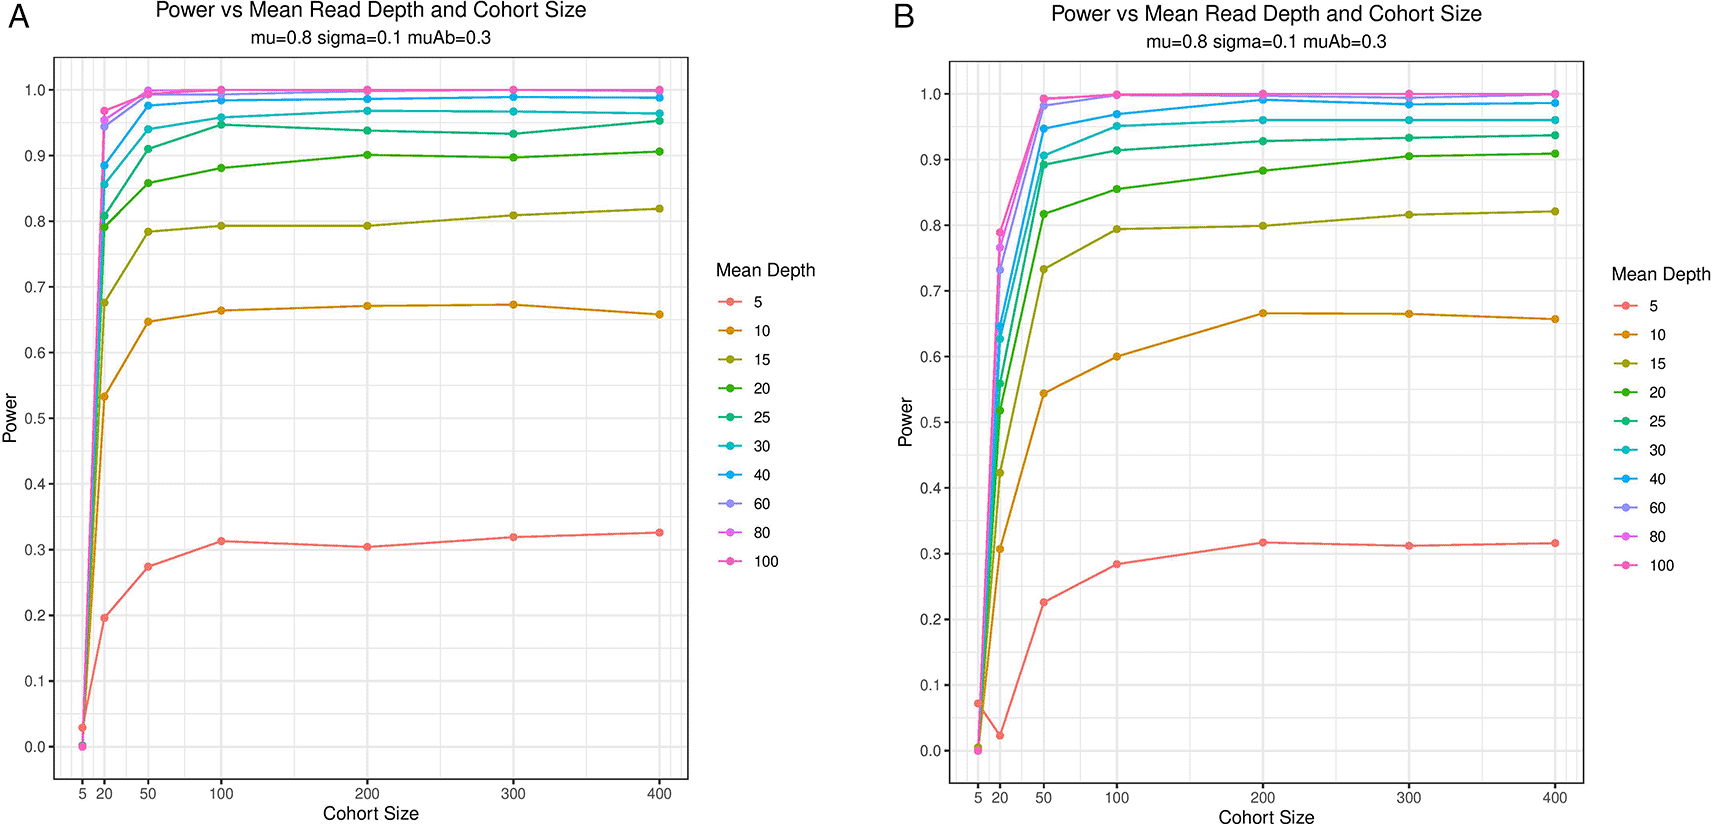
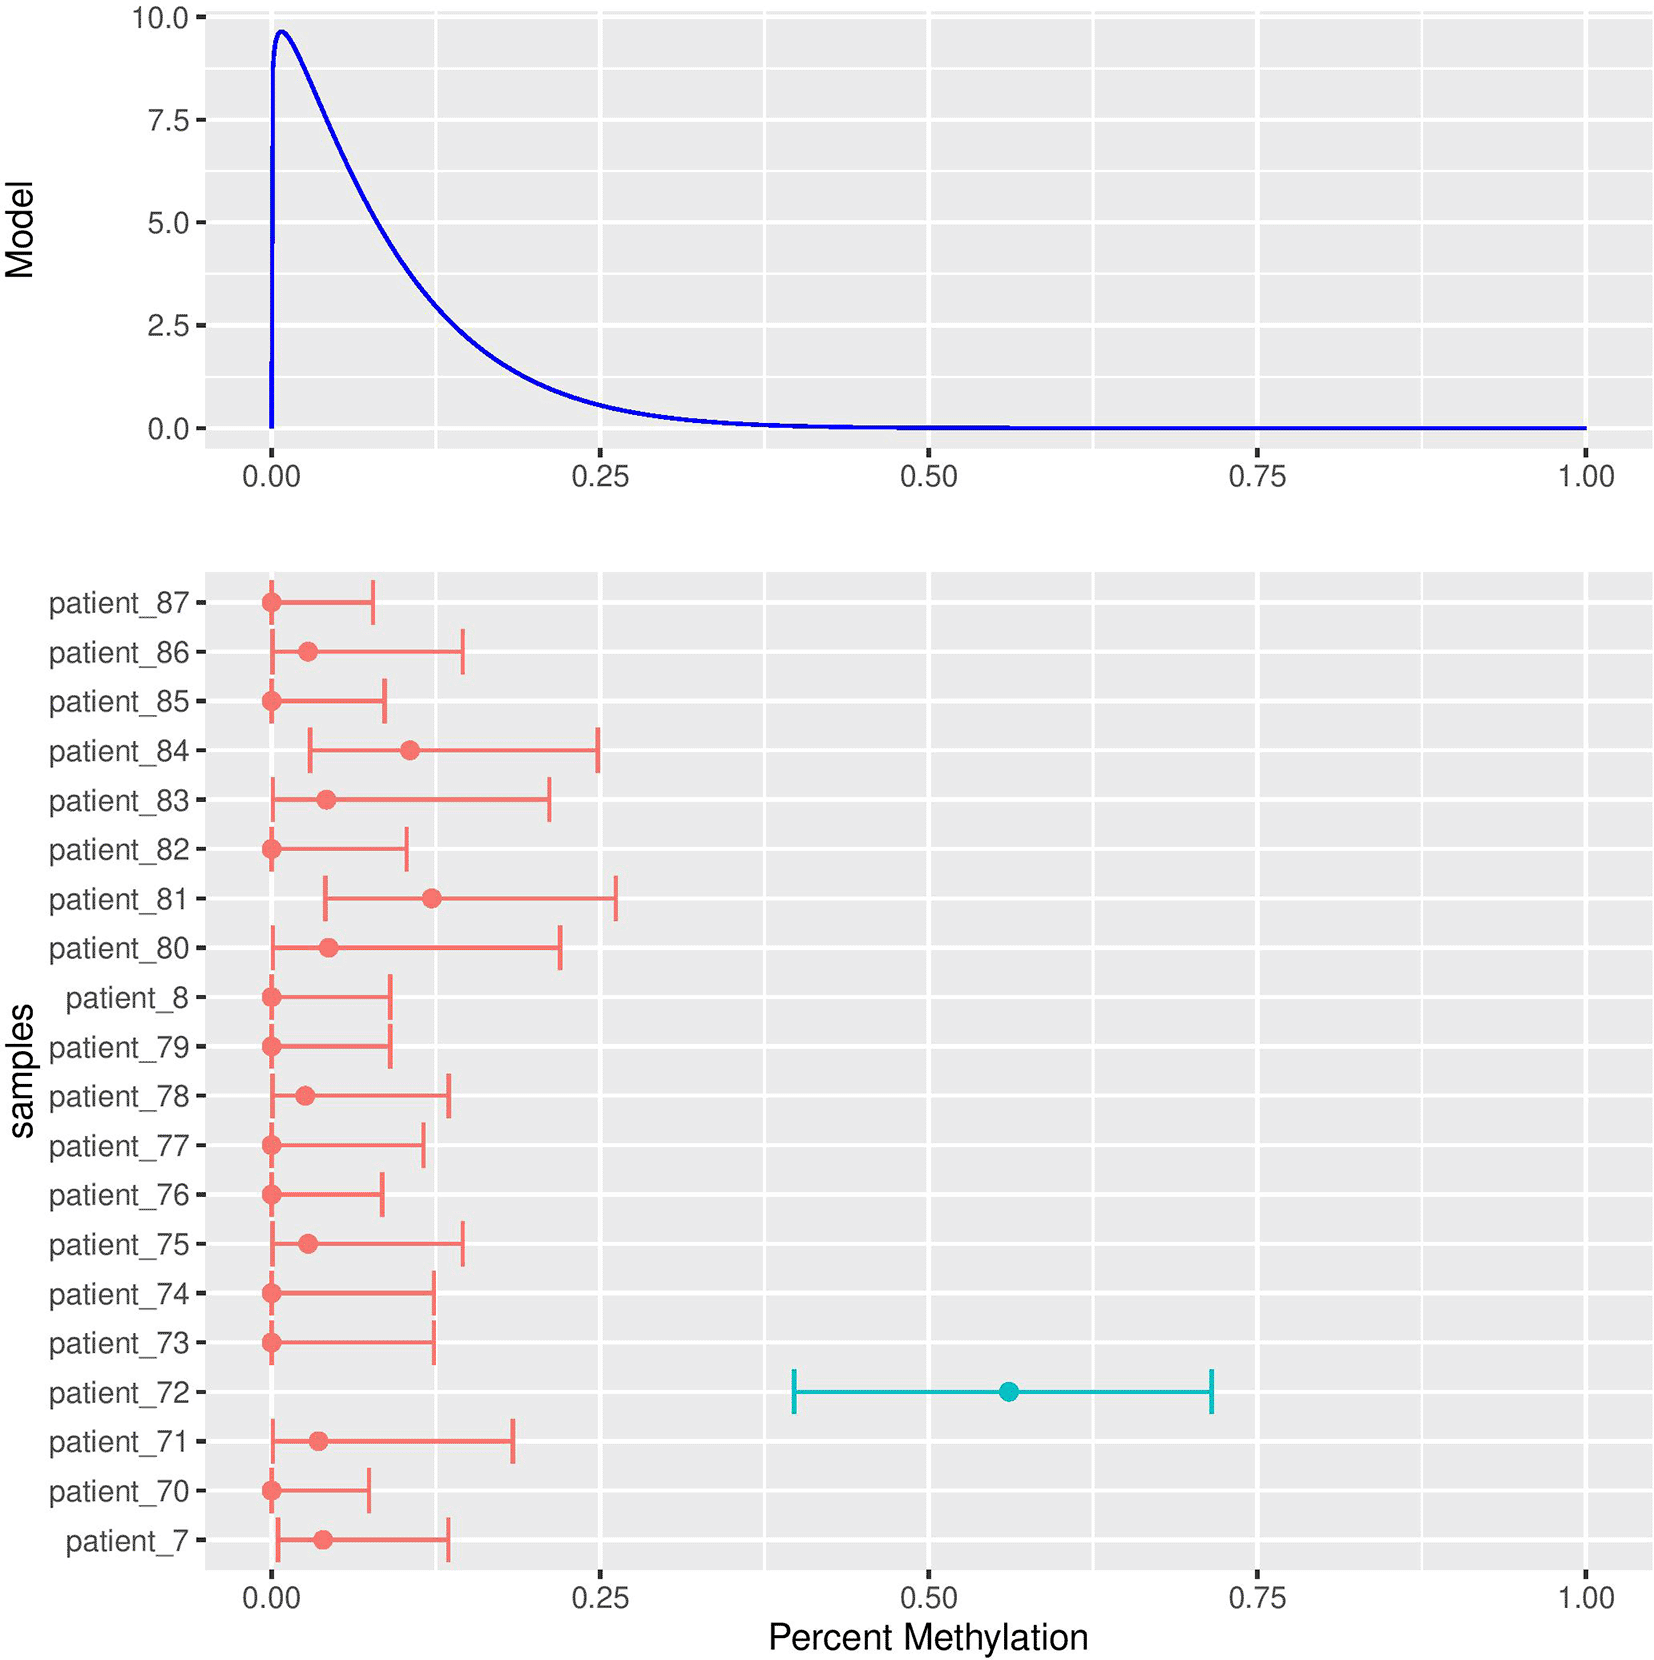
The results of the power analysis are plotted in Figure 2 demonstrating that BOREALIS can accurately detect outlier methylation events in modest cohort sizes and sequencing depths. BOREALIS can successfully identify outlier methylation with high statistical power utilizing a wide range of sample numbers (3-100+) and read depths (< 10 – 100s). BOREALIS is also tolerant of multiple identical outliers provided sufficient sequencing depth and cohort size as shown in Figure 3. The method supports multithreaded computation, as well as splitting across chromosomes to facilitate parallelism across compute nodes in a cluster environment. To provide users with the ability to visually review the methylation distributions underlying any call made by BOREALIS, we provide a built-in plotting function whose outputs are illustrated in Figure 4.

Graphical summarization of Monte Carlo simulations of an outlier sample in a cohort of varying sizes and depths of sequencing coverage. Ten thousand simulations were performed for each set of experimental conditions whereby random sampling of sequencing depth for each sample and the proportion methylated reads was performed. BOREALIS built its beta-binomial model for each simulated cohort and an outlier sample was simulated with BOREALIS used to compute a p-value. Power estimation is based on the simulations correctly rejecting the null hypothesis at a level p < = 0.05. The parameters mu (mean methylation fraction at a given site), sigma (variability in methylation fraction at a given site) and muAb (deviation from the mean methylation level in the outlier sample) are fixed for the purposes of the simulation shown.

Graphical summarization of Monte Carlo simulations of (A) two outlier samples and (B) three outlier samples in a cohort of varying sizes and depths of sequencing coverage. While rare disease studies generally aim to identify single outlier individuals in a cohort, this demonstrates the ability of the BOREALIS approach to identify multiple, identical outliers in the presence of sufficient read coverage and cohort size. One thousand simulations were performed for each set of experimental conditions whereby random sampling of sequencing depth for each sample and the proportion methylated reads
was performed. BOREALIS built its beta-binomial model for each simulated cohort and an outlier sample was simulated with BOREALIS used to compute a p-value.

Here a single site within the LTB4R gene promoter is shown for Patient 72, from the BOREALIS Bioconductor package’s included test data. Full details on how to perform BOREALIS analysis and generate similar figures are detailed in the BOREALIS vignette, included with the package.
BOREALIS is packaged with a vignette that will enable new users to become quickly familiar with program outputs and potential downstream use-cases. These include topics including:
1) Running the core BOREALIS method on a cohort
2) Post-processing
3) Generating summary metrics
4) Annotating program outputs with user-defined genomic features
5) Generating visual outputs for single-site data
6) Summarizing single-site data across genomic features
The vignette is available in HTML format within Bioconductor online (https://bioconductor.org/packages/release/bioc/vignettes/borealis/inst/doc/borealis.html) or packaged with the Bioconductor package itself. This vignette provides a hands-on introduction to the package and will be beneficial for new users, prior to them developing their own specific workflows.
BOREALIS is a novel R/Bioconductor package that addresses an unmet need in bisulfite sequencing-based genetic disease studies. The method is suited for single or multi-site downstream analysis and can successfully identify outlier methylation with high statistical power, providing a new avenue of exploration in the quest for increased diagnostic rates in genetic disease patients. It is readily available and easily implemented, enabling seamless integration with other common pipelines and tools.
GRO’s contributions include Data Curation, Formal Analysis, Investigation, Methodology, Software, Supervision, Validation, Visualization, Writing – Original Draft Preparation, Writing – Review & Editing. WGJ was involved with Conceptualization, Data Curation, Formal Analysis, Methodology, Project Administration, Software, Supervision, Validation, Visualization, Writing – Review & Editing. RJO and LESR participated in study design, helped with analysis and edited the manuscript. EWK participated in study design, secured funding and edited the manuscript.
• Software available from: https://bioconductor.org/packages/release/bioc/html/borealis.html
• Source code available from: https://github.com/GarrettJenkinson/borealis
• Archived source code at time of publication: Zenodo (DOI: https://doi.org/10.5281/zenodo.7342710) (Oliver, et al., 2022a)
• License: GNU General Public License v3.0. (GPL -3)
Zenodo. BOREALIS Power Analysis Code and Data. (DOI: https://doi.org/10.5281/zenodo.7343136) (Oliver, et al., 2022b)
The project contains the following underlying data:
• Fig 2.csv (Power analysis data for Figure 2 from the manuscript)
• Fig 2.pdf (Figure 2 power analysis graph in PDF format)
• Fig 2_power_analysis.R (R code to regenerate the power analysis and csv output for Figure 2)
• Fig 3A.csv (Power analysis data for Figure 3A from the manuscript)
• Fig 3A.pdf (Figure 3A power analysis graph in PDF format)
• Fig 3A_power_analysis.R (R code to regenerate the power analysis and csv output for Figure 3A)
• Fig 3B.csv (Power analysis data for Figure 3B from the manuscript)
• Fig 3B.pdf (Figure 3B power analysis graph in PDF format)
• Fig 3B_power_analysis.R (R code to regenerate the power analysis and csv output for Figure 3B)
• README.txt (Text file with instructions to regenerate power analysis data and graphs)
• plotFig2.R (R code to generate the graph for Figure 2 using the csv input)
• plotFig3.R (R code to generate the graph for Figure 3A and 3B using the csv input)
Data is under a Creative Commons Attribution 4.0 International license.
An earlier version of this article can be found in “Detection of outlier methylation from bisulfite sequencing data with novel Bioconductor package BOREALIS” (doi: https://doi.org/10.1101/2022.05.19.492700).
| Views | Downloads | |
|---|---|---|
| F1000Research | - | - |
|
PubMed Central
Data from PMC are received and updated monthly.
|
- | - |
Is the rationale for developing the new method (or application) clearly explained?
Yes
Is the description of the method technically sound?
Yes
Are sufficient details provided to allow replication of the method development and its use by others?
Yes
If any results are presented, are all the source data underlying the results available to ensure full reproducibility?
No
Are the conclusions about the method and its performance adequately supported by the findings presented in the article?
Partly
References
1. Brechtmann F, Mertes C, Matusevičiūtė A, Yépez VA, et al.: OUTRIDER: A Statistical Method for Detecting Aberrantly Expressed Genes in RNA Sequencing Data.Am J Hum Genet. 2018; 103 (6): 907-917 PubMed Abstract | Publisher Full TextCompeting Interests: No competing interests were disclosed.
Reviewer Expertise: RNA-seq based diagnostics of rare diseases, bioinformatics, statistical modeling
Is the rationale for developing the new method (or application) clearly explained?
Partly
Is the description of the method technically sound?
Partly
Are sufficient details provided to allow replication of the method development and its use by others?
Yes
If any results are presented, are all the source data underlying the results available to ensure full reproducibility?
Yes
Are the conclusions about the method and its performance adequately supported by the findings presented in the article?
Partly
Competing Interests: No competing interests were disclosed.
Reviewer Expertise: DNA methylation, machine learning, bioinformatics
Alongside their report, reviewers assign a status to the article:
| Invited Reviewers | ||
|---|---|---|
| 1 | 2 | |
|
Version 1 20 Dec 22 |
read | read |
Provide sufficient details of any financial or non-financial competing interests to enable users to assess whether your comments might lead a reasonable person to question your impartiality. Consider the following examples, but note that this is not an exhaustive list:
Sign up for content alerts and receive a weekly or monthly email with all newly published articles
Already registered? Sign in
The email address should be the one you originally registered with F1000.
You registered with F1000 via Google, so we cannot reset your password.
To sign in, please click here.
If you still need help with your Google account password, please click here.
You registered with F1000 via Facebook, so we cannot reset your password.
To sign in, please click here.
If you still need help with your Facebook account password, please click here.
If your email address is registered with us, we will email you instructions to reset your password.
If you think you should have received this email but it has not arrived, please check your spam filters and/or contact for further assistance.
Comments on this article Comments (0)