Keywords
Infant facial pain classification, infant cry detection, autoencoder, audio frequency features, deep learning.
Infant facial pain classification, infant cry detection, autoencoder, audio frequency features, deep learning.
ANN: Artificial Neural Networks
ASM: Active Shape Model
BCE: binary cross-entropy
CAE: convolutional autoencoder
FACS: Facial Action Coding System
FLACC: Face, Legs, Activity, Cry, Consolability
IFPaLVD: Infant FLACC Pain Level Video Dataset
LSTM: Long-Short Term Memory
MFCCs: Mel-Frequency Cepstrum Coefficients
MSE: Mean Squared Error
NIPS: Neonatal Infant Pain Scale
ROI: region of interest
SSIM: Structural Similarity
STFT: Short-Time Fourier Transform
VAE: Variational Autoencoder
Babies cannot communicate their feelings properly, as such they cry to show hunger, discomfort (wet diaper and itchy skin), and pain. Methods such as Face, Legs, Activity, Cry, Consolability (FLACC),1 Neonatal Infant Pain Scale (NIPS),2 Wong-Baker FACES Rating Scale,3 and others,4 are used to detect pain experienced by a baby. Based on these methods, the main factors for detecting pain are the baby’s facial expression, sound of crying, and body movements. Most of the pain scores are subjective, and they have high variability inter-observer agreement. Therefore, there is a need for a pain measurement tool to objectively measure and classify the pain.
Hospitals mainly have more patients than medical staff, therefore, manually monitoring all their patients would be very time consuming and difficult. Normally, neonates are kept inside incubators, which can reduce the volume of their voice, resulting in difficulty for the medical staff to notice their discomfort. Therefore, an automation program with an artificial intelligence system that can identify the baby’s condition is needed. It can also be used to recognize and monitor the infant’s pain scale’s progress and increase or reduce pain medication. Automatization will allow a doctor to monitor infant conditions remotely with input from the nurses. This invention can significantly improve the health care services, especially in developing countries where doctors are not always on-site.
M. Petroni et al.5 used Artificial Neural Networks (ANN) to classify infant voices to assess whether they’re in pain, fear, or anger. J. O. Garcia and C. A. R. Garcia6 also used infant voices to classify a normal or a pathological cry. This research used Mel-Frequency Cepstrum Coefficients (MFCCs)7 to encode speech signals before the signals were forwarded into the neural network. One study8 also used infant voices with MFCC representation to predict respiratory diseases such as wheeze, asthma, and crackles. Besides pain classification, MFCC has also been used to detect cries using audio features.9 This research divided an audio sequence into segments with 10 seconds duration. Instead of using infant voices, some studies also used facial expression features. K. Sikka et al.10 used facial expression feature to classify pain by using a Facial Action Coding System (FACS). Y. Kristian et al.11 tried hand-crafted extraction of facial expression features by using the Active Shape Model (ASM), based on the infant facial landmark detection and cry detection results from their previous research.12 These studies were further developed by using the deep learning autoencoder method to build a cry detection and pain classifier system.13 The deep learning extracts facial expression features automatically with the help of facial landmark detection as demonstrated by Kristian et al.11 J. Egede et al.13 utilized facial expression by trying to combine hand-crafted feature extraction and deep learning feature extraction. All these studies applied a facial expression as the only feature for classifying pain levels and crying detection. P. Werner et al.14 used a facial expression as a feature for one of their models. However, this research built other models by using the Biomedical Signals features while applying the Random Forest algorithm to combine these features.
The aim of this paper was to use both facial expression and infant voice as features for classifying pain levels and cry detection. As such deep learning autoencoders to automatically extract features for both facial and audio features were used. Additionally, the results for three features: only facial expression, only voice, and both facial expression and voice were compared in this study.
The key contributions of this paper are:
1) Automated three frame selection from videos dataset. Since several frames consist of an infant’s face, it was not possible to use all the frames. However, automated frame selection can also be a step to building an automated system.
2) Autoencoders were constructed to build a latent-vector with a smaller dimension than the original dimension but capable of representing the original data for both facial and audio data.
3) Introduction of the classifier models using the Convolutional Neural Network (CNN) for the classification of pain level and cry detection.
4) Combination of the best four pain classifier models that uses the ensemble methods to produce a higher F1 score.
In this paper, the facial expression and infant’s voice to build a cry detection and pain classifier system was used. From the video frames, face detection and face landmarks were applied to gain the face region. From the audio frames, the wave signal was transformed into amplitude spectrograms and dB-scaled spectrograms by using the Short-Time Fourier Transform (STFT). To gain the features from the infant’s face and voices spectrograms, autoencoders were used for the production of the latent-vector. These latent-vectors were used for CNN classifiers to ultimately predict crying condition and pain level. Four pain classifier models were used to form an Ensemble model. An overview of the system is shown in Figure 1.
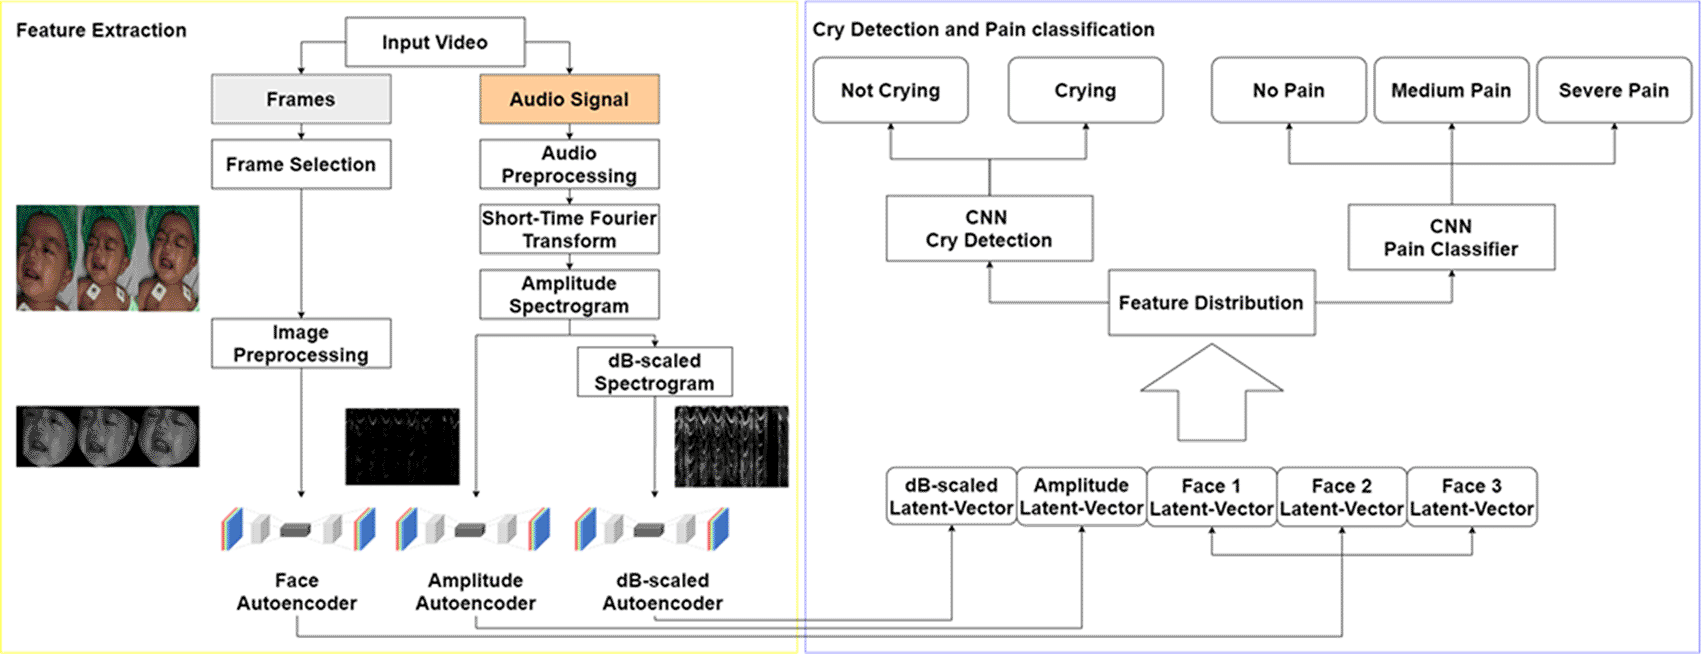
The face region will be extracted from the selected frames using face landmark. The amplitude and dB-scaled spectrograms are obtained from STFT process. These data are forwarded into autoencoders resulting five latent-vector which will be the input for the cry detection and pain classifier system.
This study was an observational study enrolled at Dr. Soetomo General Hospital (Surabaya City, East Java Province, Indonesia). The study included 23 infants below 12-months who were treated at Dr Soetomo General Hospital from November 2011 until December 2012. These infants were selected using a consecutive sampling. The FLACC pain scale and recordings of the baby's cries were taken in the video format and then analyzed using the software.
This study was approved by Clinical Research Unit at Dr. Soetomo General Hospital (248/Panke.KKE/III/2016). Due to the nature of the research, the visual data documenting facial expressions of observed infants will not be disclosed under the ethical considerations and regulations. Informed written consent was obtained from all patient’s parents, confirming that the results and any accompanying images including direct or indirect identifiers can be published.
Hanindito15 has taken 46 videos from 23 infants. Those videos were obtained before and after surgery (mostly hernia surgery) for each infant. The videos were labeled using FLACC measurement methods which took place in Dr Soetomo General Hospital. From this scoring method, all the data were concluded into three classification labels, which were no pain, moderate pain, and severe pain (See Underlying data).16 In 2017, Kristian et al.11 added ten more videos using the same FLACC ground truth labels and method.
For this research, these videos were divided into smaller segments with a 10 second duration to generate more data. At the same time, it provided the opportunity to avoid videos with high noise for both video frames and audio waves. Some videos could only be divided into one segment, while others into more than ten segments, depending on the number of frames that contain an extractable infant frontal face. After this process, 253 videos with an average of 10 second duration was obtained. Unfortunately, 64 videos were discarded as they did not contain any extractable frontal face frames. This dataset is called Infant FLACC Pain Level Video Dataset (IFPaLVD), which can be downloaded.17
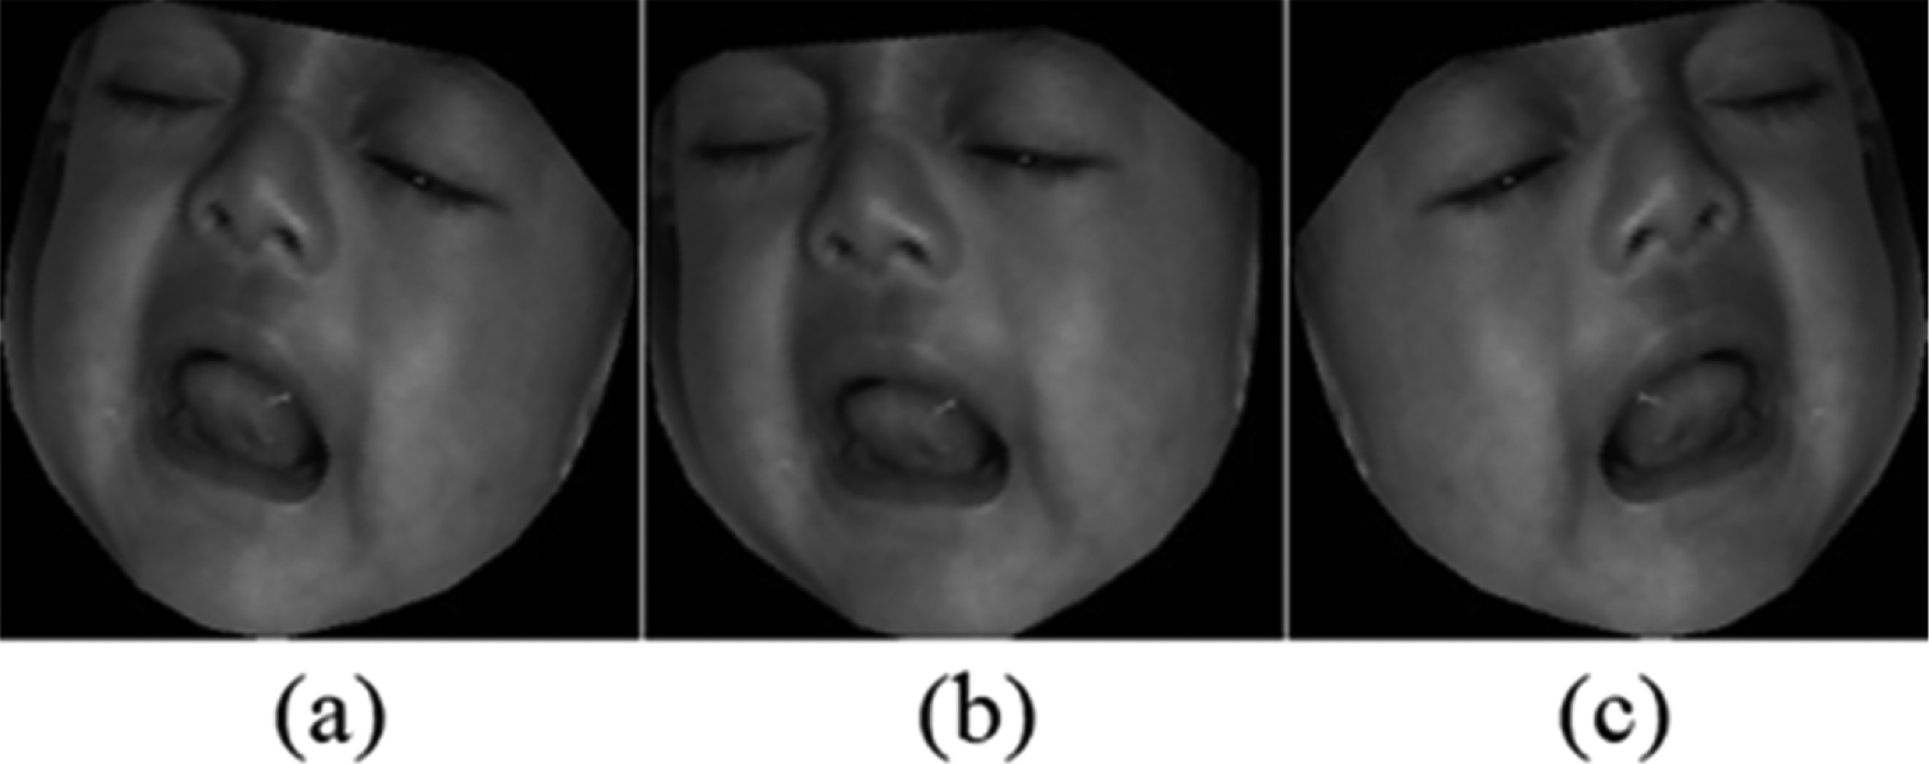
The 189 videos were used to apply the data augmentation process to increase the number of data collection. The augmentation process included both image and audio augmentation. For image data, horizontal flip and image rotation was used. The angles used for image rotation were -10°, 10°, -20°, 20°, and 15°. The output example of this face augmentation can be seen in Figure 2.
There is the time-shifting process (0.25 seconds) during spectrogram conversion. Therefore, the duration of 9.75 seconds was used to obtain 10 seconds for audio data. Further audio augmentation process was tuning the volume 2×, 3×, and 4× higher or 2× and 3× lower. Therefore, each video was generated into 12 unique videos, resulting in the final data to consist of 2,668 videos. Visually, the augmentation result for the audio data did not look any different.
Every 10 second video had approximately 259 frames depending on the Frames Per Second (FPS) from each video. Therefore, in order to save resources, instead of using all the frames three selected frames were chosen. The first frame was at the time which the baby cried the loudest. This was made possible by selecting the highest value of audio frames along with mapping the index value from audio frames to match the video frames’ index value. Following this, two more frames were chosen from one second before and after the first selected frame. However, there was a possibility that the chosen frame might have not had an extractable frontal face. Therefore, with the selected frame as the starting point, each frame was evaluated until a frame with an extractable frontal face was reached.
Upon selecting three desired frames, the remaining frames which included the non-face region was discarded. Since grayscale images were used in this process it was important to convert the image color. The region of interest (ROI), which is the face region was selected in the grayscale images. This process used the face detection model from a previous study.18 In this model, a rectangle area that consisted of the baby’s face was selected, and facial mapping (landmark) with the use of DLIB library was applied. This technique resulted in 64 points for the face landmarks. These points were used to draw a filled convex polygon and eliminate all the values outside the polygon. Finally, the frame was resized into the shape of 200×200 to uniform all the data dimensions.
Sounds are continuous analog signals, and their waveforms can take any value.19 Therefore, to digitalize and homogenize an audio signal, computers convert the value into specific sample rate. Similar to FPS for video, audio has a variety of sample rates. The sample rates needed to be uniform in the dataset. The sample rate used was 22,050 Hz, resulting in an array with the length of 21,500 for 9.75 seconds of audio, which represented the audio wave. However, it was not possible to extract any information from this audio wave. Therefore, the wave representation was changed into the time-frequency representation. The method to change the audio representation was by STFT18 (Equation 1). This equation contains two parameters, hop counter (h) and frequency index (f).
In the STFT process a 2,048 length “Hann” window with 512 hops was used. The total of 215000 samples, produced 420 hop iterations, with each iteration having a 2,048 window size (N). The result was a two-dimensional array with the shape of 1025×420. The two-dimensional array still had a complex number (i), therefore an absolute function to remove that complex number was done (Amplitude spectrogram). This amplitude spectrogram has many near-zero values as babies cry for a certain frequency range. Therefore, row 50 until 350 for this spectrogram was used and the rest was discarded, resulting in the final shape of 300 × 420. The amplitude spectrogram in its linear scale was transformed into its power log scale or dB scale20 (Equation 2), and the result was called dB-scaled spectrogram. The value of 1.0 was used for the power reference (P0), and A represented the amplitude spectrogram.
In 1986, D. E. Rumelhart et al.21 introduced a method called autoencoder. Autoencoder is a neural network consisting of two parts, encoder, and decoder. The encoder maps the input to the latent-vector with a smaller dimension, while the decoder maps the latent-vector back into the original input.21 An autoencoder for image representation with the use of deep networks was used by Vincent et al.22 for denoising images. That research inspired S. Gao et al.23 to use a deep autoencoder for extracting features from human faces, which showed promising results.
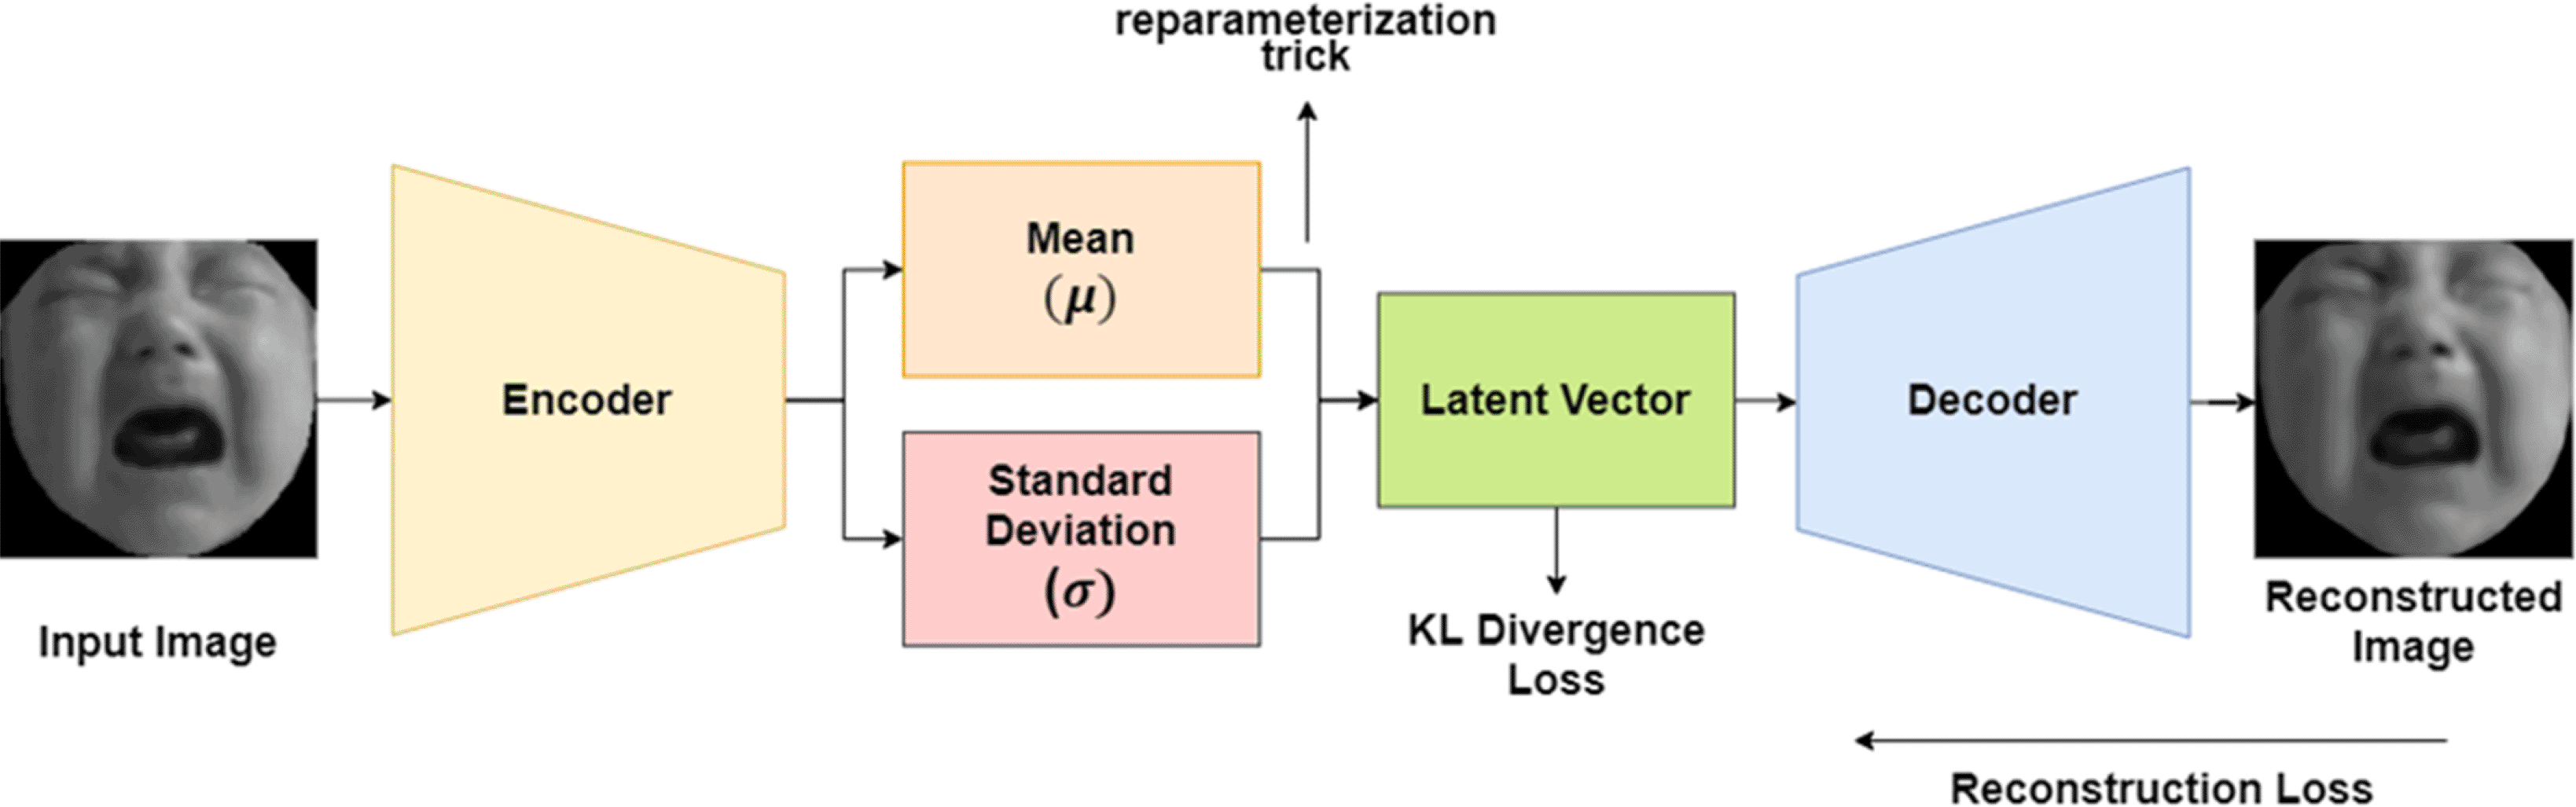
Variational Autoencoder (VAE) is a new variation of an autoencoder that was proposed in 2013.24 The VAE can control the latent-vector distribution, due to its structure that contains two latent-vectors (Figure 3). As shown in previous research,24 VAE can generate new data from its latent-vector, and build a face generation model to create a completely new face image. As shown in Figure 3, the two latent-vectors are combined into a single latent-vector using a reparameterization trick (Equation 3). The combination of latent-vector is important as it enables the backpropagation process for VAE. In this equation, μ represents mean (first latent-vector), σ represents variance (second latent-vector), and ϵ represents random normal. Moreover, VAE also adds the reconstruction loss with its latent-loss, which is usually called KL Divergence Loss (Equation 4) with N representing the size of the latent-neuron.
These latent-vector were combined using reparameterization trick.
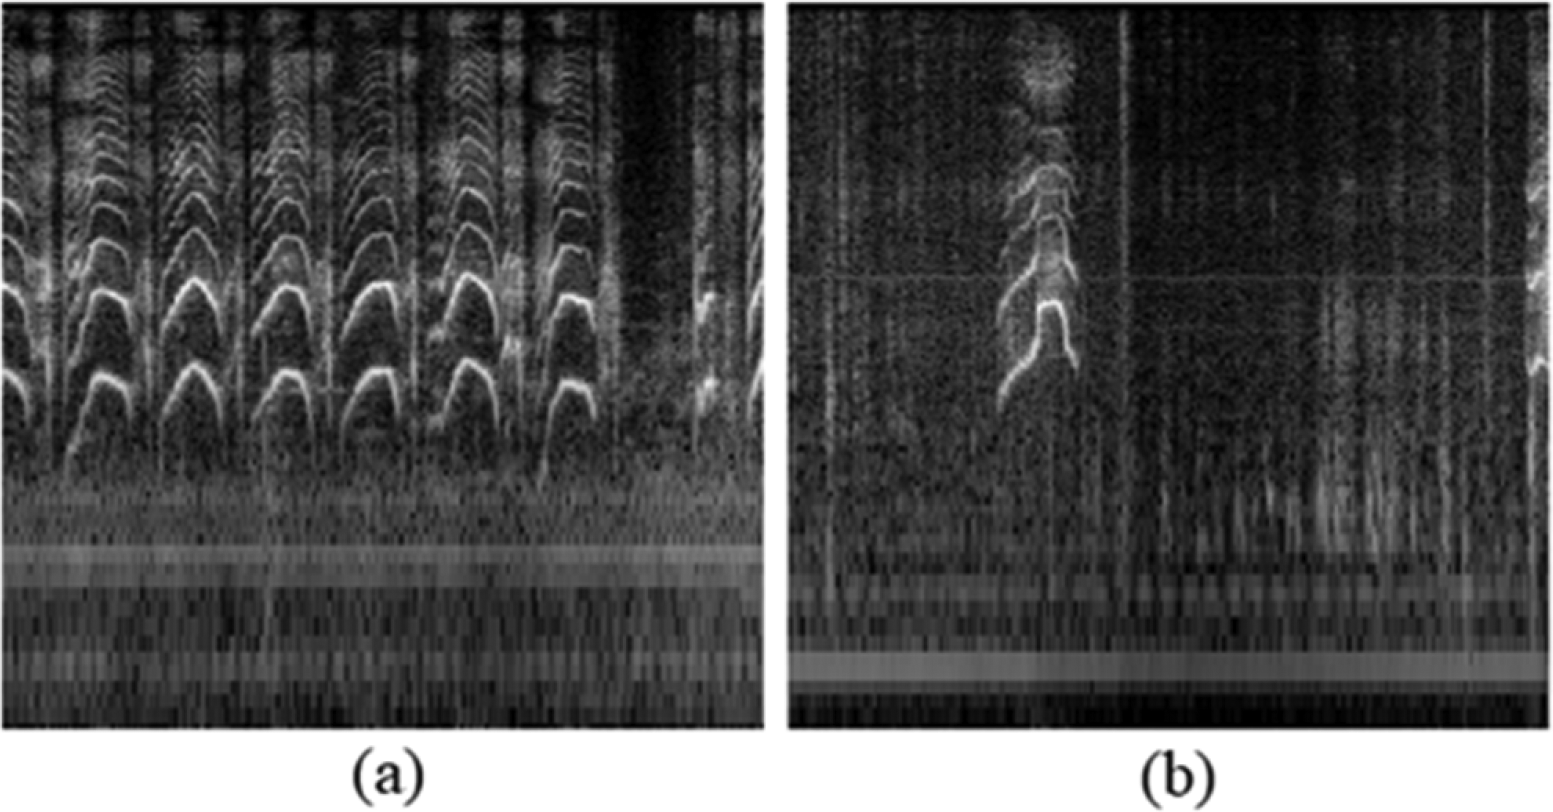
Apart from autoencoders for image data, a study in 201725 applied autoencoder for denoising a single-channel audio source. The autoencoder type used in this study was a convolutional autoencoder (CAE). They attempted to recreate the magnitude spectrograms. The spectrogram was a time-frequency representation of an audio signal. Figure 4 shows the example of dB-scaled spectrograms from this study data. This research indicates that using CAE from denoising audio produced promising results.
Autoencoders are unsupervised learning neural network algorithm with a backpropagation process.26 This algorithm is unsupervised learning because it will try to produce an output that has a close similarity to the input, which can lead to both the output and the input to have similar shapes. Therefore, eliminating the use of data labels.
After being forwarded into several hidden layers, autoencoders will reduce the data dimension. At a certain point, the layers will start to increase the data dimension. Finally, the last layer will have the same size as the input. The main idea of autoencoders is to reduce the original data dimension without losing important details so that it can be reconstructed back into the original data.27
Based on this explanation, autoencoders consist of four main parts. The first part is the encoder, where the model will keep reducing the data dimension. The second part is called bottle-neck, or latent-vector. Latent-vector is the result of the encoder, which has the smallest size in the model. The third part is the decoder, which will try to recreate the original data from the latent-vector. The last part is the reconstruction loss, which is a function to measure the similarity between input and output.28 From all these parts, the encoder and latent-vector is needed. The purpose of the decoder and the reconstruction are to make sure there is an excellent encoder and latent-vector. Finally, only the encoder is used to get the latent-vector, and this latent-vector will be forwarded into the classifier.
In this paper, the autoencoders were used as the feature learning process. As mentioned, this paper has used autoencoders for both face and audio data. Both CAE and VAE were used, and the results were compared. Additionally, the results were analyzed with and without using a dense latent-vector. Mostly, the autoencoders consist of three kinds of layers, which were convolutional, max pooling, and upsampling layer. For the models that used a dense latent-vector, a fully connected layer was added. Rectified Linear Unit (ReLU) was used29 (Equation 5) as the activation function of the convolutional layers and the sigmoid function30 (Equation 6) for the fully connected layers. Other activation functions did not increase the performances.
Both amplitude and dB-scaled spectrograms used the same structure, but they were trained separately. Although layers with variant parameters were used, all convolutional layers only used one stride and the same padding so that the convolutional layers don’t reduce the dimension. The max-pooling layer for the dimensionality reduction task used 2×2 kernels to minimize the detail loss. The structure for the best model for CAE without dense latent-vector can be seen in Table 1 for face autoencoder, and Table 2 for spectrogram autoencoder. For the models that used dense latent-vector, a similar architecture was used with a different bottle-neck part (yellow color). The bottle-neck part was changed into a fully connected layer with 1,250 neurons, and the next layer with 8,250 neurons for the face autoencoder. For the spectrogram autoencoder layers were not changed, however, a convolutional layer with ten filters and a 3×3 kernel before the bottle-neck, and a fully connected layer with 7,875 neurons after the bottle-neck part was added. For the VAE models, the same architecture for both with and without dense latent-vector was used with the difference that the bottle-neck parts were duplicated, and an extra layer was added to implement the combination of the two latent-vector by using the reparameterization trick.
| Layer | Model | Layer | Model |
|---|---|---|---|
| 1 | Conv 3×3, 50 | 7 | Conv 3×3, 30 |
| 2 | Max Pool 2×2 | 8 | UpSampling 2×2 |
| 3 | Conv 3×3, 40 | 9 | Conv 3×3, 40 |
| 4 | Max Pool 2×2 | 10 | UpSampling 2×2 |
| 5 | Conv 3×3, 30 | 11 | Conv 3×3, 50 |
| 6 | Conv 3×3, 1 | 12 | Conv 3×3, 1 |
Based on the autoencoders structure without dense latent-vector, the latent features will have the shape of 25×25×2 for the face data and the shape of 75×105×1 for spectrograms data. This shape is the smallest that could be produced which still gave a good reconstruction result. In the next part, we’ll present that autoencoders without dense latent-vector provide a better reconstruction result.
Autoencoders need a loss function to measure their performance. The most common and simple function is the Mean Squared Error (MSE) function.31 However, using this function won’t produce the best result for this study therefore, Structural Similarity index (SSIM)32 was used as the loss function for the face autoencoder. In addition, binary cross-entropy (BCE) instead of MSE was used in the spectrogram autoencoder. The benefits of using SSIM and BCE compared to MSE has been shown in in Figures 5 and 6.
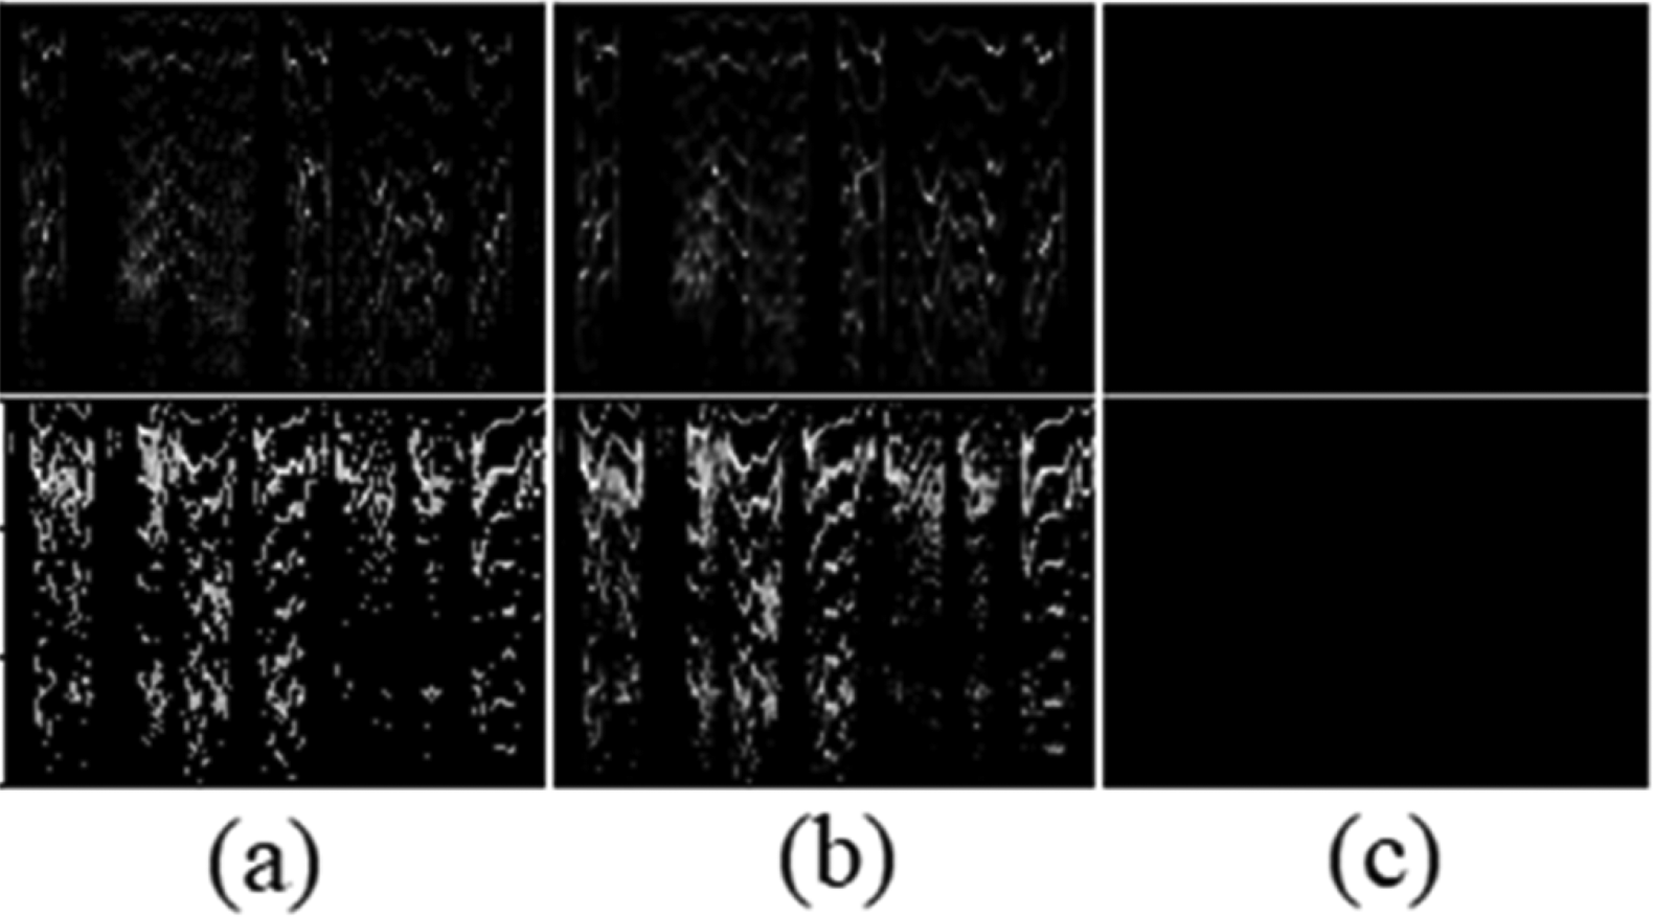
(a) Original spectrogram, (b) BCE reconstruction, and (c) MSE reconstruction. MSE can’t reconstruct the original data.
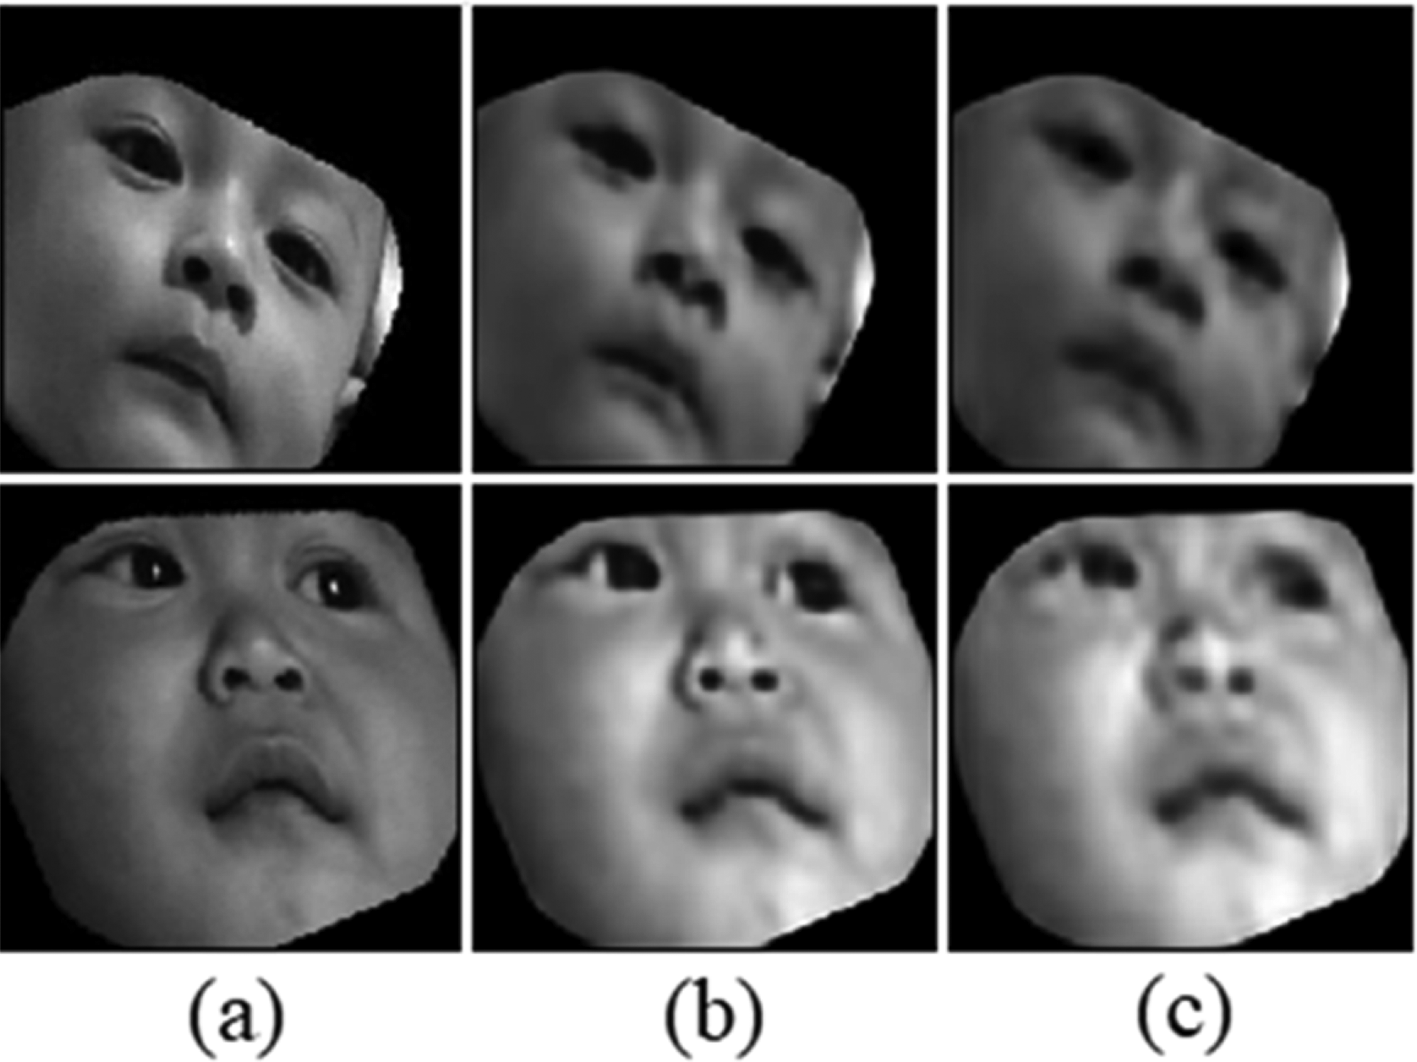
(a) Original image, (b) SSIM reconstruction, and (c) MSE reconstruction.
Equations 7 and 8 for SSIM and BCE loss functions were used with h representing model prediction, and y representing the desired output. For the SSIM loss function, 0.01 for k1 and 0.03 for k2, while L represents the maximum value was used (This value is one since the image has already been normalized).
In 2018, T. Baltrušaitis et al.33 summarized methods that have been used for multimodal data representation. At present, there are only two methods for co-learning multimodal data at the same time: joint and coordinated representations. The basic concept of the joint representation method is to fuse the data representation by concatenating its individual features. On the other hand, the coordinated representation let each representation to be learned separately while still in coordination. Joint representation was used in the present study as it is the most used method. However, limited labeled data has been the main obstacle faced in this case. The solution to this problem was to use a pre-train representation of unsupervised learning, such as autoencoders. The method of using autoencoder for unsupervised learning has been used previously by another study.34
In 2011, M. A. Nicolaou et al.35 used a multimodal data without deep learning methods. Since the features were hand-crafted, autoencoders were not used. The same joint representation method along with three fusion methods were used by that study. The methods were feature-level (used in this study), model-level, and output-level fusion. The feature-level fusion is combining the feature to be predicted using one model. While model-level and output-level fusions predict each representation individually, and combine them using another model.36
In both studies by Y. Kristian et al.11,12 a cry detection and pain classification system was created. This study used 46 videos taken by E. Hanindito et al.15 and added ten more videos with multiple duration. These studies introduced an ASM for landmarking infant’s face. The ASM was built using the frontal face on the videos as their data to extract hand-crafted geometric features. From these features, they’re able to achieve high accuracy for the infant facial cry detection and pain classifier.
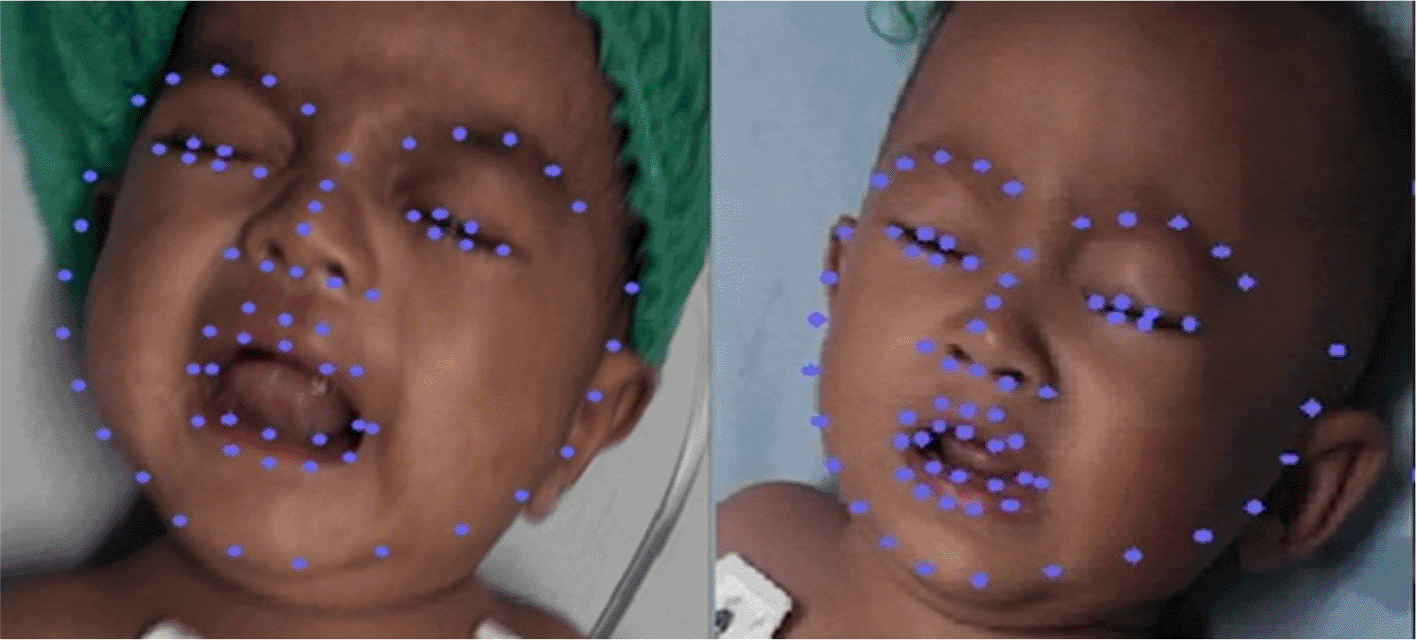
In 2018, while deep learning had already been widely used as a feature learning method, Y. Kristian, et al.37 removed all the hand-crafted feature extraction, and switched to deep learning by using autoencoders. This research still used the same ASM from their previous research12 to crop the face region and discarded unimportant data. This paper transforms the ASM model into Kazemi et al. face landmark algorithm38 (Figure 7). DLIB library supports this algorithm. The extracted features were forwarded into the Long-Short Term Memory (LSTM) model to classify pain and for cry detection from a sequence of video frames. This research reported a high accuracy for both cry detection and pain classification. The face landmark algorithm from this research was used in this paper by using the DLIB library.
Apart from studies using facial expression, several studies tried to classify infant pain using acoustic features from the infant voices data. In 1995, Petroni et al.5 tried to classify the infant’s cry by using the Mel-cepstrum coefficients representation and filter-band energies with the help of ANN. This research used three classification targets: anger, fear, and pain. The results provided good accuracy for predicting anger and pain. However, this research had many prediction errors for the fear label.
In 2003, J. O. Garcia and C. A. R. Garcia6 set out to classify normal and pathological infant’s cries. This research provided a high accuracy by using 506 data to classify two target classes. Instead of using the audio wave signal, MFCC as the audio representation was used in this study, which is the same as the spectrogram but adapted to resemble the human ear. This research also used the help of a neural network to classify their final prediction. In addition, the study also included experiments with feature selection methods such as PCA.
In the present study classifiers for both cry detection and pain classifier were used. Throughout this study, from all the autoencoders tested, both CAE and VAE without dense latent-vector had better performances (Results shown in the next section). Therefore, the latent-vector from autoencoders without a dense-latent vector was used as the input for the classifiers. Following this, it was noticed that autoencoder models with similar performances may have completely different latent features from each other. Some latent features may be able to provide good classification results while this might not be possible for others. Due to this reason, the use of a neural network classifier consisting of just fully connected layers and dropout layers could not be used in this study. Therefore, at least one convolutional layer to boost the classifier performances was needed. In addition to the convolutional layer, dropout layers to prevent overfitting were used considering the small amount of data in this study.
In totals, five latent-vectors from the autoencoders were used. All these features were not used at once, however, models were built by using a single or combination of features. There were five feature parameters for the cry detection and pain classifier system: faces, dB-Scaled, amplitude, faces + dB-Scaled, and faces + amplitude. For a model that used more than one feature, the convolutional layer’s output was concatenated. Therefore, based on the multimodal models, there were four convolutional layers, three for face data and one for spectrogram, before concatenation process.
For the cry detection model, there were only two target classes. Therefore, one neuron output, and the sigmoid activation function was used. However, as there were three target classes for the pain classifier, three output neurons were needed. Additionally, the softmax activation function was used39 (Equation 9) to make the neuron’s output as the prediction probability for each class. For the cost function, binary cross-entropy for the detection system, and for the pain classifier, a categorical cross-entropy (Equation 10) were used. In these equations, N represents the number of output neurons.
As this study is a classification problem, accuracy as the performance measurement was used. On the other hand, the most widely used metric to measure model performances for classification problem is the F1 score (Equation 11). F1 score is the harmonic mean of precision (Equation 12) and recall (Equation 13). The final measurement is the Macro F1 Score. This measurement is the average of F1 scores for each class.
This study presents one model that was the best for the cry detection system. However, as a significant high F1 score for the pain classifier model could not be achieved, four models that provided a significant high F1 score were used instead. Each model had different parameters: face + dB-Scaled, face + amplitude, only dB-scaled, and only amplitude. From these results, it was decided to use all the models rather than choosing the best models. The prediction of the pain class was by using four models, and the majority votes method as the ensembling method was used. This method voted for all classifier results and used the majority class label as the final predicted class. In the case of tied votes, the class with higher pain labels were chosen. For example, if the severe pain and moderate pain classes had the same voting points, severe pain as the final prediction was selected.
In this paper, two major parts of the experiment were presented. In the first part, three autoencoder models were built, which were autoencoder for the infant’s face, amplitude spectrogram, and dB-scaled spectrogram of infant’s voices. In the second part, the latent-vector result from the autoencoders were used to build the cry detection and pain classification models.
In total, 20% of the 16,575 face dataset was used as the testing data, which resulted in 3,093 data. The results for the facial autoencoder can be seen in Table 3, and the image output sample can be seen in Figure 8. These results indicate that both CAE and VAE can recreate the data with a small SSIM loss value. From the reconstruction loss and the sample output, it can be seen that the best model was the use of CAE without dense latent-vector.
| Type | E | Weight param | SSIM loss | |
|---|---|---|---|---|
| Train | Valid | |||
| CAE | 25 | 46,373 | 0,052239 | 0,050319 |
| CAE-d | 20 | 7,552,851 | 0,083503 | 0,090254 |
| VAE | 80 | 46,555 | 0,123958 | 0,118260 |
| VAE-d | 100 | 29,493,161 | 0,175157 | 0,177079 |
A dense latent-vector had reduced the model performance for both CAE and VAE. Although, the performance was only slightly reduced, and there was sufficient reconstruction of the original face, the dense latent-vector used much more weight parameters because of its fully connected layers. Therefore, it can be concluded that autoencoders without dense latent-vector were the best option in this case.
Even though CAE and VAE cannot be compared as they are different methods, it can be seen in Figure 8 that CAE gave a much better reconstruction result. It was assumed that VAE tried to build a more general model, as a result the model was forced to miss the small details.
Two spectrogram autoencoder models were built, one for dB-scaled spectrogram and one for amplitude spectrogram and the same structure and loss function for both spectrograms were used. Moreover, the same data training and testing distribution was used. The testing data was 506 data as it represents 20% of the total data (2530 short videos). The use of the dense latent-vector for the spectrogram autoencoder produced the same results as the face antoencoder (Results not shown). The results of the spectrograms CAEs and VAEs can be seen in Table 4, and the output samples were shown in Figure 9 for the dB-scaled spectrogram and Figure 10 for the amplitude spectrogram.
| Type | E | Weight param | BCE loss | |
|---|---|---|---|---|
| Train | Valid | |||
| dB-scaled spectrogram | ||||
| CAE | 10 | 59.282 | 0,089058 | 0,095361 |
| VAE | 20 | 59.553 | 0,114446 | 0,114446 |
| Amplitude spectrogram | ||||
| CAE | 20 | 59.282 | 0,004835 | 0,005037 |
| VAE | 20 | 59.553 | 0,007848 | 0,0075736 |
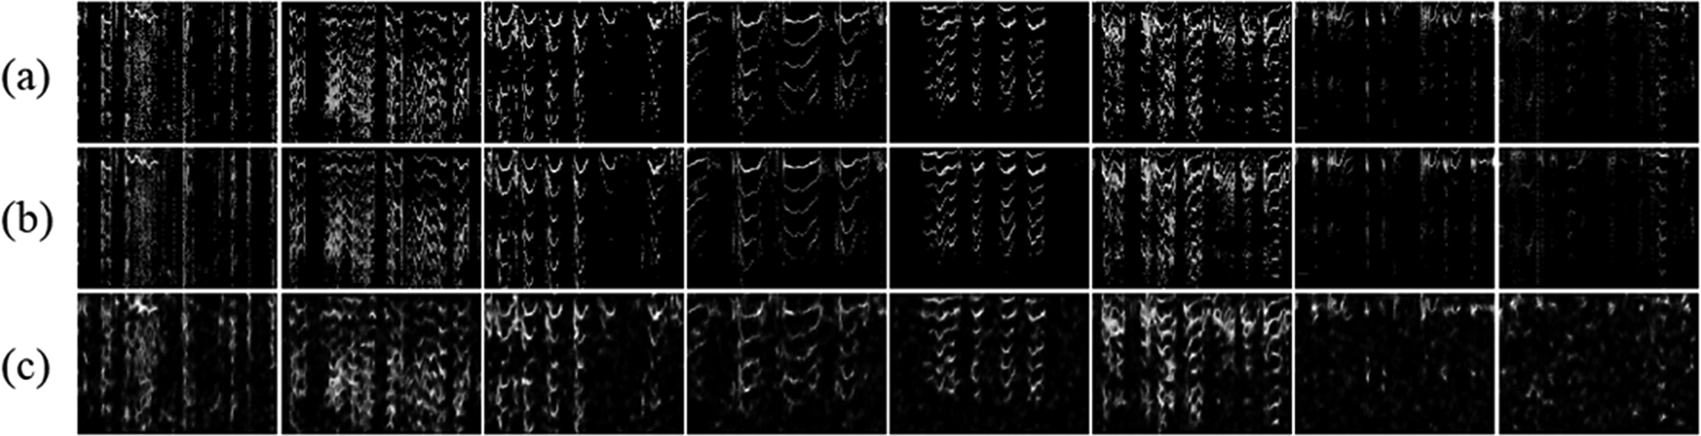
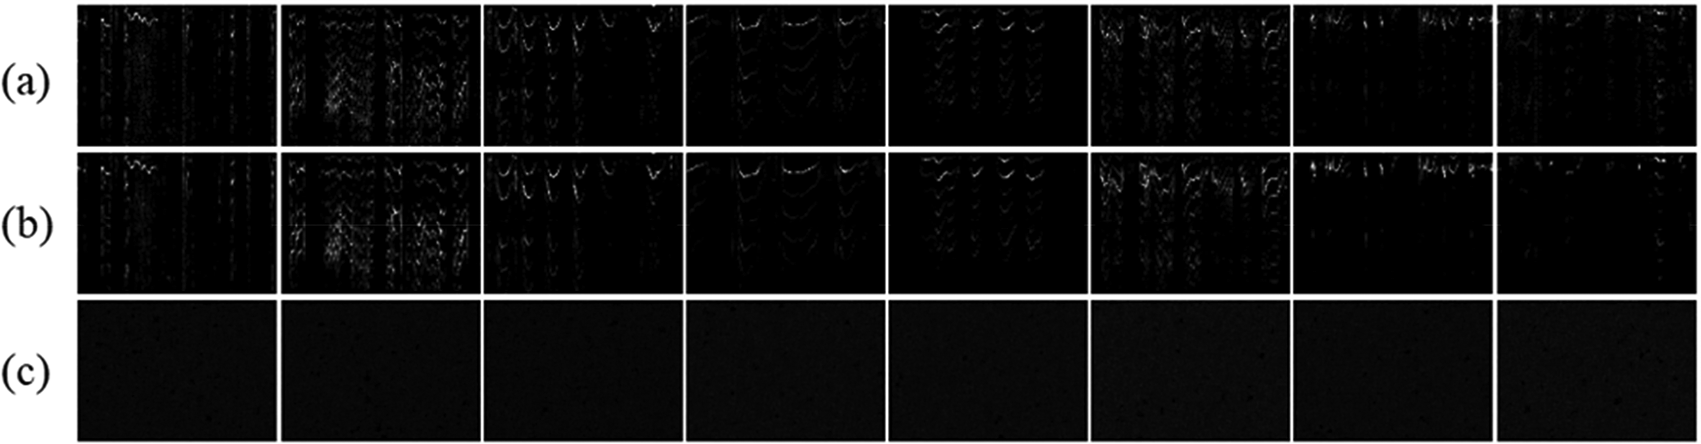
From the output samples, it can be seen that VAEs’ reconstructions were not good for both spectrograms. Based on the results in Figure 10, it can be agreed that the amplitude spectrogram cannot be reconstructed by using VAE. For the dB-scaled spectrogram, the reconstruction may be similar to the original data. However, few spectrogram differences might give a huge difference in their audio signal. Therefore, the present study did not test with the classifier by using the VAE latent-vector for the spectrograms. It was also assumed that VAEs were unable to recreate the perfect original data due to their ability to generalize.
Two data training and testing distribution was tested. In the first distribution, seven original videos, which were three pre-surgery, and four post-surgery videos were excluded to prevent overfitting of the system. This resulted in the use of 1,836 training data and 432 testing data (Table 5). For the second distribution, the data order was mixed, and 25% of the data for the purpose of testing was excluded. Therefore, 1,701 training data and 567 data for testing was obtained. Further details about this distribution can be seen in Table 6. This distribution was provided to compare the result with the first distribution.
| Labels | Training | Testing | |
|---|---|---|---|
| Pain | Severe | 276 | 132 |
| Moderate | 492 | 132 | |
| No pain | 1068 | 168 | |
| Cry | Yes | 744 | 240 |
| No | 1092 | 192 | |
In this study several feature combinations by using both data distributions were tested (Table 7). The results show that the use of the second distribution gave a much higher results on all parameters. It is possible that using the second dataset distribution couldn’t detect an overfit model because of the high similarities between the training and testing data.
Based on the result of the first data distribution, the facial expression was not a relevant feature for cry prediction. However, this feature can give a much better result on the pain problem. This result indicated that more data is required to avoid overfitting of the system. Face features using CAE gave a higher result; this statement was also supported by the multimodal feature result, which produced a better result when using CAE facial feature extraction. On the contrary, using voice features, especially dB-scaled spectrogram, resulted in a much higher F1 score and accuracy than the facial features. Therefore, it can be concluded that using the voice feature was more relevant and in need of less data than the facial feature. The use of a dB-scaled spectrogram had a better outcome than an amplitude spectrogram, even though the amplitude spectrogram also had better result than the facial features. However, the best result was obtained by the multimodal feature, which used the dB-scaled spectrogram as the audio representation, and CAE as the facial feature extraction. The multimodal feature slightly increased the accuracy even though it used more resources.
According to these results, it can be said that with the existence of enough resources, it’s recommended to use multimodal features. However, in case of limited resources, it is best to use only the voice feature as it can still produce an acceptable result. The confusion matrix of using the multimodal and voice feature by using the dB-scaled spectrogram audio representation has been provided in Table 8.
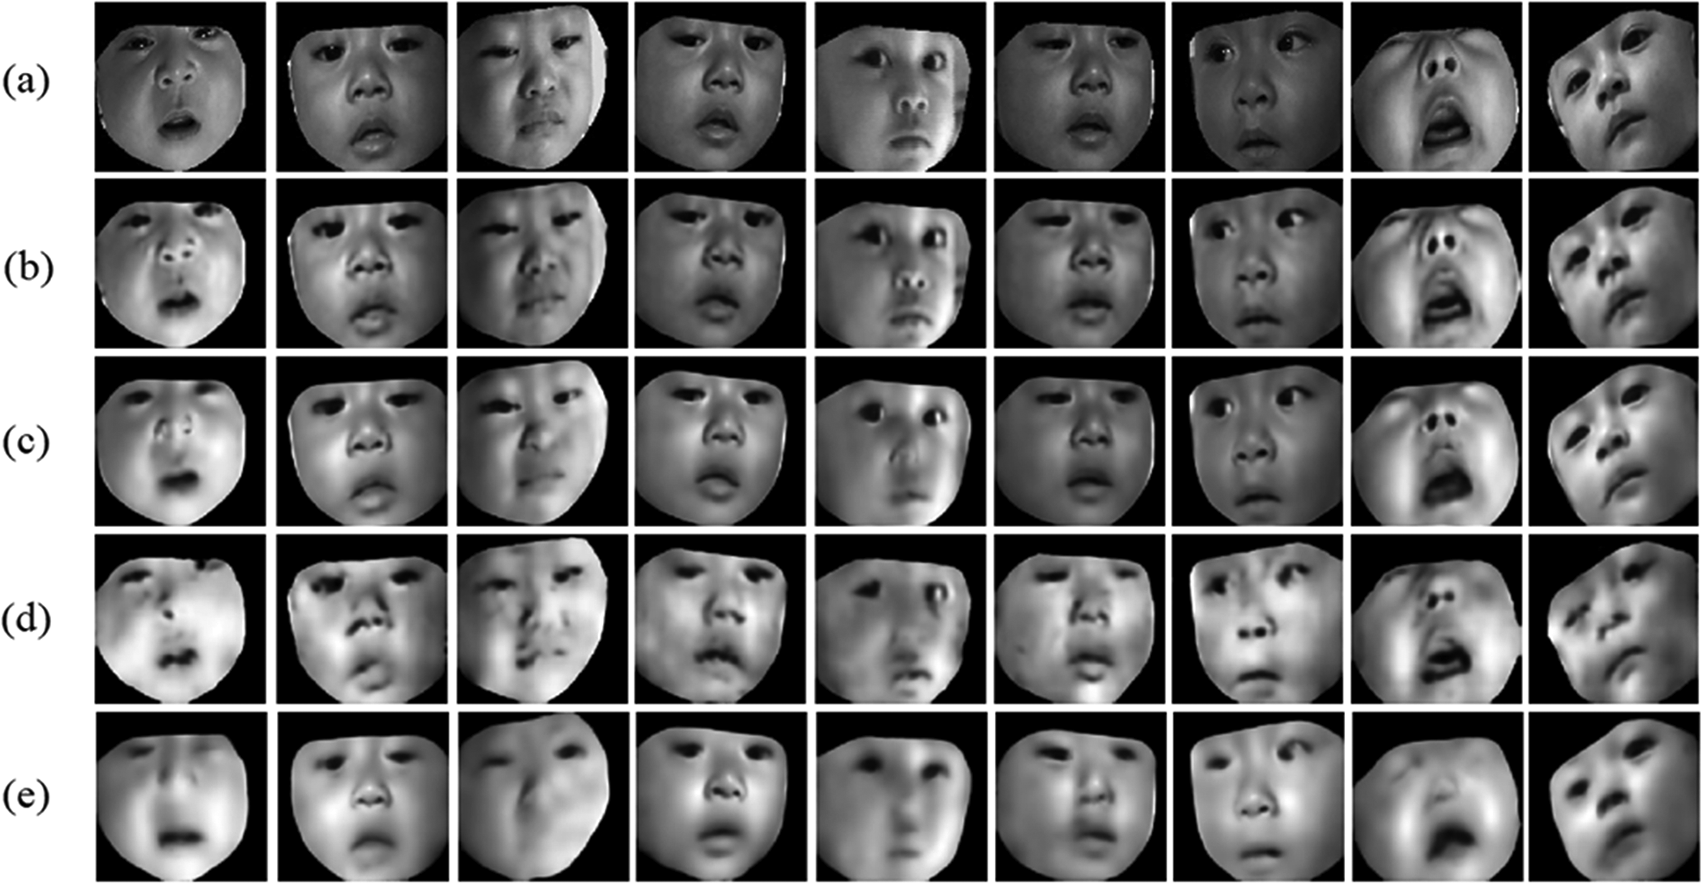
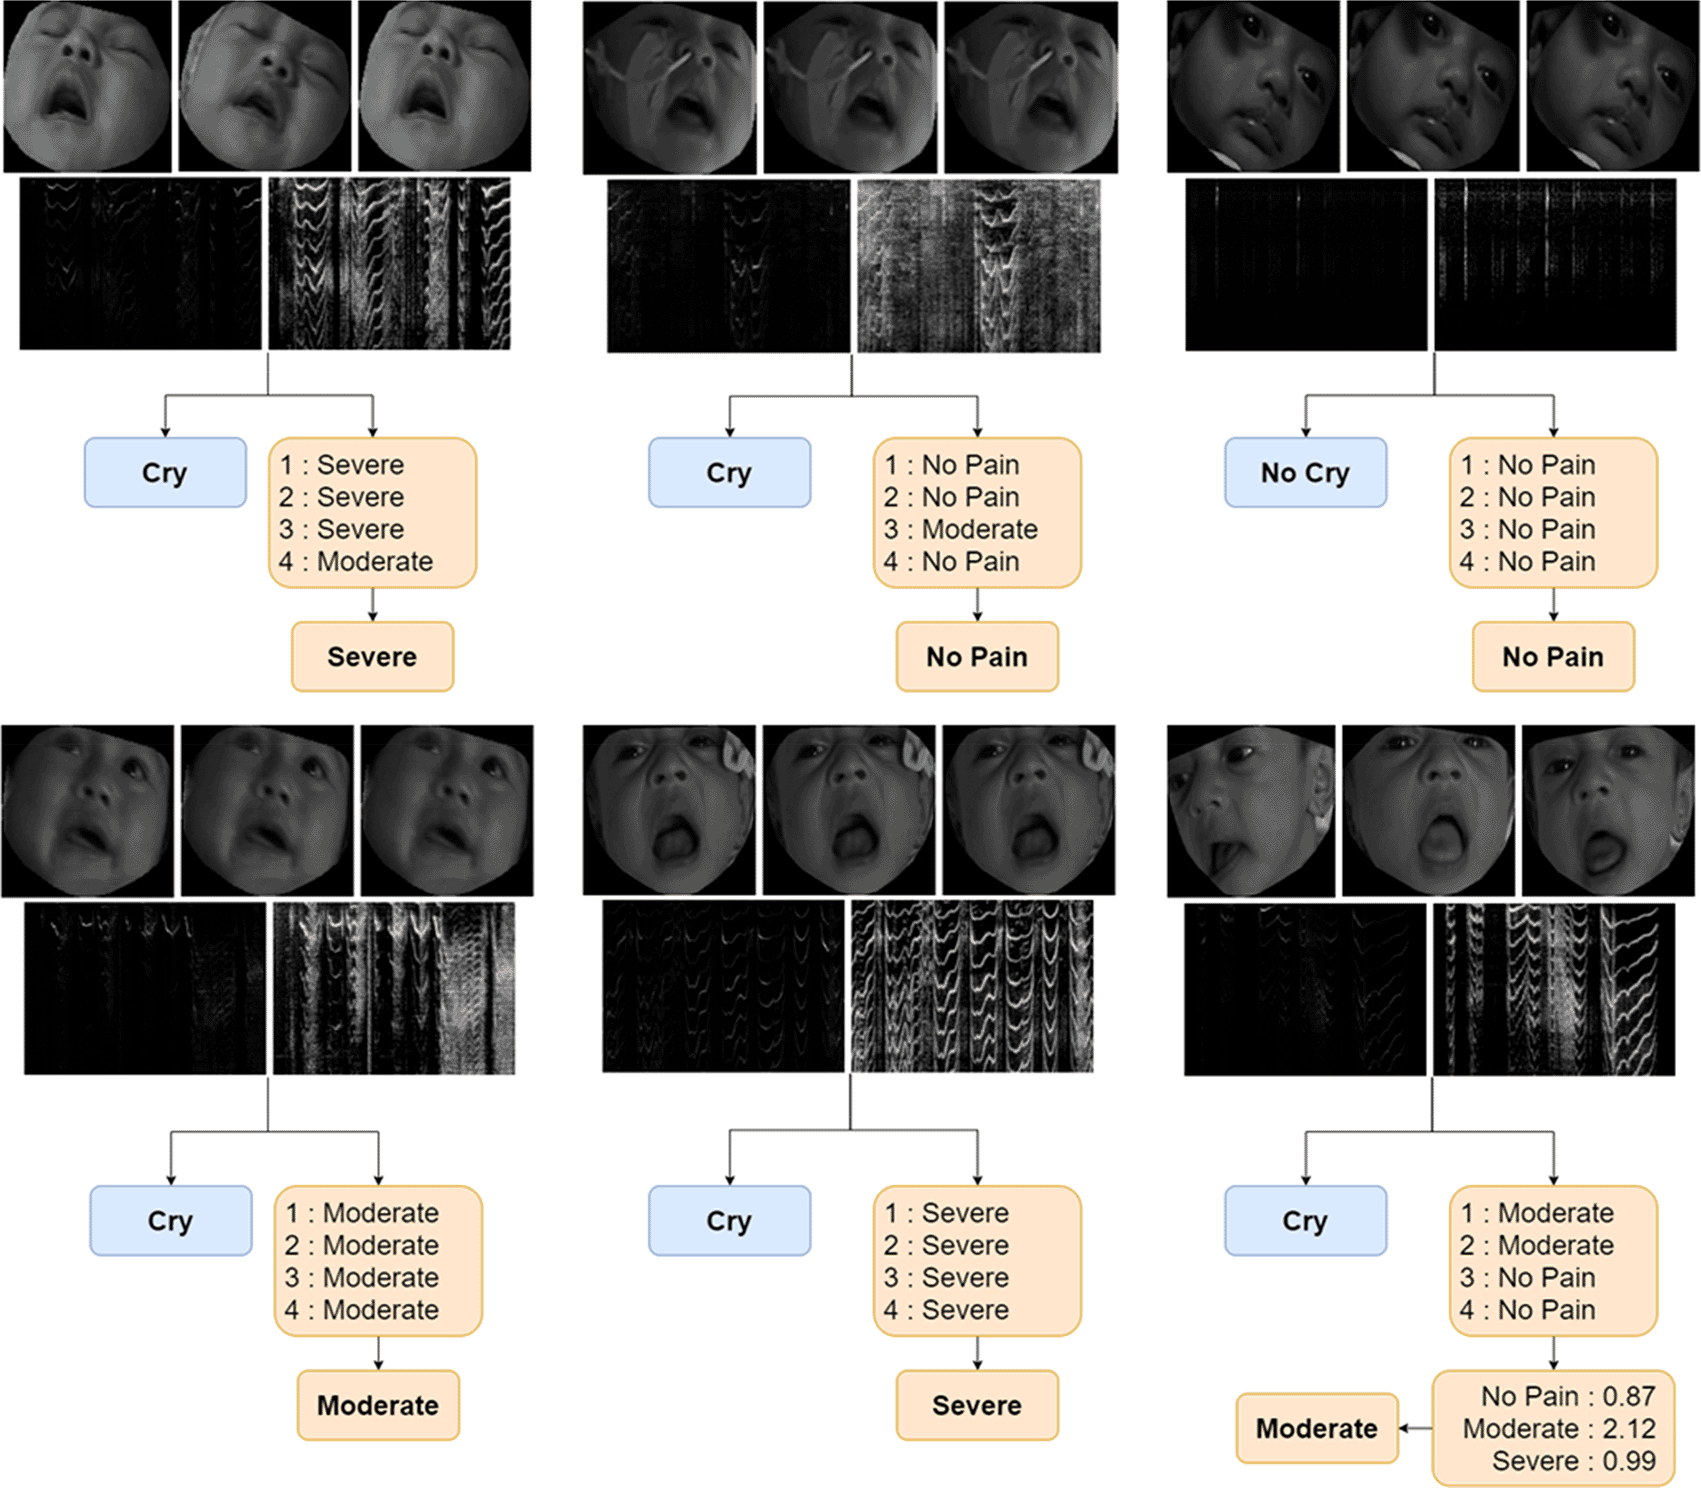
The result for pain classification problem is shown in Table 9. It provided extremely high accuracy and F1 score for most cases, even when the first distribution gave a very low result. Therefore, the best method and feature from the first distribution was selected. The highest result came from the model that used the multimodal feature with CAE for face autoencoder, and the dB-scaled spectrogram as its audio representation. However, this parameter only produced a slightly better result than other parameters. This result was also not good enough to be titled as the best model for pain classification. Therefore, the top-four models were ranked based on their F1 scores. Ensemble of these four models were tested with the use of several methods, and the best result was produced using the majority votes technique and the tiebreaker of the sum of each model’s probability from the four models. This ensemble model had a better result based on the accuracy and F1 score. The confusion matrix for this ensemble model can be seen in Table 10. The input and output example in has also been provided in Figure 11.
| No pain | Moderate | Severe | |
|---|---|---|---|
| No pain | 153 | 11 | 4 |
| Moderate | 7 | 104 | 21 |
| Severe | 5 | 57 | 70 |
In this paper, several methods have been tested for building a deep learning model for pain and cry detection systems. It is evident that a voice feature was more relevant than a facial expression for pain detection. However, the combination of both features can achieve a higher score. Based on this finding, it can be suggested that multimodal representation such as combination with a physiological parameter of vital signs should be considered more in future work. Severe stimuli resulting vital sign parameters such as increase in heartbeat, changes in breathing patterns, oxygenation instead of a change of face and cry pattern should be explored.
The limited amount of data may introduce bias, however this paper was able to achieve a relatively good result from the use of the proposed method. To improve the performances even further, increasing the data amount would have a significant effect.
A patient monitoring system is very important, as most of the pain scores are subjective. This findings support the hospital monitoring system and increase awareness of health care providers for the infant's pain. If the pain persists, modifying the pain medication may be needed.
This study has introduced a method for cry and pain detection by using the infant’s facial expression and voice. In addition, an alternative method in cases with limited resources have been provided. It has been shown that the infant’s voice is a more relevant feature than the facial expression, but the two features combined can obtain a better result.
For feature extraction, it has been demonstrated that CAE performs better than VAE for facial expression and voice spectrograms. This is because VAE is used more for generating new data rather than extracting features. Moreover, it has been shown that using dense latent-vector in the autoencoder increased the reconstruction loss.
Figshare: Ensemble of multimodal deep learning autoencoder for infant cry and pain detection. https://doi.org/10.6084/m9.figshare.16910299.v1.16
This project contains the following underlying data:
The data file contains the labels for video dataset for multi modal infant pain and cry classification.
Data are available under the terms of the Creative Commons Zero “No rights reserved” data waiver (CC0 4.0 Public domain dedication).
Conceptualization, Y.K. and M.T.A.S.; methodology, Y.K. and M.T.A.S.; software, Y.K. and N.S. validation, N.S., Y.K. and M.T.A.S.; formal analysis, N.S. and Y.K.; investigation, N.S., Y.K., M.T.A.S. and E.H.; resources, N.S. and E.H., and Y.K.; writing—original draft preparation, N.S., Y.K. and M.T.A.S.; writing—review and editing, N.S., Y.K. and M.T.A.S.; visualization, N.S. and Y.K.; supervision, Y.K., M.T.A.S., and E.H.; project administration, N.S., Y.K. and M.T.A.S.; funding acquisition, M.T.A.S. All authors have read and agreed to the published version of the manuscript.
| Views | Downloads | |
|---|---|---|
| F1000Research | - | - |
|
PubMed Central
Data from PMC are received and updated monthly.
|
- | - |
Provide sufficient details of any financial or non-financial competing interests to enable users to assess whether your comments might lead a reasonable person to question your impartiality. Consider the following examples, but note that this is not an exhaustive list:
Sign up for content alerts and receive a weekly or monthly email with all newly published articles
Already registered? Sign in
The email address should be the one you originally registered with F1000.
You registered with F1000 via Google, so we cannot reset your password.
To sign in, please click here.
If you still need help with your Google account password, please click here.
You registered with F1000 via Facebook, so we cannot reset your password.
To sign in, please click here.
If you still need help with your Facebook account password, please click here.
If your email address is registered with us, we will email you instructions to reset your password.
If you think you should have received this email but it has not arrived, please check your spam filters and/or contact for further assistance.
Comments on this article Comments (0)