Keywords
Artificial neural networks, Nonlinear estimation, LVDT, FPGA, Sensor modelling
This article is included in the Artificial Intelligence and Machine Learning gateway.
This article is included in the Manipal Academy of Higher Education gateway.
Artificial neural networks, Nonlinear estimation, LVDT, FPGA, Sensor modelling
Displacement reflects the dynamicity of the product under consideration. At certain instants, the dynamicity provides a metric of the stability of an object. Monitoring of the displacement is an important process in understanding the health of a structure. Several studies have discussed the relevance and importance of displacement measurements. For instance, the flexible loading of steel beams was analysed by measuring their displacement under a unit load using sensors such as Linear Variable Differential Transformers (LVDTs) and imaging techniques.1 Experiments have been conducted to study the fatigue behaviour of the Quisi and Ferrandet Bridges (twin 170-m-long steel railway bridges) using deflection sensors like strain gauges and LVDTs.2 The monitoring of irregularities on rail tracks has been carried out by measuring their displacement using an LVDT placed on a scaled vehicle.3 Instrumentation systems have been designed to measure the strain exerted on a reinforced polymer confined concrete beam using an LVDT,4 and the robustness of built structures has been tested by measuring the strain using LVDTs and accelerometers.5 LVDT displacement sensor is used to analyse the elasticity of asphalt and to measure the displacement caused by the application of load, axial, lateral, and Von Mises strain to a composite fibre reinforced polymer in confined and unconfined concrete slabs.6 These strain data can also be used to analyse the compressive behaviour of concrete slabs.7 Photogrammetric methods have been used to measure the displacement of geosynthetics during tensile tests.8 In Ref. 9, the flexural behaviour of cement pavement is analysed using distributed fibre optics and LVDT displacement sensors, while10 discusses the stress–strain behaviour of cement floors treated with soil and exposed to different types of seawater. The bonding behaviour of a reinforced concrete mixture subjected to corrosion and partial repair using self-compacting concrete is reported in Ref. 11, where the bonding strength is measured with respect to deformation using LVDTs. In Ref. 12, a fibre optic sensor array is deployed to analyse the strain experienced by sandstone under loading. The progressive damage suffered by masonry under cyclic compression loads and exposure to acoustic emissions is discussed in Ref. 13, with digital imaging and LVDTs used to measure the displacement. The use of LVDTs for the measurement of radial strain due to static and dynamic loading in geomaterials is reported in Ref. 14. Thus, displacement sensors are used in many applications and LVDTs are one of the more common sensor types. A brief study on the operation and characteristics of LVDT is now presented.
Sensor instruments typically consist of signal conversion, signal conditioning, and display unit blocks, each of which is needed to achieve error-free measurements. In Ref. 15, the design of a signal conditioning circuit using an amplifier, filter, and other elementary components is reported. The output of an LVDT is conditioned using modulation and demodulation circuits to obtain a calibrated result. The LVDT output is suitable for use in compensating a fibre optic interferometric instrument.16 A lookup table can be used to produce a linear/calibrated output from an LVDT.17 To compensate the nonlinearity in the LVDT response, a least-mean-square system has been developed as a compensator for nonlinearity.18 Signal conditioning using a dual slope converter circuit can be applied to an LVDT for the measurement of displacement.19 The alternating current (AC) output of the LVDT is converted to a direct current (DC) signal using a Root Mean Square (RMS)-to-DC converter circuit; the design and implementation of such a circuit are reported in.20 The physical design of the winding in an LVDT can be altered to achieve a higher range of measurement and complemented with an amplifier design for signal conditioning.21 The displacement caused by service loads on a rail bridge has been measured by an LVDT and transmitted using wireless transmission to a base station through a combination of sensors and the Audrino platform.22 Various flex sensors and LVDTs have been used to monitor the ground movement under the application of a load, with the output transmitted using the Bluetooth transmission principle.23 A combination of differential amplifiers and RMS-to-DC converter circuits have been used for signal conditioning of the LVDT output so as to obtain precise positioning results.24 A high-gain amplifier has been designed to improve the measuring range of LVDTs to the nanometre level without affecting their sensitivity,25 and an adaptive optimization circuit has been developed using a neural network to produce a linear output from an LVDT.26 A sine wave oscillator with stable amplitude and frequency phase-matching circuit with pulse width modulating functionality has been reported,27 where the circuit is designed to produce a linear output from the LVDT. A neural network algorithm has also been used to design the inverse function for the sensor characteristics, allowing a linear output to be produced from a sensor cascade in Ref. 28. Neural network algorithms can be used to offset the nonlinearity of LVDTs,29 and ant colony optimization can produce a similar effect.30 Reference 31 reports the design of a signal conditioning circuit for variable reluctance solenoids that enables accurate position and velocity measurements.
Compact LVDTs can be designed to measure the displacement in a reactor, with the entire experimentation based on solving analytical equations that have been validated through an experimental setup.32 Reference 33 reports the enhancement of linearity in an ironless inductive sensor using an improved coil design. A thermal compensation algorithm can also be used to achieve higher accuracy. Analogue filters and neural network algorithms can be used to improve the characteristics of LVDTs,34 and application-specific integrated circuits have been developed to implement the signal conditioning circuits for LVDT sensors, consisting of an amplifier and a lookup table for producing a calibrated output.35 A combination of analogue amplifiers and multipliers can be used to provide the transfer characteristics,36 which are the inverse of the LVDT characteristics, resulting in a highly sensitive and linear output from a cascade. Reference 37 analyses the performance of an oscillator-based signal conditioning circuit for calibrating the output of LVDTs. Algorithms based on support vector machines have been used to design an automatic ranging functionality for LVDTs,38 and an analytical model of LVDTs has been developed to analyse their performance.39 Through the many techniques that have been developed to overcome the difficulties created by the nonlinear response characteristics of LVDTs, it is clear that linearization over a certain range of input scale is an important concept. Further, the output of LVDTs depends on several parameters, such as the number of turns of the primary and secondary windings, the dimensions of the primary and secondary windings, the excitation frequency, and environmental characteristics like the temperature. Most reported calibration techniques consider the LVDT parameters to be fixed, and so the calibration process must be repeated every time the parameters change.
Most previous studies only consider the linearization of the LVDT over a portion of the input range, and do not consider any adaptation to the various LVDT parameters. These limitations motivated us to search for a better calibration technique for LVDTs. This paper describes an intelligent adaptive calibration technique using an optimized Artificial Neural Network (ANN) for displacement measurements by LVDT. This optimized ANN is trained to obtain linearity over the whole input range and allows the output to adapt to changes in the physical parameters of the LVDT, the excitation frequency, and the temperature. The proposed intelligent calibration technique is implemented on a field programmable gate array (FPGA) and temperature measurements are performed in real time.
A block diagram of a displacement measurement system based on an LVDT is shown in Figure 1. A brief description of each block is presented below.

An LVDT is a transducer used to measure linear displacement that operates on the principle of mutual inductance. Figure 2 shows an illustration of an LVDT. There is moveable soft iron core positioned between three coils (one primary and two secondary). The primary coil is excited by an AC source of frequency f. The two secondary coils run along the same axis as the primary coil, and are connected in a series opposition way so as to monitor the change in displacement in both directions. Figure 3 provides a sliced view of the coils, clarifying their arrangement. Due to the excitation in the primary coil and in the vicinity of the secondary coils, a mutual inductance develops and produces voltages of V1 and V2 across the coils, respectively. If the core is displaced in either direction, the voltages across the secondary coils will vary, while that across the primary coil will remain constant. The variation in the secondary voltage will be proportional to the displacement of the core.40–43
The LVDT can be described by the following equations. The voltages generated in secondary coils 1 and 2 are given by Equations (1) and (2), respectively.
Ip - primary current due to excitation Vp
x1 - distance penetrated by the armature towards secondary coil 1
x2 - distance penetrated by the armature towards secondary coil 2
np - number of turns in primary winding
ns - number of turns in secondary winding
f - frequency of excitation of primary coil
Taking La = 3b, the differential voltage v = v1 - v2 is given by
The primary current Ip is given by
The inductance of a coil changes with variations in temperature. This relation can be written as44
The output signal of the LVDT is converted to a DC signal which is proportional to the displacement to be measured. This is done using an ‘LTC1967 AC to DC converter’. The mathematical relation used by the LTC196745 is given by
It is important to understand how displacement-measuring instruments respond to variations in the properties of the LVDT. Thus, we consider the influence of the physical parameters of the windings, such as the ratio of the outer and inner coil diameters (ro/ri), ratio of primary and secondary coil lengths (b/m), number of primary windings (np), and number of secondary windings (ns), as well as the excitation frequency (f) and the temperature (t). The LVDT coil diameter, length ratio, and primary/secondary winding numbers can be varied to obtain different types of LVDT. The excitation frequency and temperature also vary under different working conditions. From the equations presented in the previous section, it is apparent that the output voltage obtained from the LVDT with respect to variations in displacement depend on one or all of the parameters discussed. The performance of an LVDT was therefore analysed by setting ro/ri to 2, 4, and 6; setting b/m to 0.25, 0.5, and 0.75; setting np to 100, 200, and 300; setting ns to 100, 200, and 300; setting f to 2.5 kHz, 5 kHz, and 7.5 kHz, and setting t to 25°C, 50°C, and 75°C. Under each of these conditions, the output responses obtained by the LVDT for various displacements are plotted in Figures 4–9.
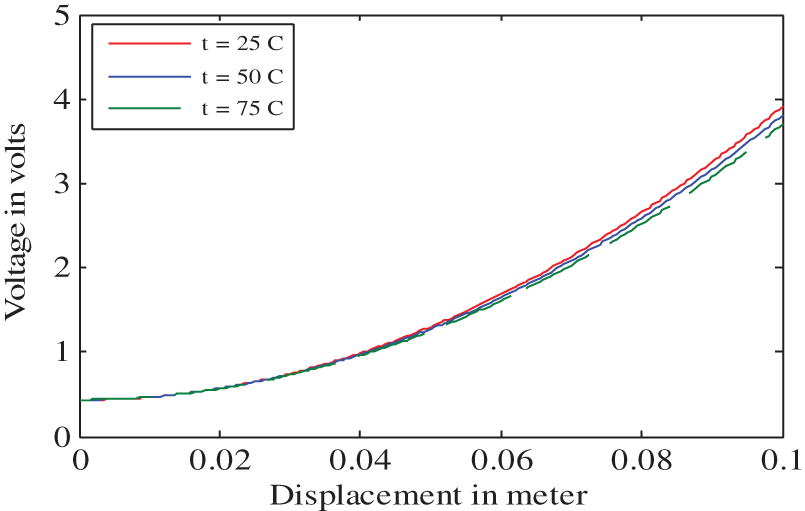
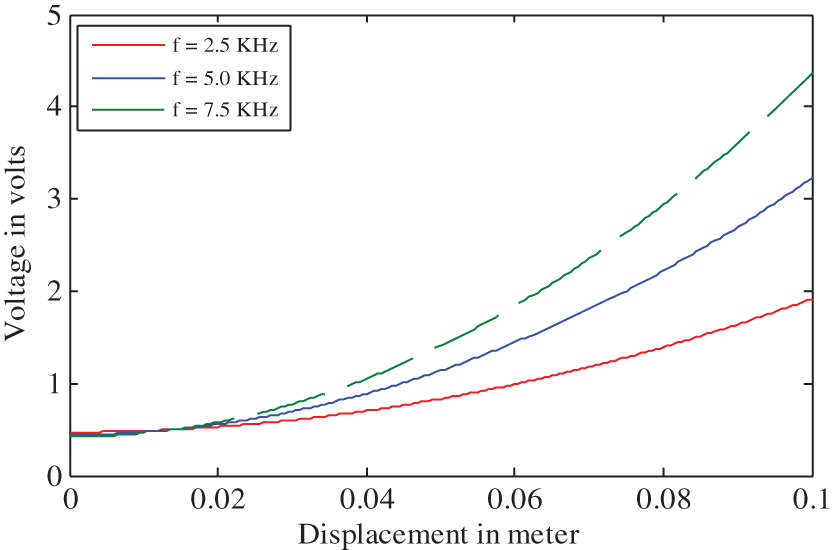
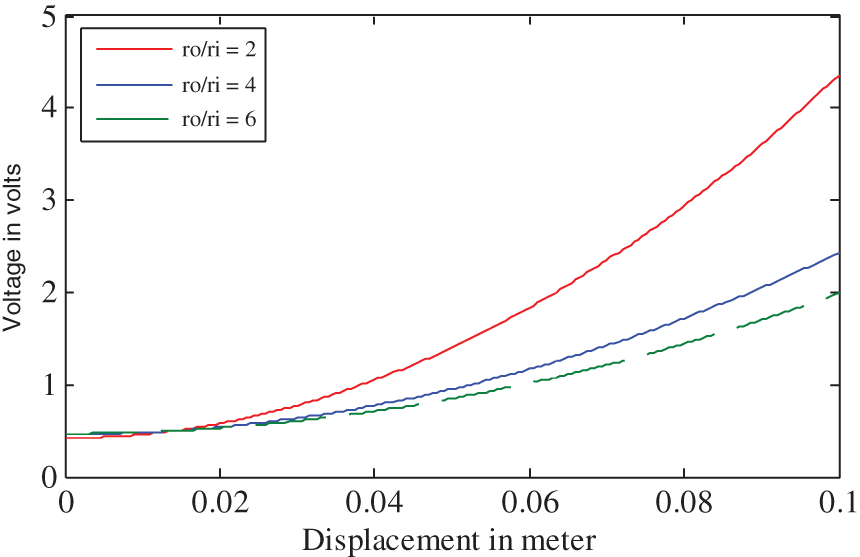

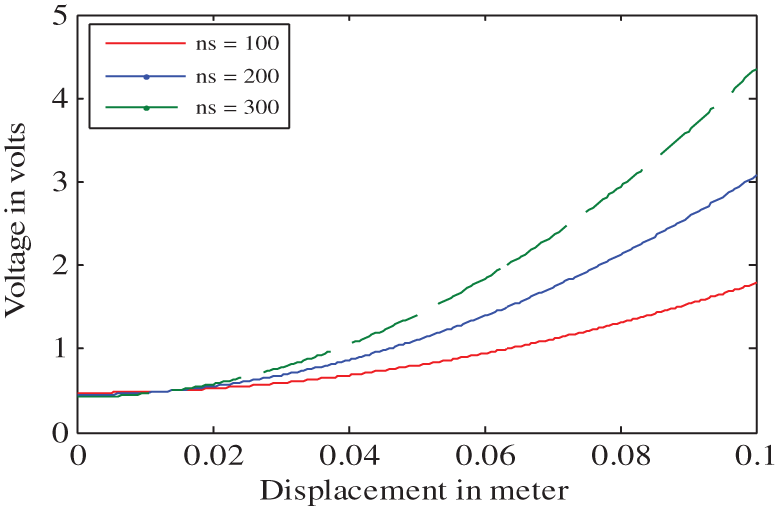
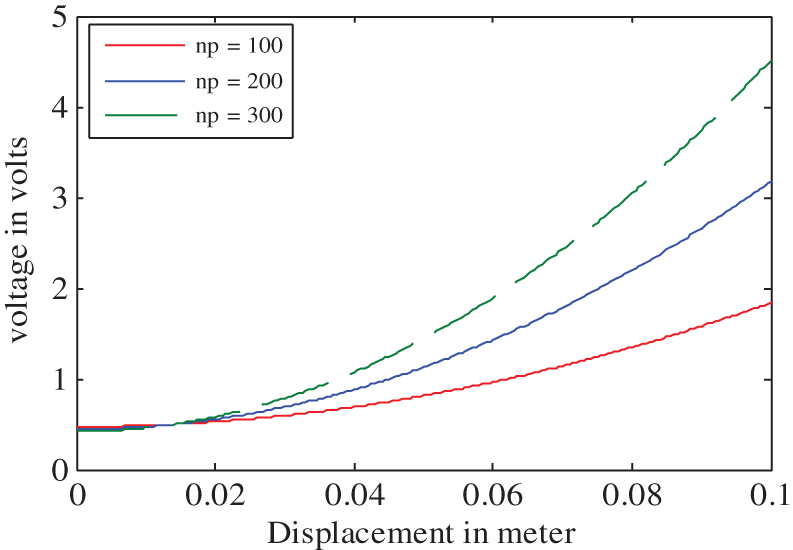
The input–output responses of the LVDT plotted in Figures 4–9 show that the LVDT produces nonlinear characteristics, despite theoretically being a linear transducer. It can also be observed that the outputs depend on the physical parameters of the sensor and environmental factors. From the available literature, it is clear that researchers have worked on linearizing the LVDT output over 10–80% of its workable range, indicating that there is scope for improvement.2–24 Additionally, it has been reported that the instrumentation must be recalibrated whenever the physical parameters have undergone changes.27–31 Thus, the solution presented in this paper attempts to overcome these limitations.
The objective of this work is to design and implement an intelligent calibration technique on the Spartan-3E FPGA so that displacement measurements using an LVDT produce a linear output over the full range of the input scale. Additionally, the proposed system can adapt to variations in the physical parameters of the LVDT, the excitation frequency, and the temperature using the concept of an optimized ANN.
To achieve the objective of designing an intelligent calibration technique which would increase the working linear range of the LVDT and make the instrument adaptive to variations in its physical parameters, a neural network model is proposed. A block diagram representation of displacement measurements with the proposed intelligent calibration technique is shown in Figure 10. The proposed instrumentation system consists of a program using neural network algorithms46–50 which will be trained to produce a linear output and resist the influence of changes in the physical parameters. Training the neural network is a process of tuning the neural network model to produce output such that the LVDT produces linear output for the full range, input data for the training is the output of data conversion circuit for varying displacement, b/m ratio, ro/ri, ns, np, supply frequency and temperature (the full training data has been provided in Underlying data51). Further, an attempt is made to enhance the functioning of the neural network model by considering network optimization and a transfer function. Matlab R2000b (RRID: SCR_001622) version is used for training the neural network. The custom code created as part of this research is available in Extended data. The code is also compatible with the open source software Scilab.
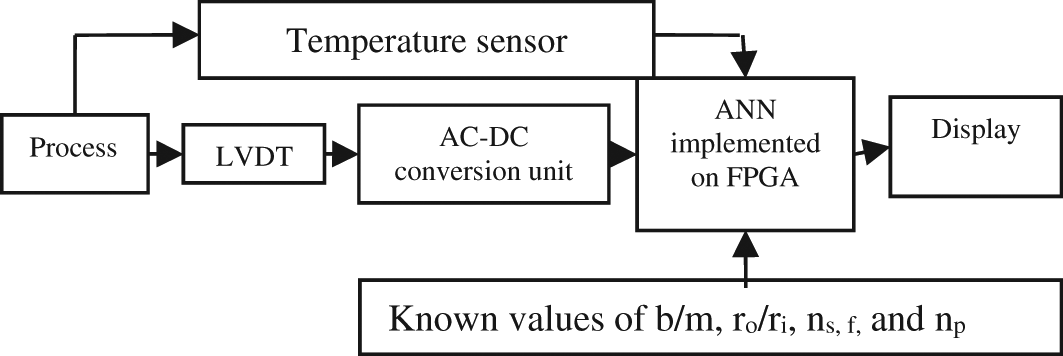
ANN, Artificial Neural Network; LVDT, Linear Variable Differential Transformer; FPGA, Field Programmable Gate Array.
The neural network is trained using the LVDT output from data conversion circuit for variation in displacement and the ratio of the outer and inner coil diameters (ro/ri), ratio of primary and secondary coil lengths (b/m), number of primary windings (np), and number of secondary windings (ns), as well as the excitation frequency (f) and the temperature (t). These data act as inputs to the neural network, and the linear output is a target matrix which is independent of variations caused by changes in physical parameters and relates only to the input displacement.
In matrix notation, the final output is obtained as
In the proposed solution, the neural network model employs a multilayer perceptron to train the system. The neural network model consists of an input layer, hidden layer, and output layer. The input layer is used to receive the inputs for the network model. The hidden layer considers a network of neurons arranged in multiple layers. Various algorithms can be used to train the neural network model. In this study, we consider five standard, openly available training algorithms, named (for the purposes of this study) AL1–AL5. These are, respectively, stochastic gradient descent,46 Nesterov accelerated gradient,47 adaptive gradient descent,48 adaptive moment estimation,49 and resilient backpropagation.50 The number of hidden layers and the transfer functions of the neurons can also be varied to obtain the desired objective from the neural network.
The designed program using neural network algorithm after training is downloaded on the FPGA chipset to be used in a displacement measurement system consist of LVDT. For the FPGA programming using MATLAB, the steps included adding details of hardware used (Spartan-3E FPGA kit), followed by code generation, synthesis, verification and testing. The memory and processing time of the chipset are vital parameters which should be considered when applied for testing in real-time applications. To achieve a neural network model with the best utilization of memory and processing time, it is vital to ensure an optimized network. To optimize the model, the number of hidden layers and the transfer functions of the neurons are varied and different combinations are tested. Table 1 presents the mean square error (MSE) obtained with various algorithms and numbers of hidden layers (see datalogging.xlsx in Underlying data). AL5 gives the lowest MSE with six hidden layers in the neural network algorithm. A higher number of hidden layers reduces the computation speed and increases the memory requirements. Hence, AL5 with two hidden layers is considered a suitable trade-off between the error component and the computational requirements.
For the chosen neural network model consisting of resilient backpropagation with two hidden layers, a suitable neuron transfer function must be determined to achieve an optimized neural network model. The MSEs obtained with the Tanh, Sigmoid, Linear Tanh, Linear Sigmoid, Softmax, Bias, Linear, Axon, Tansig, and Logsig transfer functions are listed in Table 2. From the table, it is clear that a neural network model with AL5, two hidden layers, and the Axon transfer function is optimal. The complete set of parameters in the final neural network model is given in Table 3.
| Sl.no | Transfer function | MSE |
|---|---|---|
| 1. | Tanh | 3.78E-5 |
| 2. | Sigmoid | 2.66E-5 |
| 3. | Linear Tanh | 1.27E-5 |
| 4. | Linear sigmoid | 1.03E-5 |
| 5. | Softmax | 8.62E-6 |
| 6. | Bias | 3.11E-5 |
| 7. | Linear | 4.02E-5 |
| 8. | Axon | 7.33E-6 |
| 9. | Tansig | 9.96E-6 |
| 10. | Logsig | 8.98E-6 |
| Optimized parameter values | ||
|---|---|---|
| Database | Training base | 90 |
| Validation base | 30 | |
| Test base | 30 | |
| No of neurons in | 1st layer | 7 |
| 2nd layer | 8 | |
| Transfer function of | 1st layer | Axon |
| 2nd layer | Axon | |
| Output layer | Linear | |
| Input | Disp. (mm) | ro/ri | b/m | ns | np | f (kHz) | t (°C) |
|---|---|---|---|---|---|---|---|
| min | 0.0 | 2 | 0.25 | 100 | 100 | 2.5 | 25 |
| max | 100 | 6 | 0.75 | 300 | 300 | 7.5 | 75 |
This section presents the results obtained by the intelligent displacement measuring instrumentation system consisting of LVDT as a sensor, followed by data conversion circuit, and a trained optimized neural network model, when subjected to measurement. 182 Tests were carried out to evaluate the performance of the intelligent calibration technique for linearity and adaptation. For testing purposes, the range of displacement was considered from 0–100 mm, the range of ro/ri was set to 2–6, the range of b/m was set to 0.25–0.75, the range of ns was set to 100–300, the range of np was set to 100–300, the range of f was set to 2.5–7.5 kHz, and the temperature range was set to 25–75°C. The displacement measurements (available in train data.xlsx in Underlying data) with the proposed soft calibration technique based on the optimized ANN for various input displacements and combinations of ro/ri, b/m, ns, np, f, and temperature are listed in Table 4. The root mean square of the percentage error is 0.0431%.
The performance of the proposed intelligent displacement measurement technique was tested in a real-life scenario in a laboratory setup using an FPGA board. The experimental setup for this purpose is shown in Figure 11. Three different cases (to demonstrate the condition of the senser under particular variable values) were considered and the results are presented in Table 5 (datalogging.xlsx in Underlying data). Figure 12 shows the input output plot obtained from the designed work, it is seen from the figure that the output of the proposed system is varying linearly with the input over the full input range and the output of LVDT is independent of variation in physical parameters of the LVDT.
The calibration of any instrumentation system is an important process for ensuring the system behaves as expected. The process of calibration is time-consuming and involves substantial costs. Hence, it is very important to have an efficient calibration process. In this study, an intelligent calibration technique using a neural network model was designed. The neural network model was trained to produce a linear output from the nonlinear signal received from the data conversion circuits of an LVDT. The neural network was then trained to produce an output which would be independent of variations in the physical parameters of the LVDT sensor, such as the ratio of the inner and outer coil diameters, the ratio of secondary and primary coil windings, and the number of windings in the primary/secondary coils, as well as the excitation frequency applied to the LVDT primary winding and the atmospheric temperature around the LVDT.
The calibration system was developed on an FPGA board to allow for the physical implementation of the measurement system. Thus, an optimized neural network model was an important concern. The neural network model was optimized by testing various training algorithms, numbers of hidden layers, and transfer functions. In the optimization process, the MSE was considered as the cost function. The resilient backpropagation scheme with two hidden layers and the Axon transfer function was found to produce the optimal MSE, when considering the trade-off between accuracy and computational resources. The test results under simulation conditions and real-life conditions demonstrate that the reported calibration technique produces a linear output, offsetting the nonlinearity that exists in conventional measurement systems. Additionally, the system produces very low measurement errors, even with variations in the physical LVDT parameters, with a root mean square error of 2.8%. The system can be further improved by optimizing the algorithm and considering other variables in the sensor system which influence the measurement output.
Open Science Framework: LVDT. https://doi.org/10.17605/OSF.IO/94NPQ.51
This project contains the following underlying data:
Open Science Framework: LVDT. https://doi.org/10.17605/OSF.IO/94NPQ.51
This project contains the following extended data:
• program.sce (code that can be used to replicate the reported work in MATLAB (R2020b). The code is also compatible with the open source software Scilab.)
Data are available under the terms of the Creative Commons Attribution 4.0 International license (CC-BY 4.0).
| Views | Downloads | |
|---|---|---|
| F1000Research | - | - |
|
PubMed Central
Data from PMC are received and updated monthly.
|
- | - |
Is the work clearly and accurately presented and does it cite the current literature?
Partly
Is the study design appropriate and is the work technically sound?
No
Are sufficient details of methods and analysis provided to allow replication by others?
No
If applicable, is the statistical analysis and its interpretation appropriate?
No
Are all the source data underlying the results available to ensure full reproducibility?
Partly
Are the conclusions drawn adequately supported by the results?
Partly
Competing Interests: No competing interests were disclosed.
Reviewer Expertise: deep learning for medical applications, FPGA for ultrasound application.
Is the work clearly and accurately presented and does it cite the current literature?
Yes
Is the study design appropriate and is the work technically sound?
Yes
Are sufficient details of methods and analysis provided to allow replication by others?
Yes
If applicable, is the statistical analysis and its interpretation appropriate?
Yes
Are all the source data underlying the results available to ensure full reproducibility?
Yes
Are the conclusions drawn adequately supported by the results?
Yes
Competing Interests: This reviewer received an honorarium for their review work from Research Square. This reviewer has no other relevant financial or other relationships to disclose.
Reviewer Expertise: FPGA, NN, Security, DSP, Hardware
Alongside their report, reviewers assign a status to the article:
| Invited Reviewers | ||
|---|---|---|
| 1 | 2 | |
|
Version 1 30 Mar 22 |
read | read |
Provide sufficient details of any financial or non-financial competing interests to enable users to assess whether your comments might lead a reasonable person to question your impartiality. Consider the following examples, but note that this is not an exhaustive list:
Sign up for content alerts and receive a weekly or monthly email with all newly published articles
Already registered? Sign in
The email address should be the one you originally registered with F1000.
You registered with F1000 via Google, so we cannot reset your password.
To sign in, please click here.
If you still need help with your Google account password, please click here.
You registered with F1000 via Facebook, so we cannot reset your password.
To sign in, please click here.
If you still need help with your Facebook account password, please click here.
If your email address is registered with us, we will email you instructions to reset your password.
If you think you should have received this email but it has not arrived, please check your spam filters and/or contact for further assistance.
Comments on this article Comments (0)