Keywords
task switching, experimental design, software, cognitive task, switch cost
This article is included in the Mini Hacks collection.
task switching, experimental design, software, cognitive task, switch cost
In response to feedback received during peer review, we have updated the text’s Methods section and further contextualized our work within existing task switching literature. The first addition to the Methods section details the different implications of including varying inter trial intervals in neuroimaging or online versions of the task. Our second addition to the Methods section clarifies how we defined and computed switch costs. To contextualize this work within wider task switching literature, we added sentences in the Introduction and Limitations to ensure readers are aware that results from our experiment may not generalize to task switching studies with more standard designs. In the Introduction and Limitations sections, we state that our paradigm does not consistently introduce a switch cost, and we clarified that our task design does not permit comparison of switch vs restart costs, nor mixing costs, which may have influenced the ability to induce switch costs. Further additions to the introduction emphasized how and why our paradigm is intentionally different from most task switching paradigms. These additions state our paradigm enables investigators to study research questions traditional task switching paradigms are not well-suited to investigating, such as evaluating the neural correlates of large set shifts.
See the authors' detailed response to the review by Frini Karayanidis
Switch costs are defined as the deficit in task performance incurred when switching between one task and another.1,2 Behavioral switch costs are observed when comparing successive trials in which participants switch between tasks to those where the same task was repeated. This switch cost can be viewed as a result of the increasing demand on executive function incurred by restructuring one mental “task set” (the goals, rules, and attentional focus unique to one task) to a different one.3,4 Put simply, switch costs may be a result of interference in cognitive restructuring processes. Neuroimaging studies classify the reconfiguration process as a result of the changes in brain network activity and functional connectivity that reflect the changes in task set.5,6 The neural correlates of each task set may be considered the brain state unique to each task set.
Many studies have investigated how unique, overlapping, dissociable, and predicative these brain states are.7–10 To determine how unique the brain states for each task set are, Soreq et al built a classifier that identifies which working memory task a participant was completing based on their brain states.11 They showed that behaviorally distinct aspects of working memory mapped to distinct but densely overlapping patterns of activity and connectivity within the brain, known as the multiple demand cortex.12,13 The differing mental processing characteristics that underpin participant’s task performance are known as psychometric characteristics,14 and three tasks used in Soreq et al’s study- the Digit Span, Spatial Span, and Spatial Rotation- maximized the psychometric distance across orthogonal factors- visuospatial reasoning and verbal reasoning.15 Though all tasks recruited the multiple demand cortex, brain states could be separated according to the working memory processes recruited by each task, showing a high correspondence among behavioral constructs and resulting working memory subprocesses.11,16,17
This invites the follow-up question “How does the brain reconfigure between these different brain states?” The literature here is sparser, with a lack of studies that model how neural networks reconfigure when transitioning from one discrete task to another (referred to as “set switching” or “context switching”18). In future studies we hope to characterize the trajectory neural networks take to effectively switch between tasks. Therefore, we created a cued task switching paradigm that aims to generate a behavioral and physiological switch cost for use in experiments that will characterize, model, and modulate the switch cost. We chose three psychometrically opposed tasks from Soreq et al11 to force distinct reconfiguration from one brain state to the next. Rather than switching between stimulus response mappings or rules, our task switches between entire task sets, similar to.19 Yet our task differs from to Allport's set-shifting task by shifting among different, psychometrically opposed working memory tasks, rather than rules or stimuli within a task. These differences were introduced with the aim of inducing large set shifts observable by fMRI, where future studies may explore how neural networks reconfigure to meet the demands of different working memory tasks.
Two versions of the task exist- one is written in JavaScript to collect behavioral data online, and the other is written in Python for use in neuroimaging studies. These versions are designed to be highly similar to one another. We describe both in detail below, then present the results of two pilot studies. The pilot studies observe that, though the two versions of the task do not consistently induce a switch cost, the paradigm operates within an optimal difficulty range, and participants do not exhibit learning effects. Though our task does not produce traditional switch costs, we believe this paradigm is useful given its highly adaptable, multi-modal, open-source nature.
In this section, we first provide a description of each of the three tasks’ features. Then, we detail how the overall task is compiled, and what sections may be modified to suit different experimental designs.
The cued task switching paradigm switches between three tasks- a Spatial Rotation, Spatial Span, and Digit Span task. Variants of these tasks have been created and implemented over the years.10,20 The essential components of each task are clarified below.
All tasks use a similar stimuli presentation and response framework to reduce visual and motor confounds. Stimuli are created using normed pixel units, and the screen angle is standardized to reduce color variation across devices. Stimuli are presented on a 6x6 grid in the middle of the screen. To ensure the tasks are visually similar, each task’s stimulus grid flashes cells and contain numbers, even if not strictly necessary for the task. After presentation is complete, the stimulus grid disappears, and three answer grids appear in a row across the screen. One of the answer grids contains the correct answer, and the other two have one of the cells from the correct answered shifted, meaning two of the three grids’ answers are incorrect by one cell (Figure 1).
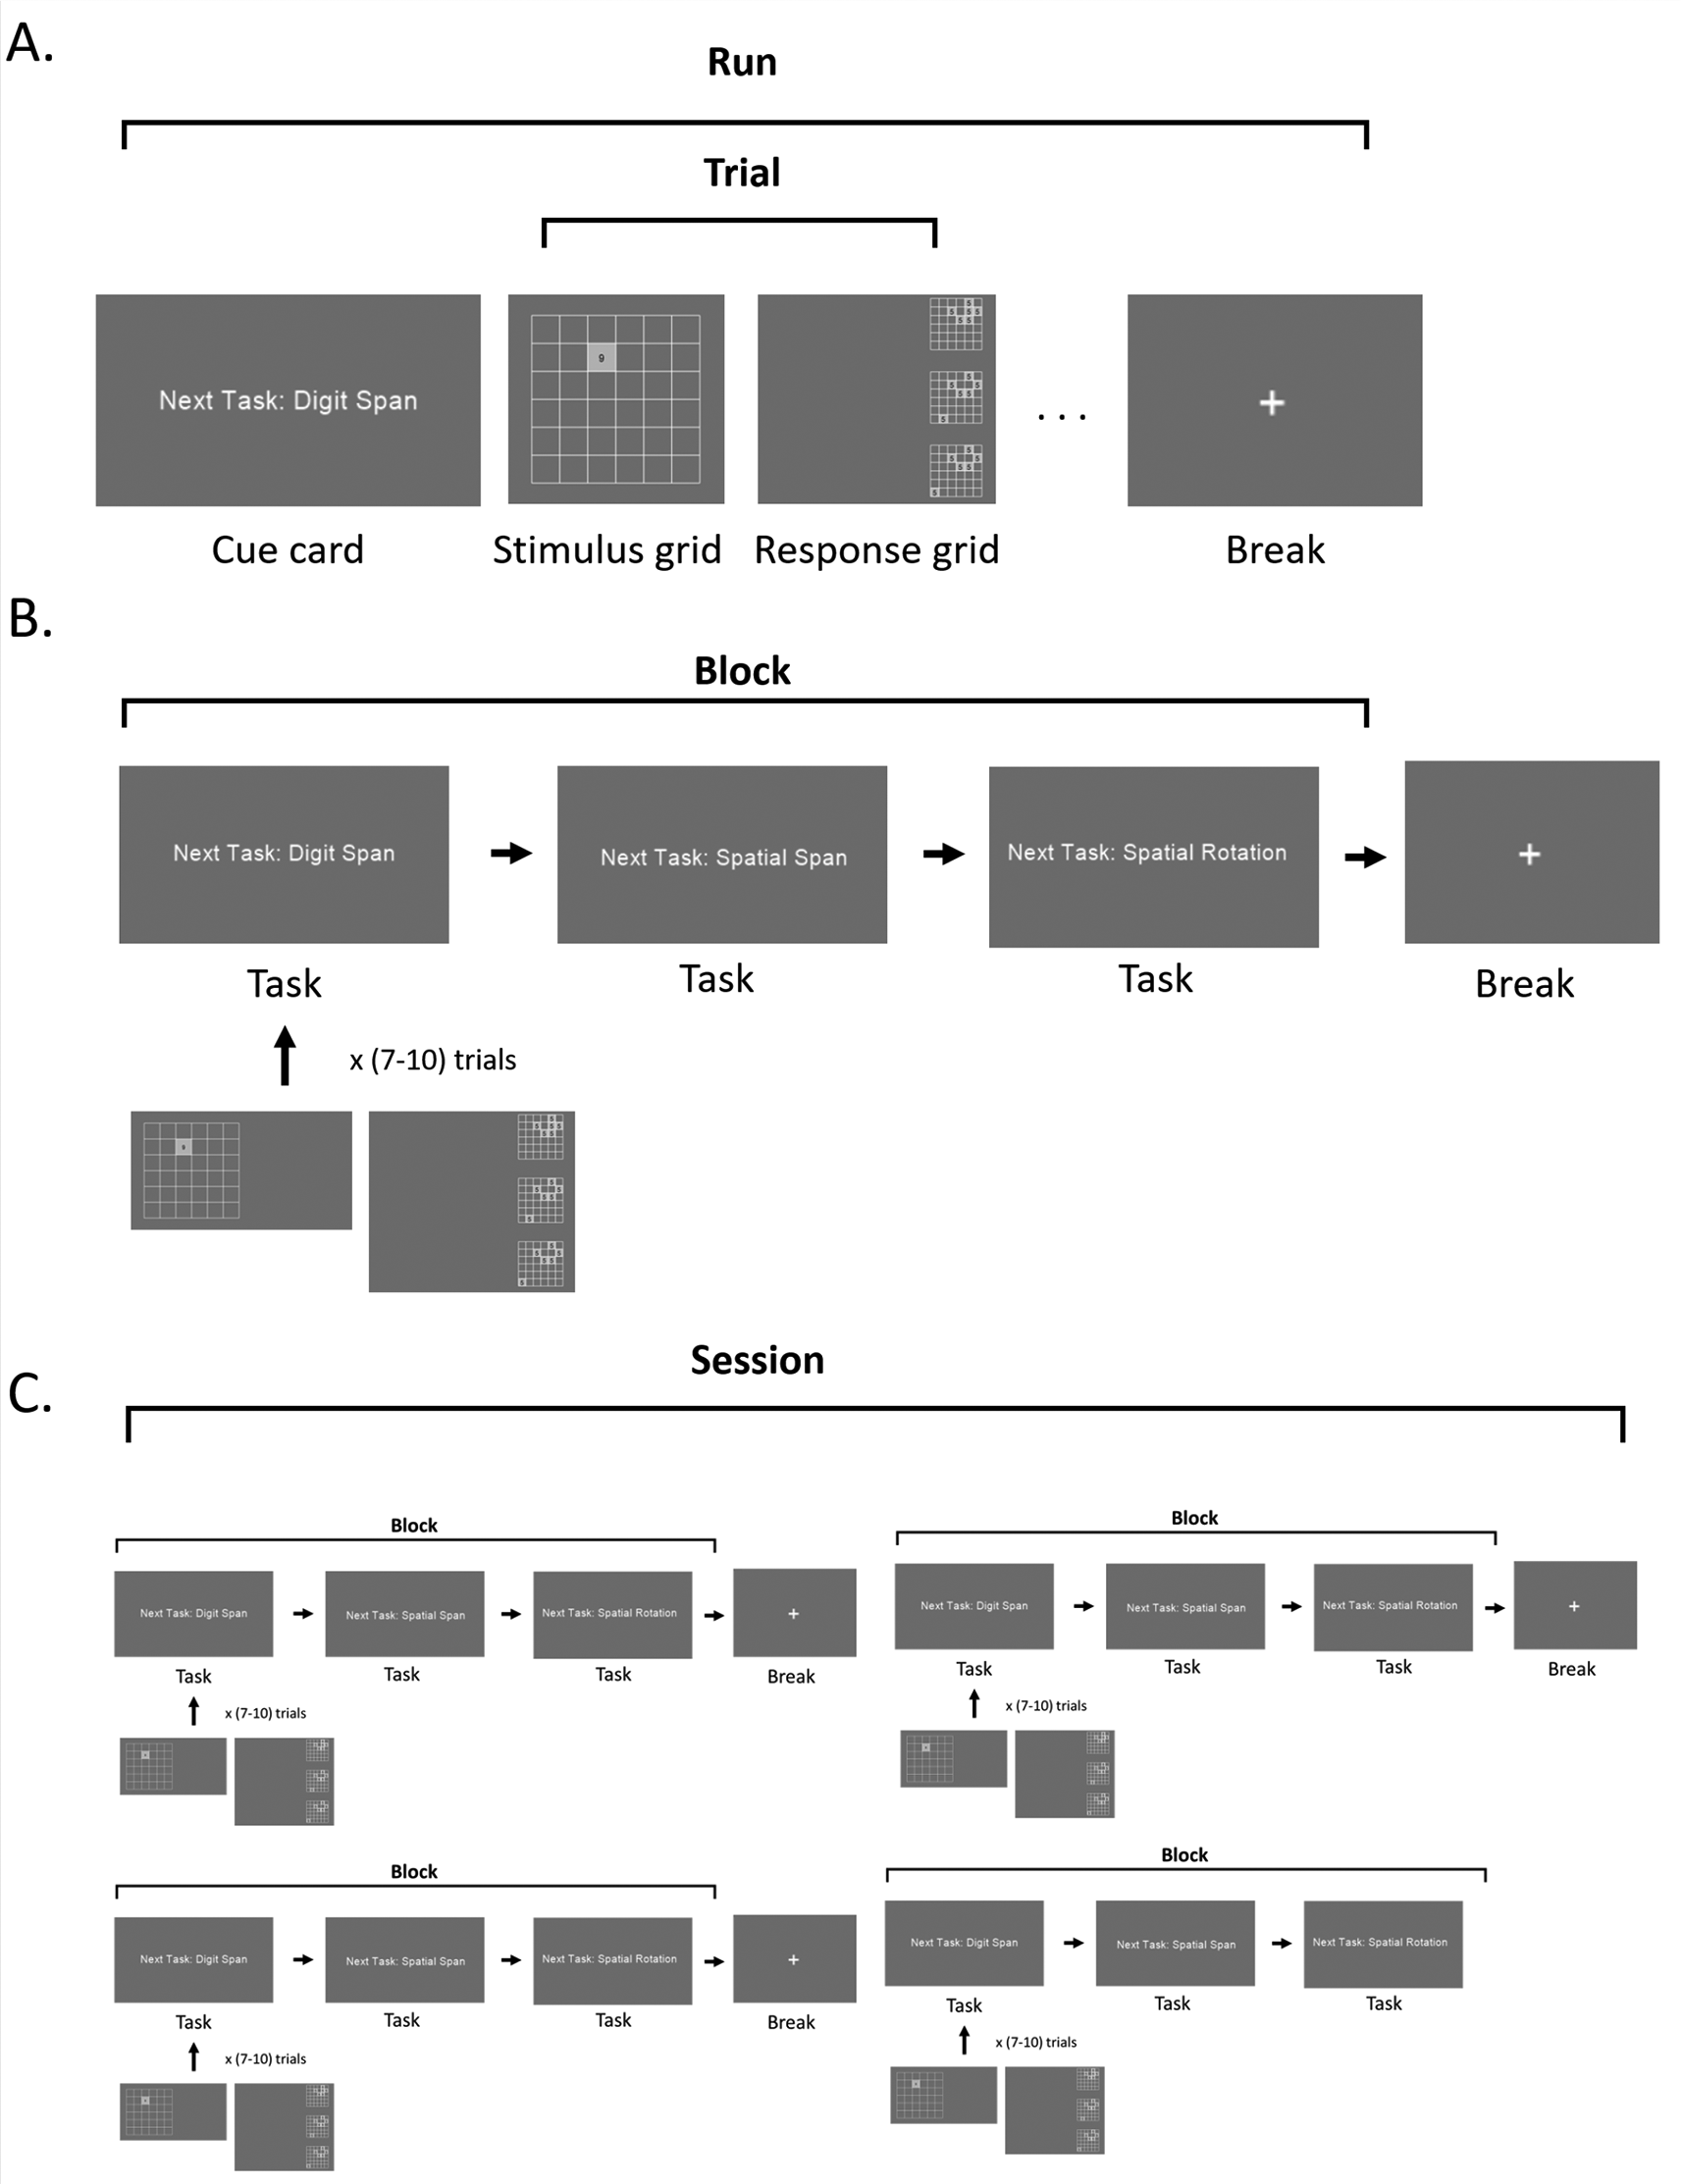
This depiction represents the task described in the manuscript, but all components shown can be changed to suit the needs of other experiments.
Digit Span measures verbal working memory capacity. In this task, a sequence of 6 numbers within a shaded box on the stimulus grid appears one after another. One of the three answer grids will contain the correct sequence of numbers, and the other two will be correct except for one digit. This is a variant of the WAIS-R intelligence test that evaluates working memory.20 Spatial Span tests visuospatial working memory capacity. 6 squares flash digits appearing in a random sequence, one after another, in the stimulus grid. The correct answer grid will display the same sequence of numbers that flashed in the stimulus grid, while the other two display a sequence that is incorrect by one cell. Finally, Spatial Rotation measures the ability of the participant to mentally rotate objects in memory. Similar to the Spatial Span, shaded cells appear one after another, though in this task the previous cells continue to flash with each new addition. The resulting end stimulus is a flashing grid of 6 cells. The answer grids contain a 90, 180, or 270-degree rotation of the final grid, with two of the three answer grids incorrect by one cell. Gifs showing trials of each task can be found here: https://github.com/daniellekurtin/task_switching_paradigm/tree/master/TaskGifs.
We describe the implementation of the task switching paradigm as created for our experimental use, rather than the software package as a whole. We provide the software package as an example of how it may be implemented and used for an experiment.
Running the script initiates an implementation of the task switching paradigm. The paradigm consists of blocks composed of a sequence of tasks. Each task is composed of a run of trials. Trials consist of stimuli and answer grids (Figure 1). Runs are set up so that the last run on one block continues as the first run on another block. For example, if the last run within a block consists of 9 trials of Digit Span, then the break could occur on trial 7, and after the break, the remaining two trials would be the first two trials of the next block. This approach maximizes the number of task switches in each block while keeping the number of runs balanced across each of the three task types. The implementation begins with a popup to record participant and session information (). After the popup is dismissed, a scanner sync process is initiated, creating a Pythonic interface for neuroimaging experiments. Then constructs a demo that participants may play multiple times to ensure their familiarity with how to play the tasks. The demo’s parameters are set by class (and its parent class), with trials determined by . Then, constructs a new task blueprint using the default parameters set by class. If desired, implementations may specify the types of tasks the paradigm will switch between, the length of the cue cards, the number of trials per task, the duration of each stimuli, and more, as demonstrated in the tutorial construction. A pseudorandomized list of trials, runs, and blocks are constructed based on the provided specifications, ensuring there are an equal number of switches for each task type. Each task’s trials are instances of classes unique to each task type: taskSwitching.TrialDigitSpan, taskSwitching.TrialSpatialSpan, and taskSwitching.TrialSpatialRotation. Parameters may be set at the Experiment, Component, Trial, or specific trial task level, with the later parameters overriding earlier ones where there are conflicts. Values that can be set in this way include how stimuli and answers are created and displayed, and for how long.
Trials are instances of Components, and cue cards, instructions, and breaks are also components. taskSwitching. Components include the following: taskSwitching.ComponentRest determines the rest screen; taskSwitching.ComponentStart is the screen before participants begin the task switching game; taskSwitching.ComponentInfoCard creates the cue cards that prompt a task switch; and taskSwitching.ComponentTrialGap fixes the screen that appears between trials.
As aforementioned, trials consist of stimuli and their answer grids, which are constructed according to the class. Finally, as the task is played, information is saved to a.csv file. What is saved and the file format is set by the class.
This task is executable in a Pythonic environment. Touch events (i.e., participant’s responses) can be collected via button box, through keyboard strokes, and by mouse clicks. Responses minimize motor confounds through requiring a single button press or click to select an answer grid for all three tasks. We will now describe the workflow and design features for both the neuroimaging and online versions.
The paradigm begins with a participant GUI that requires entering the participant ID, age, gender, and session ID (fields can be adjusted depending on specific study needs). Participants then play a demo that includes each of the tasks at least once. The demo includes performance feedback: after participants select an answer grid, a green box will highlight either the correct answer grid, or the space it would occupy. This gives participants a better understanding of how well they comprehend the task’s rules. After a loading screen the participant is presented with a cue card stating they may press any button on the button box to begin. Once a button is pressed, the first cue card is presented, followed by the first trial of that task. After the first stimulus is finished, there is a variable delay before participant responses are enabled. Participants then have a window to respond. Once the participant selects their answer grid, the other two disappear, and the first answer grid is held on the screen for the remainder of the response window. This serves two purposes. First, by eliminating the other answer grids, we provide feedback that their answer has been recorded, preventing repetitive button presses. Second, we eliminate the potential for participants to compare their answer to the other answer girds. Once the trial is over, there is a variable intertrial interval (e.g. 100 to 1100 msec) to introduce a jitter. The jitter is used to improve reliability of fMRI signals, and increase the spatio-temporal resolutions.21 For online studies, we recommend researchers include a jitter-induced delay related regressor in models of BOLD activity, and remove jitter during offline studies as recommended by Ref. 22 for response-cue trial intervals. The number of trials per run range is modifiable (5-10 might be a reasonable number for fMRI experiments). Once the task is complete, a cue card stating “Next Task: [Digit Span/Spatial Span/Spatial Rotation]” is displayed to indicate which task is next. There are no task repeats (i.e., if the previous task was the Digit Span, the next would be either the Spatial Span or Spatial Rotation). The duration of the cue card is a random choice of either 0.5 or 4.0 seconds, though the number of cue cards and their length can be varied. This enables future investigation into the effects of short vs long cue presentation on neural network dynamics and task performance. After the trials within the block are complete, a break occurs (though the presence and/or duration of a break can be modified). The break screen contains a centered fixation cross, and a countdown until the task restarts. Once all blocks are complete, the task quits, and data is saved in a.csv file. Participant reaction time is computed as the difference between when they submit an answer and when a response was enabled for that trials. Reaction time is measured in seconds with hundred-millionths period precision.
Our version of the task switching paradigm is hosted on the University of Surrey’s web servers. The university servers serve three main functions: enabling participants to access and play the task, recording their performance, and storing “task blueprints” (Figure 2). These “task blueprints” are pre-compiled sessions (the order of tasks, the number of trials per task, etc), and are the same as the tasks generated locally. Uploading the task blueprints is simple, and reduces the burden on the server. These blueprints are created using , with dependencies and scripts used to communicate among servers located in the folder of the paradigm’s repository. Participants access the task from the link http://www.task-switching-game.surrey.ac.uk. They are walked through a tutorial with written instructions and accompanying animations. Participants then play the same demo described in the above section. After the demo, participants are invited to either play it again, or continue on to the main task. Once they continue, they read an ethics statement and fill out consent checklists and their participant information (participant ID, age, sex). Next, they receive the instruction to “Press next to begin.” At this stage the online version of the task is as the neuroimaging version, except it consists of one, 20-minute long block, and answer selection is done using the mouse (the task is configured to work using a keyboard, mouse, or button box).
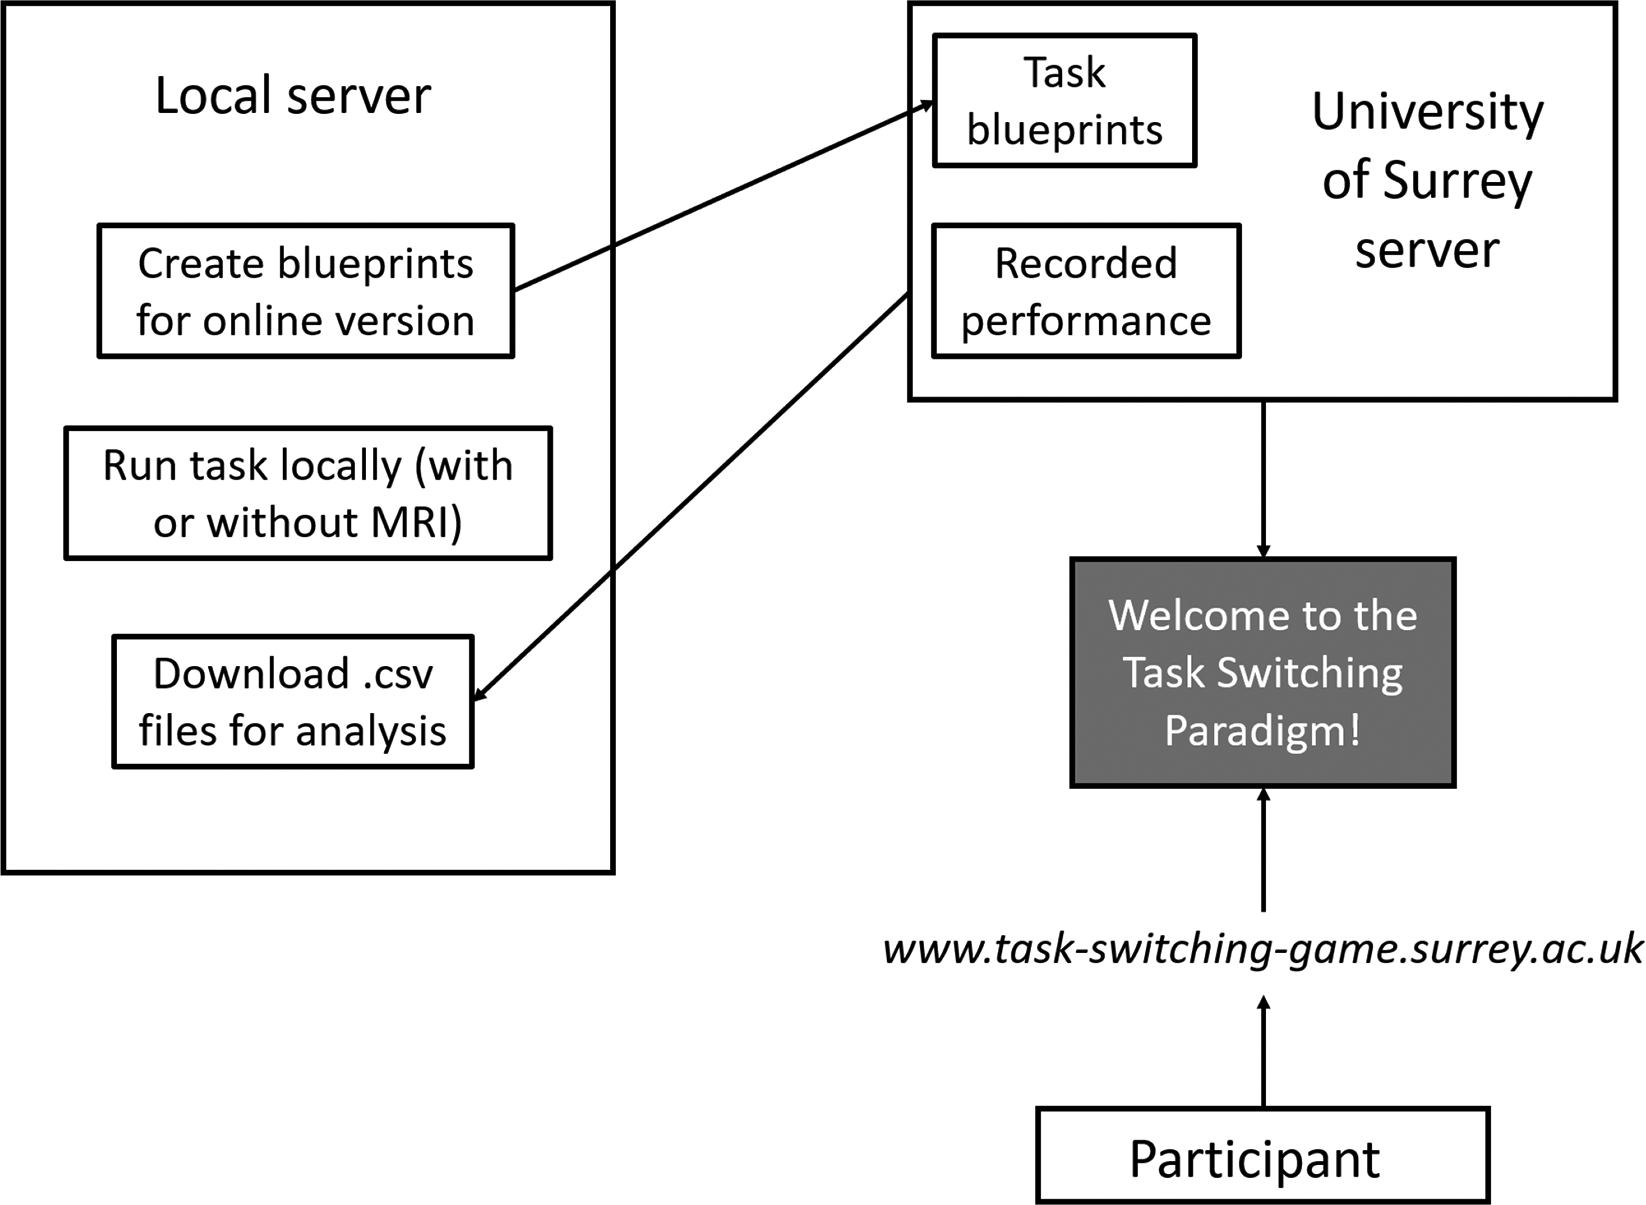
Participants accessed the task using a link that can be opened via web browsers using either a mobile device or computer (though we specified we prefer that participants used a computer).
The study was advertised on SONA, a participant recruitment and experiment management system that connects participants to ongoing studies. Participants could sign up and play the task switching game, and were awarded course credit for completion. All participants gave informed consent. This study was conducted with ethical approval by the University of Surrey Ethics Committee.
Parameters for this use case are as follows:
• Delay from stimulus end to participant response window: 0.15 s
• Participant response window: 3.0 s
• Block break: 120.0 s
• Response mode: mouse
• Inter-trial interval: 100-1100 msec
• Cue card length: 0.5 or 4.0 s
• Number of trials per occurrence: 6-9 trials
• Range of trials: 176-187
Data analysis was conducted using the file output by the online task in a MATLAB environment. Non-normally distributed performance data was normalized by computing the z-score with a center of zero and one standard deviation. Switch task types are defined as the first trial after a switch between tasks, and stay trial types are all other trials. Occurrence refers to the number of times a participant has played a task. For example, if the task starts with a Digit Span, then switches to the Spatial Rotation, then back to the Digit Span, the occurrences would be 1, 1, 2. Linear mixed effects models are used to assess the effect of task type, occurrence, and trial type on behavioural performance, with subjects included as random effects. Post-hocs are evaluated using T-tests.
Data cleaning The total number of online participants was n=87, with a mean age of 19.68, and all participants were university students. We removed any sessions with less than 100 trials (n=7). There were no participants that had 20% omissions in any task. We removed participants that performed below chance level for any task (n=19), leaving us with a final cohort of 61 participants (n=52 females). Each participant had an average of 178.9 trials (sd=12.37) overall.
Overall performance-reaction time and accuracy Performance was evaluated using accuracy and mean reaction time (MRT) (Table 1). Kolgov-Smirnov tests show both accuracy (D(1509)=0.55, p0.0001) and MRT (D(10909)=1, p0.0001) are non-normally distributed, and were thus normalized.
| Overall mean ± sd | Digit Span mean ± sd | Spatial Span mean ± sd | Spatial Rotation mean ± sd | |
|---|---|---|---|---|
| MRT (ms) | 1826.5 ± 501 | 1837.7 ± 505 | 1826.2 ± 489 | 1813.1 ± 511 |
| Accuracy | 60.57% ± 22 | 66.31% ± 23 | 53.68% ± 21 | 61.51% ± 21 |
There was a significant effect of task type on accuracy (F[2,1503]=10.8, p=2.1e-05). Post-hoc T-tests show each task’s accuracy is significantly different than the others, with Digit Span performing 12.6% and 4.8% better than Spatial Span (t(502)=-9.6, p=3.1e-20) and Spatial Rotation (t(502)=-3.6, p=3.7e-04) respectively, (Figure 3A). Spatial Rotation performance was 7.8% higher than Spatial Span performance (t(502)=-6.1, p=5.5e-11). There was no significant effect of occurrence on accuracy (F[1,1503]=2.6, p=0.10) (Figure 3B).
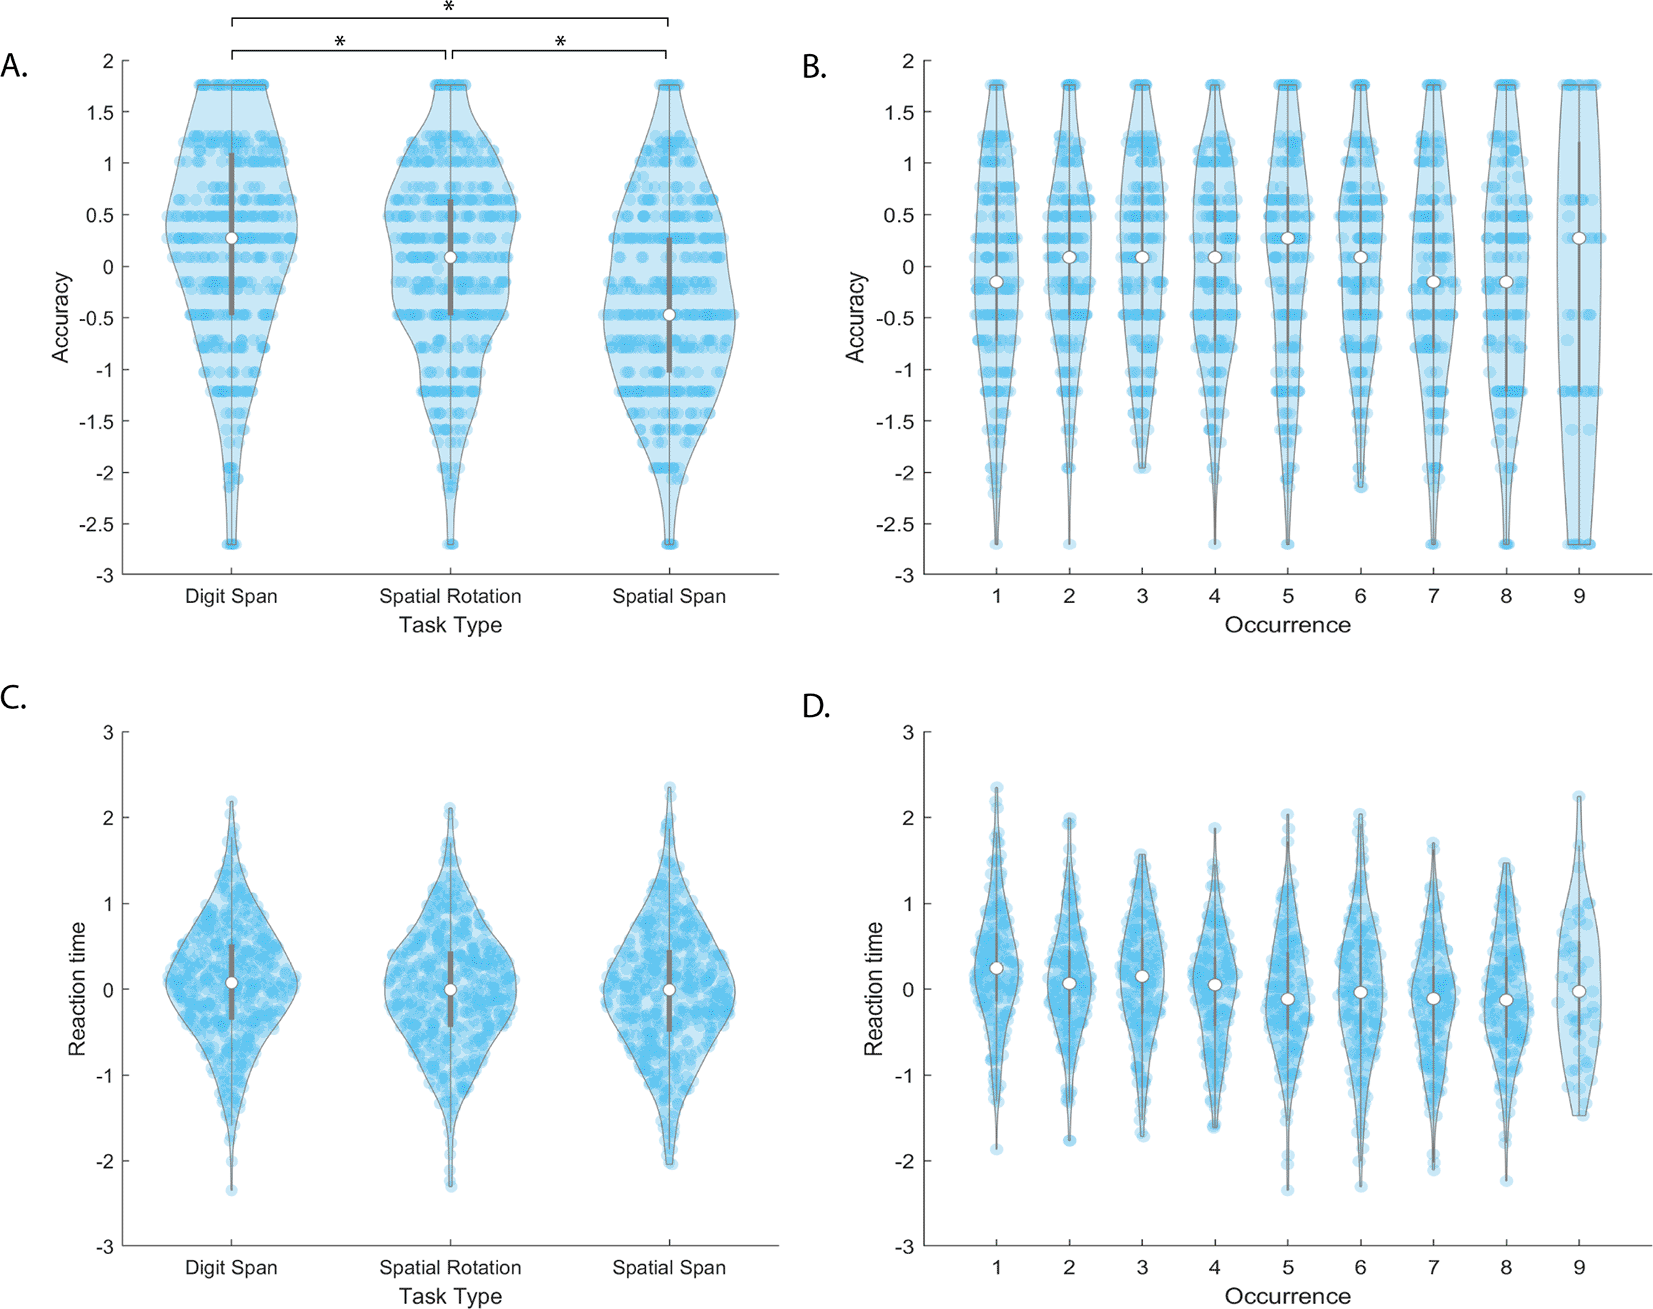
The top and bottom edges of the grey boxes represent the 25th and 75th percentiles, with the mean being the white dot. Extension of the whiskers limits outliers. A kernel density estimate of the data provides the edges to the violin plot, and individual data points are dark blue. denotes significance at after Bonferroni correction for multiple comparisons.
There was a significant effect of occurrence on MRT (F[1,1481]=8.4, p=0.004) (Figure 3D). A Bland-Altman plot was created to investigate whether the effect of occurrence was a result of unreliable RT recording or learning effects. There are no remarkable effects on the data, as shown in the (Figure 4A). There was no significant effect of task type on MRT (F[2,1481]=0.1, p=0.92) (Figure 3C).
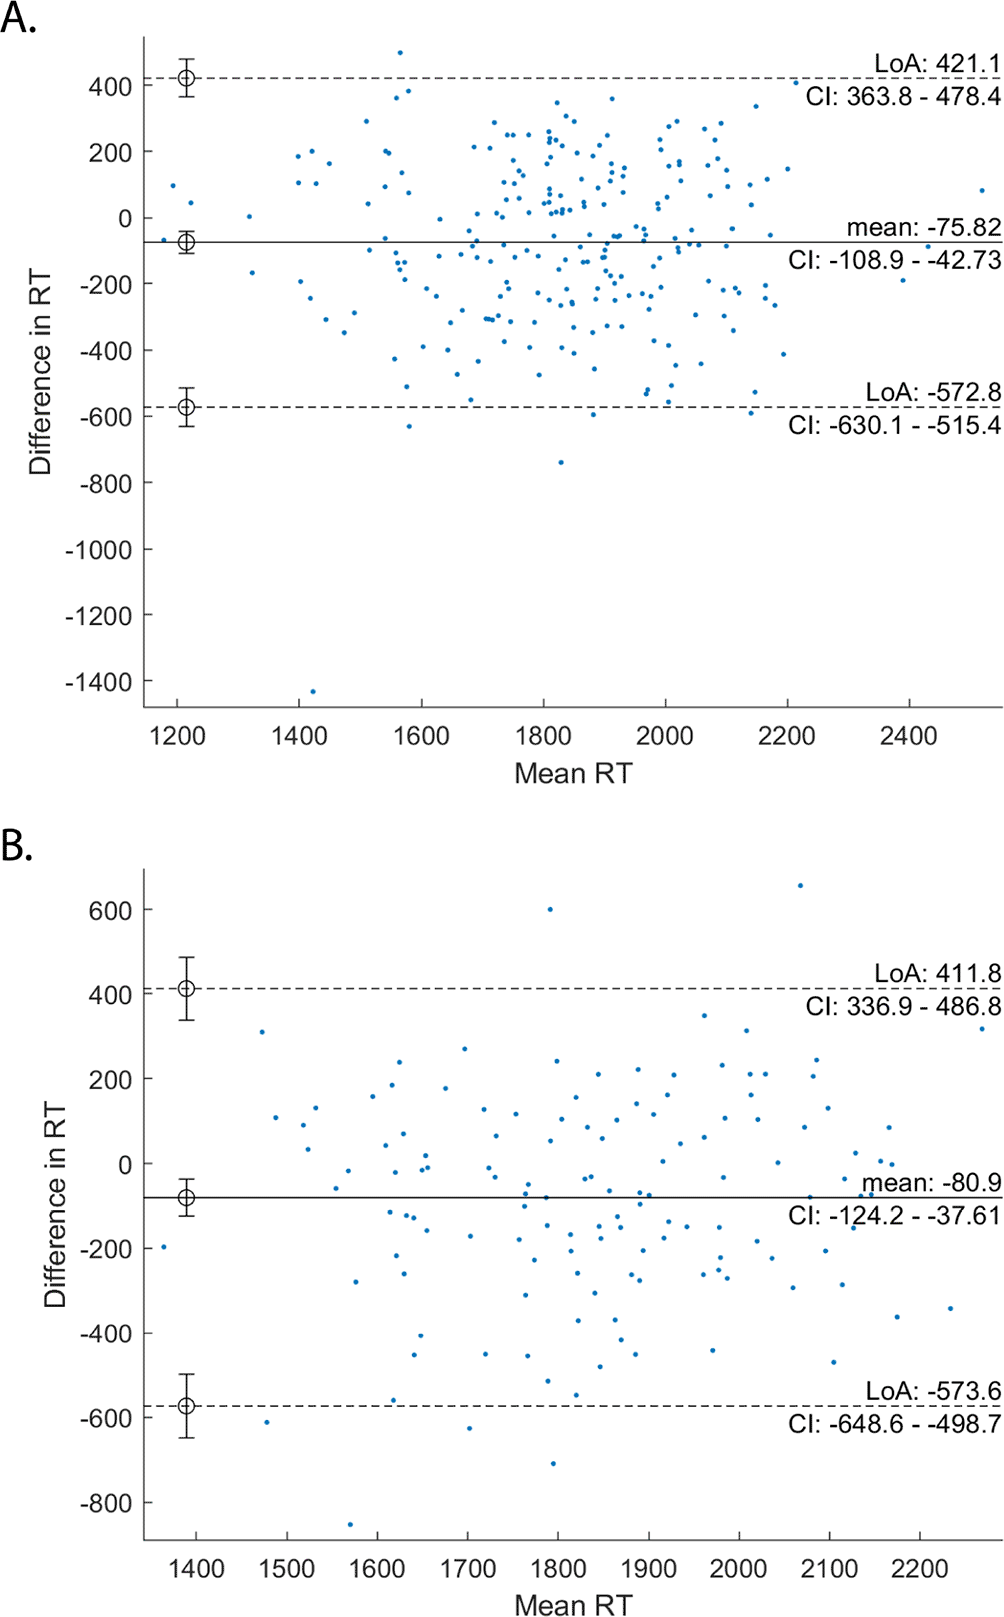
Plots show the mean (solid line), 95% confidence limits (dashed lines), and the data points (blue points).
Switch Cost There is a significant overall switch cost in accuracy (t(1447)=3.0, p=0.003) (Figure 5A) but not MRT (t(811)=0.85, p=0.39) (Figure 5B). Because there is an effect of task type on accuracy, we looked at whether there was an effect of switch on each task’s performance. After Bonferroni correction for multiple comparisons, there is a significant switch cost in Spatial Span (F[1,120]=7.4, p=0.008) and Spatial Rotation (F[1,120]=7.4, p=0.007) accuracy, but not Digit Span (F[1,120]=0.25, p=0.62) Figure 5C-E).
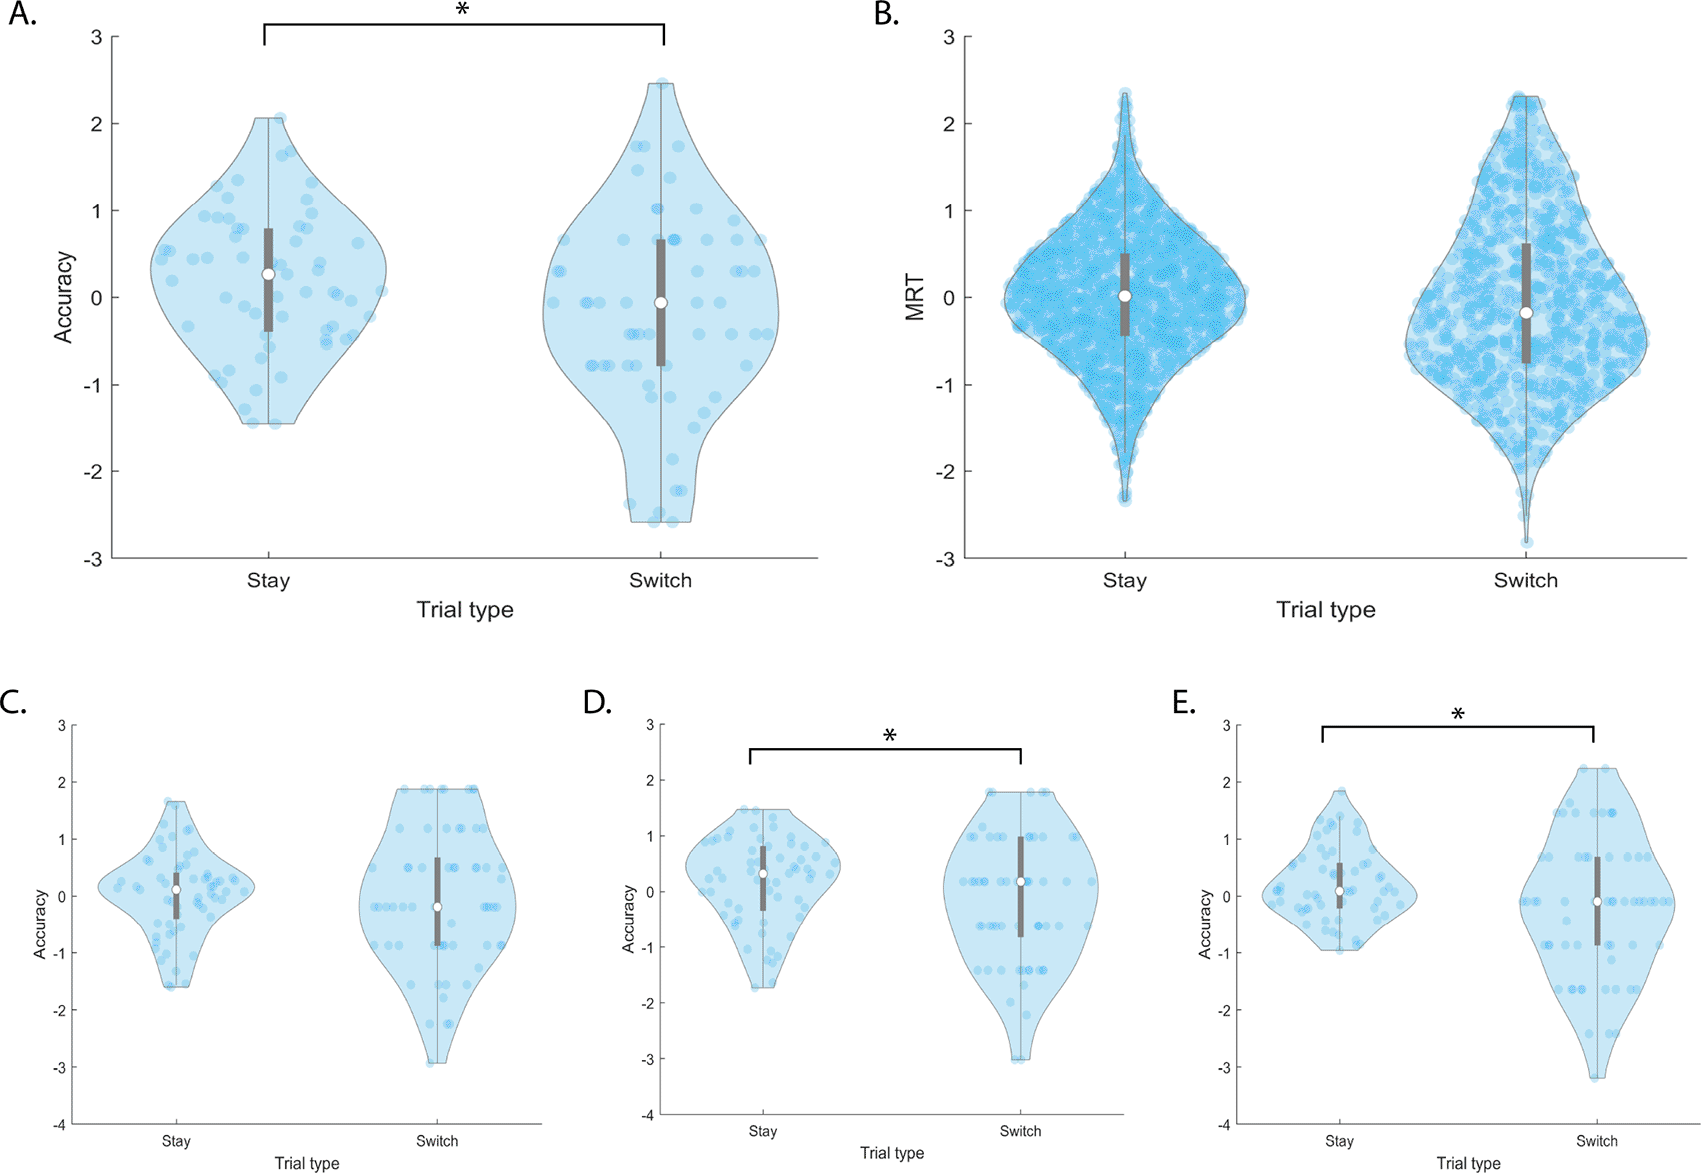
The top and bottom edges of the grey boxes represent the 25th and 75th percentiles, with the mean being the white dot. Extension of the whiskers limits outliers. A kernel density estimate of the data provides the edges to the violin plot, and individual data points are dark blue. denotes significance at after Bonferroni correction for multiple comparisons.
We also sought to determine whether switch cost was influenced by switch type- the six possible combinations of how one task may switch to another. For example, a switch from Digit Span to Spatial Span is one switch type, and vice versa, another. We found a significant effect of switch type (F[1,425]=6.8, p=0.009) on accuracy but not MRT (F[1,405]=1.3, p=0.26). Post-hoc ttests found no significant differences in accuracy per switch type after Bonferroni corrections for multiple comparisons.
In this first online pilot of the task switching paradigm we found task type influenced accuracy. The better performance in the Digit Span compared to the Spatial Span is not surprising. A study of 44,600 participants playing a range of cognitive tasks online found that, when playing the Digit Span, the average number of stimuli remembered by participants is 7, whereas the average number of stimuli remembered for the Spatial Span is 6.20 This means that, using our 6x6 grid, the number of stimuli to retain for the Digit Span is well within the abilities of our population. The discrepancy in performance between the Digit Span and Spatial Rotation is less clear. However, in a previous study comparing performance between working memory tasks that greatly resemble the Digit Span and Spatial Rotation, performance on the Digit Span analog was significantly better than their analog visuospatial task.23 Finally, the difference in performance between the Spatial Span and the Spatial Rotation may be a result of participant’s ability to form effective strategies for each task. A study by Gardony et al investigated mental rotation tasks and found that, as difficulty increased, cognitive strategies shifted in order to meet the demands of the task.24 Participants playing the Spatial Span can more easily rely on recognition strategies than in the Spatial Rotation, where participants not only need to recall patterns, but perform a mental rotation of the patterns as well. The additional demands of the Spatial Rotation task may have resulted in the discrepancy between Spatial Span and Spatial Rotation performance.
We found an influence of occurrence on MRT. The greatest difference in MRT per occurrence is between occurrence 1 and 7. MRT in occurrence 7 is 6% faster than during occurrence 1; a marginal improvement over the duration of the experiment.
The switch cost in accuracy, but not reaction time, demonstrates a partial success of our aim to create a task switching paradigm that forces a behavioral switch cost. The presence of switch costs in accuracy, but not reaction time, may be a function of the response window imposed on participants. A study by Hughes et al found that switch accuracy fell 29% by introducing a response time window,25 but this switch cost did not extend to reaction time. Our response window of three seconds is likely enough to induce a time pressure on participants, as well as the added switch cost in accuracy, but not reaction time. The explicit cues informing participants a switch is about to occur may have reduced the behavioral switch cost. A study by Merian also using a random, cued, task switching paradigm reported a smaller switch cost than the switch cost observed in a study by Monsell without random task switches.1,26 Tornay and Milan compared the two studies and hypothesized that the cue for a change in task gives participants time to suppress the current task set. This initiates the cognitive restructuring process of task switching, thus increasing participants’ ability to quickly reconfigure to the demands of the new task.4 Our cue card intervals of 0.5 and 4.0 seconds were likely long enough to allow participants to suppress the currently active task set when the cue card is shown. This preparatory process may decrease the switch cost, but not the cognitive restructuring process of switching. We did not collect neuroimaging data for this study, but we plan to in the future, and will investigate this arm of research.
Due to an error in the data collection process, we were unable to assess how the variation in cue card presentation length effected participant’s performance. Because of the potentially significant influence this variability may have had on participant’s performance, we standardized the cue card length from 4.0 seconds to 0.5 seconds, and conducted a second round of data collection. The results from this second use case are detailed below.
As a result of our inability to calculate the impact of cue card length on MRT and accuracy, we standardized the cue card length to be 0.5 seconds. Our data collection and analysis were conducted using the same methods as above.
Data cleaning The total number of online participants was n=40, and all participants were university students. We removed any sessions with less than 100 trials (n=4). We also removed participants that had 20% omissions in any task (n=0), participants that performed below chance level for any task (n=3), leaving us with a final n=33 (n=31 females) Each participant had an average of 182 trials (sd = 3.35) overall.
Overall performance-reaction time and accuracy Accuracy and MRT were used to evaluate performance (Table 2). Kolgov-Smirnov tests show both accuracy (D(825)=0.55, p=4.4e-215) and MRT (D(825)=1, p0.0001) are non-normally distributed.
| Overall mean ± sd | Digit Span mean ± sd | Spatial Span mean ± sd | Spatial Rotation mean ± sd | |
|---|---|---|---|---|
| MRT (ms) | 1844.0 ± 496 | 1872.5 ± 481 | 1821.6 ± 519 | 1831.5 492 |
| Accuracy | 60.34% ± 23 | 68.02% ± 22 | 53.16% ± 21 | 62.50% ± 21 |
There was a significant effect of task type (F[1,819]=3.1, p=0.047) (Figure 5A), but not occurrence (F[1,819]=0.01, p=0.94) (Figure 6B), on accuracy. Post-hoc T-tests show each task’s accuracy is significantly different than one another, with Digit Span performing 14.9% and 5.5% better than Spatial Span (t(274)=-5.6, p=4.9e-08) and Spatial Rotation (t(274)=-3.4, p=7.8e-04), respectively. Spatial Rotation performance was 9.34% higher than Spatial Span performance (t(274)=-9.1, p=2.3e-17).
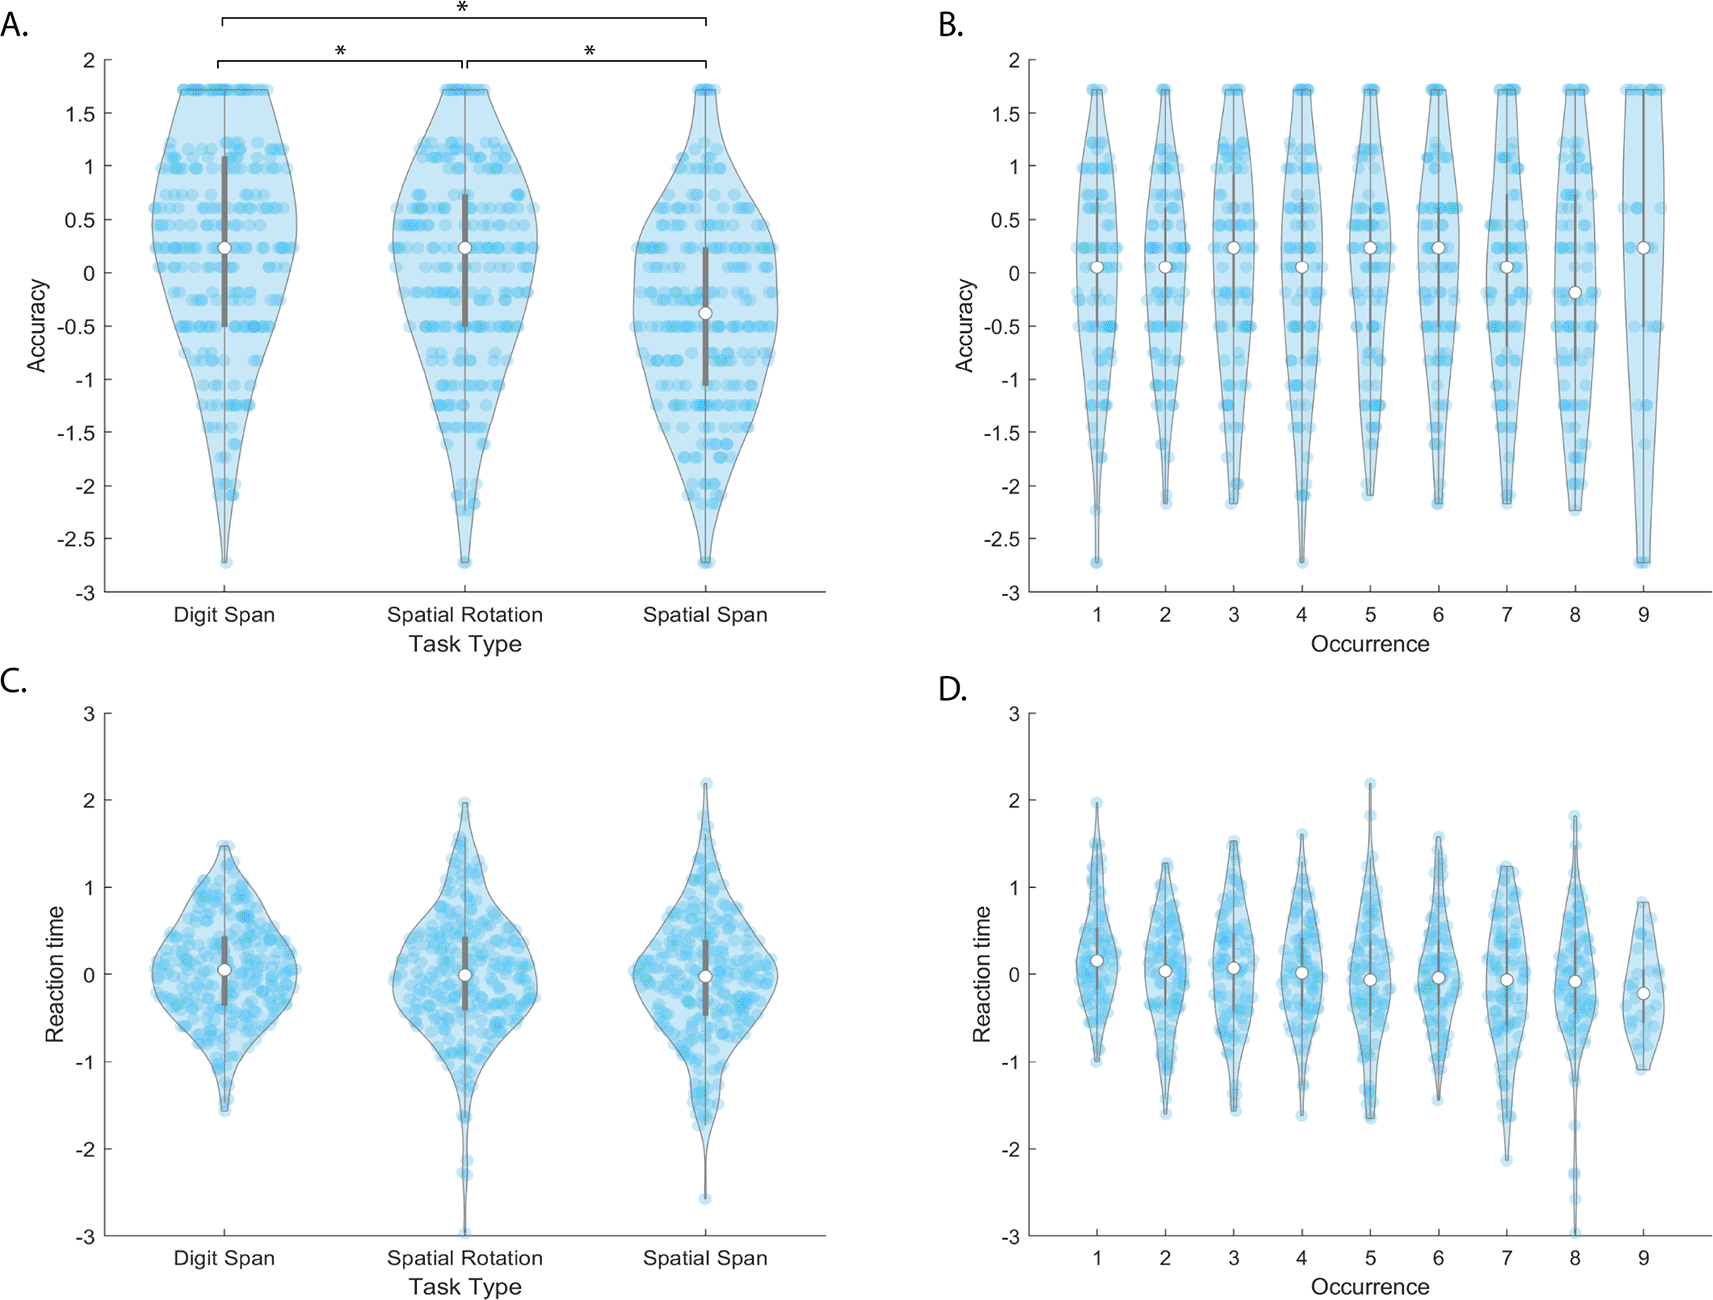
The top and bottom edges of the grey boxes represent the 25th and 75th percentiles, with the mean being the white dot. Extension of the whiskers limits outliers. A kernel density estimate of the data provides the edges to the violin plot, and individual data points are dark blue. denotes significance at after Bonferroni correction for multiple comparisons.
There was a significant effect of occurrence on MRT (F[1,813]=12.0, p=0.0006) (Figure 6D). A Bland-Altman plot was created to investigate whether the effect of occurrence was a result of unreliable RT recording or learning effects. There are no remarkable effects on the data, as shown in the (Figure 4B). There was no significant effect of task type on MRT (F[2,813]=0.39, p=0.67) (Figure 6C).
Switch cost There is no significant switch cost in accuracy (t(791)=-0.69, p=0.49) (Figure 7A) or MRT (t(469)=-0.34, p=0.73) (Figure 7B). There was no significant effect of switch type on accuracy (F[1,229]=0.01, p=0.92).
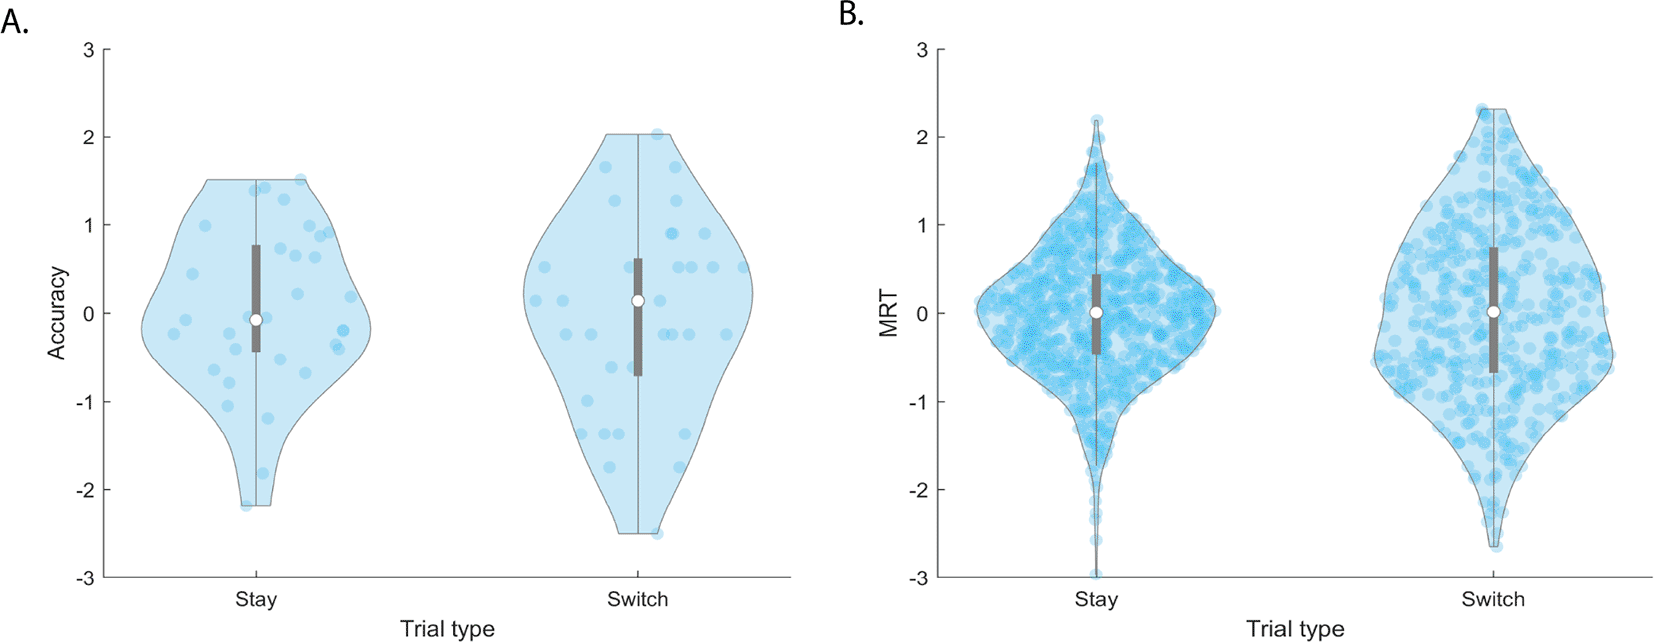
Extension of the whiskers limits outliers. A kernel density estimate of the data provides the edges to the violin plot, and individual data points are dark blue.
This online pilot sought to evaluate performance on the task switching paradigm and see how the standardization of cue cards influenced performance.
There was high similarity between the first and second pilot, with both pilots showing an effect of occurrence on MRT and task type on accuracy. However, the switch cost in the Spatial Span and Spatial Rotation observed in the first pilot was not present in the second. The loss of switch cost is surprising, especially given that the cue card length was standardized to 0.5 seconds as opposed to 4.0 second, suggesting that switch costs may by driven by a longer cue card.
This is supported by a task switching study by Periánez and Barcelo27 that studied the role of exogenous (cues) and endogenous (task-set activation) in the behavior and EEG markers of switch costs. Their experimental paradigm randomly varied the cue-trial interval (CTI) between participants as either 800 or 2000 ms. They found that the shorter CTI did not consistently lead to a greater switch cost, and in fact, influenced a cue-switch benefit. The results from our study are similar- Use Case 1, which had CTIs of either 500 ms or 4000 ms, exhibited a greater switch cost than in Use Case 2, which solely had CTIs of 500 ms. Their EEG results suggest this phenomena may be a result of reduced P3 activity that arises from an interplay between time-dependent endogenous (anticipatory task set reconfiguration) and exogenous (cue) factors. We suggest future studies utilize the neuroimaging compatibility of our task switching paradigm to replicate this finding.
This task contains two visual confounds. First, in the Spatial Span and Digit Span the boxes disappear after the initial presentation; in the Spatial Rotation, they build upon one another. The resulting end image is a visually more complex image. This confound is unavoidable due to the nature of the Spatial Rotation task. Second, the stimuli in the Digit Span present in half the time as the stimuli for the Spatial Span and Spatial Rotation, 0.25 seconds as opposed to 0.50 seconds, respectively. This difference was implemented after rounds of piloting the task, where it was noticed the Digit Span was markedly easier than the other two tasks. By reducing the stimulus presentation time we increase the difficulty of the Digit Span, making it more comparable to the other two tasks. This is important, as cognitive load influences the brain network activity and connectivity within a task.28 Though the piloting of this task was performed with healthy control participants, future researchers may want to assess differences between healthy control and patient populations. Mixing costs may be more sensitive to between-group variability,29 and one limitation of our task structure is that it does not permit the exploration of mixing costs. Moreover, the current design did not allow repeats blocks of the same task (for example, this order would not occur: Digit Span, Spatial Span, Spatial Span, Spatial Rotation), and therefore cannot investigate the difference in switch vs restart costs.19 Future researchers are invited to adapt the paradigm’s design to allow repeat task blocks, to investigate switch vs restart costs, and explore whether introducing mixed-task blocks induces switch costs not seen in this version of the paradigm.
Finally, our task differs from most variants of task switching paradigms, and this should be taken into consideration when comparing results from this task to literature using different paradigms.
Future researchers are encouraged to modify these parameters as it suits their task. The task switching paradigm was built with flexibility in mind, so it may be easily adapted to various experimental designs.
Searching for “task switching paradigms” reveals a staggering amount of task designs, theories, and neuroimaging data. The quantity and heterogeneity of experimental designs address specific facets of switch costs, and by proxy, cognitive function. The authors are not aware of an existing framework that can be adapted easily to suit the demands of different experiments, leaving researchers to either re-use old tasks or create entirely new ones to suit their experimental designs. We needed to construct a novel task switching paradigm, and chose to create one within a framework that can be adapted to suit the needs of different experiments. Here we introduce a flexible software package to create task switching paradigms. It can accommodate nuanced designs within a stable and robust framework for on or offline studies, and is compatible with neuroimaging methods. The task switching paradigm does induce minimal switch costs, but efforts are underway to improve the switch cost.
Repository: Task Switching Paradigm. https://github.com/daniellekurtin/task_switching_paradigm with an MIT license.
This project contains the following underlying data:
• rawdata_pilot4.csv. (Data downloaded from the task server for Use Case 1.)
• rawdata_pilot5.csv. (Data downloaded from the task server for Use Case 2.)
Data are available under the terms of the repository’s MIT license.
Source code available from: https://github.com/daniellekurtin/task_switching_paradigm with an MIT license.
We would like to thank Henry Hebron for his guidance in creating the figures in this manuscript.
| Views | Downloads | |
|---|---|---|
| F1000Research | - | - |
|
PubMed Central
Data from PMC are received and updated monthly.
|
- | - |
Is the rationale for developing the new software tool clearly explained?
No
Is the description of the software tool technically sound?
Yes
Are sufficient details of the code, methods and analysis (if applicable) provided to allow replication of the software development and its use by others?
Yes
Is sufficient information provided to allow interpretation of the expected output datasets and any results generated using the tool?
No
Are the conclusions about the tool and its performance adequately supported by the findings presented in the article?
No
Competing Interests: No competing interests were disclosed.
Reviewer Expertise: Cognitive neuroscience (EEG, fMRI, TMS) in cognitive control, visual selective attention and learning.
Is the rationale for developing the new software tool clearly explained?
Yes
Is the description of the software tool technically sound?
Yes
Are sufficient details of the code, methods and analysis (if applicable) provided to allow replication of the software development and its use by others?
Yes
Is sufficient information provided to allow interpretation of the expected output datasets and any results generated using the tool?
Yes
Are the conclusions about the tool and its performance adequately supported by the findings presented in the article?
Partly
Competing Interests: No competing interests were disclosed.
Reviewer Expertise: Cognitive flexibility; this paper is fully within my area of expertise.
Is the rationale for developing the new software tool clearly explained?
Yes
Is the description of the software tool technically sound?
Yes
Are sufficient details of the code, methods and analysis (if applicable) provided to allow replication of the software development and its use by others?
Partly
Is sufficient information provided to allow interpretation of the expected output datasets and any results generated using the tool?
No
Are the conclusions about the tool and its performance adequately supported by the findings presented in the article?
No
References
1. Grange J, Houghton G: Task Switching and Cognitive Control. Oxford University Press. 2014.Competing Interests: No competing interests were disclosed.
Reviewer Expertise: Cognitive control processes, task-switching paradigm, cognitive ageing, behavioural and EEG measures. I do not have sufficient expertise to evaluate the software code.
Alongside their report, reviewers assign a status to the article:
| Invited Reviewers | |||
|---|---|---|---|
| 1 | 2 | 3 | |
|
Version 2 (revision) 27 Jul 22 |
read | read | |
|
Version 1 31 Mar 22 |
read | ||
Provide sufficient details of any financial or non-financial competing interests to enable users to assess whether your comments might lead a reasonable person to question your impartiality. Consider the following examples, but note that this is not an exhaustive list:
Sign up for content alerts and receive a weekly or monthly email with all newly published articles
Already registered? Sign in
The email address should be the one you originally registered with F1000.
You registered with F1000 via Google, so we cannot reset your password.
To sign in, please click here.
If you still need help with your Google account password, please click here.
You registered with F1000 via Facebook, so we cannot reset your password.
To sign in, please click here.
If you still need help with your Facebook account password, please click here.
If your email address is registered with us, we will email you instructions to reset your password.
If you think you should have received this email but it has not arrived, please check your spam filters and/or contact for further assistance.
Comments on this article Comments (0)