Keywords
OCD, COVID-19, behavioural immune system
This article is included in the Sociology of Health gateway.
This article is included in the Emerging Diseases and Outbreaks gateway.
This article is included in the Japan Institutional Gateway gateway.
OCD, COVID-19, behavioural immune system
From an evolutionary perspective, diversity is a key for the survival of species,1 as various crises toggle criteria for more adaptive qualities. In humans, diversity of neuro-origin psychological traits - neurodiversity - has been claimed as one of the essential adaptive qualities at the population level.2–4 The concept of neurodiversity in evolutionary psychology initially highlighted individuals with autism, arguing for their cultural and ethical values in inclusive societies, but it currently features various psychological disorders such as obsessive-compulsive (OC) disorders (OCDs).
Regardless of its philosophical or ideological values, the scientific and objective evidence on neurodiversity remains scarce. In particular, it remains unclear whether neurodiversity enhances the biological survival of a human species as a whole, which is very difficult to study empirically. Here, we propose that we can test several hypotheses regarding neurodiversity by utilizing the rare opportunities associated with the outbreak of the SARS-CoV-2/coronavirus disease 2019 (COVID-19). In short, this research addresses questions in evolutionary psychology regarding neurodiversity in the context of the COVID-19 pandemic through online-based questionnaires. We will test if psychological diversities may provide the population robustness against pandemics through their behaviors that can be distinct from those of the majority in the society.
Diversity in behavioral choices across humans due to psychological traits may be a critical factor in shaping the trajectory of a pandemic because individuals' behaviors serve as a key preventive force against a pandemic.5 For example, individuals with OCDs show obsessive thoughts and compulsive behaviors that are highly repetitive and persistent, including compulsive washing and checking.6 These behaviors are also found among non-diagnosed healthy individuals in various degrees.7 Early reports implied that OC symptoms become more severe during the unfolding of the pandemic,8–10 which is consistent with the idea that pathogen threats reinforce OC symptoms in healthy individuals. While these behaviors can be seen as maladaptive in normal situations,11–16 they may be advantageous during pandemics in reducing possibilities to get infected by viruses and to spread the disease upon infection.
Indeed, those individuals with extreme psychological traits display exaggerated behaviors, such as hand washing, which coincide with what is theorized as a behavioral immunizing system (BIS).17,18 The BIS is a collage of behavioral mechanisms that supplement our biological immune functions to mainly prevent pathogen infection: It facilitates detection, psychological responses, and avoidance behaviors around pathogen cues.18 Functional contributions of BIS have been highlighted in various infectious diseases.19 Recently, the theoretical framework of BIS has been applied to COVID-19.20–22 Handwashing and other sanitary behaviors are executed at different rates across individuals, whose variance is to some extent explained by genetic variation in personality traits. For example, those behaviors seem to be enhanced in individuals who are less extraverted and/or more conscientious,23 which are psychological qualities partly shared in OCDs.24–26
Thus, our first hypothesis is that individuals with higher traits of OC may be less likely to be infected with COVID-19 since they are protected by their predispositions for immunizing behaviors.
However, in the face of SARS-CoV-2, the BIS may have limited preventive utility as it has evolved to protect humans against infectious diseases in less dense societies of pre-modern eras.21,27 When the BIS fails in prevention at an individual level, individuals can still perform collective immunizing behaviors to avoid passing their viruses to others. That is, upon infection, they can facilitate their self-diagnosis of infected state,28 which is a precursor for taking medical tests and isolating themselves from societies to reduce further spreading of viruses. While the roles of individual behaviors that prevent infection have been discussed extensively in the literature,18 these in collective prevention have attracted much less attention.
Accordingly, our second hypothesis, not mutually exclusive with the first hypothesis, is that psychological traits of OC may contribute to impeding the pandemic through their facilitated self-diagnosis of the COVID-19 infection. Specifically, considering the core characteristics of OCDs such as obsessive concerns with contamination and harming,6 we speculate that individuals with heightened OC traits may particularly contribute here.
Importantly, self-diagnosis of infection is not a mere degraded alternative for medical testing. Rather, it may have an equivalent, or even larger, impact on a pandemic as the medical testing at least for two reasons. First, from an evolutionary point of view, before the invention of modern medicine, it is the subjective belief of infection without any objective confirmation that drove subsequent preventive behaviors such as self-isolation. Thus, some psychological traits may be evolutionarily preserved to facilitate such subjective beliefs. Lack of access to modern medicine is not entirely a thing of the past. Indeed, even with the current COVID-19 pandemic, the vast majority of individuals still lack access to medical testing including in the United States29 due to underequipped residence areas, poor health insurance coverage, and lower socioeconomic status. While the vaccinations for COVID-19 are becoming more available, the fact that their effects are speculated to last only months to years leaves room for each individual in societies to continue to play some preventive roles.30 Thus, enhanced self-awareness of infection is expected to have served as, and will continue to be, a collective preventive factor against the pandemic. Second, even when individuals do have access to medical testing, self-diagnosis often motivates them to get tested. That is, self-awareness of infection is usually a precursor for medical confirmation.28 Infection-awareness is particularly important with the COVID-19 whose symptoms are inhomogeneous, unexperienced by many, and partly overlap with symptoms of other virus infections.31 Also, the symptoms of COVID-19 can be mild in the majority of infections.32 While self-diagnosis is not always accurate and may include some false positives,33 enhanced infection-awareness including false positives could nevertheless serve preventive roles.
In summary, we hypothesize that individuals with higher traits of OC may be (i) less likely to get infected given their behavioral predispositions against infections, while (ii) they are likely to have enhanced self-awareness of being infected (Table 1).
As we have already conducted a pilot study and thus have all methodological platforms ready, we can immediately initiate data collection upon acceptance of our Stage 1 submission, except to take two months to complete data collection and another two months to analyze the data and write a manuscript for Stage 2 publication (i.e., a total of four months).
To empirically test our hypotheses, we plan to assess OC traits among general participants. The worldwide prevalence of OC has been estimated at around 1.6%.34 Due to the heterogeneity of OC phenotypes, it has been also described as a spectrum disorder.7 We will measure OC traits via a well-established inventory, the Obsessive-Compulsive Inventory (revised) (OCI-r).35 The OCI-r is made up of 18 items evaluated on a five-point Likert scale and it is not considered as a diagnostic measure. The OCI-r score range is between 0 and 72 and it includes six sub-scales: washing, hoarding, obsessing, ordering, checking, neutralizing.
We will also use our original questionnaire to examine COVID-19 diagnostic history (details in Figure 1). The questionnaire that will be used can be found as Extended data.50 Our questionnaire asks participants about their experiences with viral or antibody testing for COVID-19, subjective assessment of illness likelihood, infection dates, symptoms, as well as attitudes towards vaccination for COVID-19. We will implement screening and selective inclusion based on responses to COVID-19 medical-testing-related questions in case we notice that any of the COVID-19 diagnosis groups are over or under-represented in our samples. This will be achieved by adapting the survey script so that it interrupts the completion if certain options (e. g. taking viral or antibody test) are chosen for the first three questions. This will be made explicit for the participants before they start the survey since we cannot compensate them in case they get excluded after the first three questions. The online platform also allows us to restrict the number of attempted completions of the survey to one per person.
Moreover, in an attempt to examine whether our findings are specific to highly infectious COVID-19 or generalize to more common virus infections, we will assess influenza infection history before 2020, as well as vaccination history for influenza (Q11-Q13).50
Additionally, we will use the Short Health Anxiety Inventory (SHAI)36 to quantify health anxiety in response to the pandemic. With this inventory, we will conduct exploratory analyses to examine the potential role of general health anxiety traits in COVID-19 medical histories. The SHAI uses 18-items scored between 0-3 and the individual scores are between 0 and 54.
We will record demographic information to further clarify the implications of our findings in various intersections of society. These questions include assessment of age, gender, housing environment, personal and household incomes, employment status, occupation, ethnicity (Q27-Q35).50 We will also directly assess self-reported compliance with immunizing behaviors such as personal hygiene (e.g., handwashing, surface cleaning) and social distancing practices. This will allow us to map out the connection between psychological traits, behavior and COVID-19 diagnoses.
In the analysis, we plan to categorize participants into four groups based on their medical history with COVID-19 (Figure 1). These groups are Tested positives (participants who reported to be tested positive for COVID-19 via either viral or antibody test); Tested negatives (participants who reported to have tested negative for COVID-19 via either viral or antibody test); Self-diagnosed positives (participants who reported not taking medical testing for COVID-19 but they or a medical professional assumed their COVID-19 infection); Self-diagnosed negatives (participants who reported not taking medical testing for COVID-19 and they or a medical professional assumed no COVID-19 infection). We opted for categorizing diagnoses by medical professionals under self-diagnosis since diagnostic outcomes can depend on individuals' infection-awareness and their communication of subjective symptom severity.28
The data will be collected using CloudResearch MTurk Toolkit with area restrictions for the United States. This platform is increasingly used for psychological and medical research due to its efficiency and wider reach across population than traditional convenience samples.37,38 Furthermore, a recent study demonstrated that using CloudResearch can yield comparably high data quality with other platforms.39 We will use initial inclusion criteria of a 95% or higher approval rate for eligible workers to improve our data quality.37 The approval rates indicate the percentage of completed experiments (HITs) approved by the experimenters on the platform, thus demonstrating consistent, high-quality performance. Furthermore, several attention checks in the form of catch questions will be implemented among the items of the psychological inventories to exclude inattentive responders. Additionally, we will use the response times to the psychological inventories (OCI-r and SHAI) pooled over all pilots to set the exclusion criteria. Specifically, we will exclude any participant whose median response time is longer than the mean median response time plus five standard deviations of all participants. The survey was coded using Inquisit 6 Lab version 6.3.5 (Inquisit LAB, RRID:SCR_022151) and hosted on Millisecond [Open access alternatives: PsychoPy version 2021.1.4 (PsychoPy, RRID:SCR_006571) hosted on Pavlovia].
The entire survey takes approximately 20 minutes to complete on average and the maximum completion time will be set to 45 minutes. Written informed consent will be provided before starting the survey. The participants will be compensated with three USD. The study was approved by the Monash University Human Research Ethics Committee (MUHREC) (Review Reference: 2020-24884-47066, approved on July 20th, 2020) and by the Sony Bioethics Committee (approved on November 13th, 2020).
To test our hypotheses with adequate statistical power, we need to obtain enough samples for each of the four groups with different COVID-19 diagnoses. In case we need to selectively recruit some groups, we will change the name of the study (which will be visible for the potential study participants), such as “US residents with NO medical history of COVID-19 positivity are eligible: Psychology and COVID-19” or “US residents with medical history of COVID-19 positivity are eligible: Psychology and COVID-19”. We will complete the data collection in batches of 125 participants while rotating the study titles to avoid the potential confound due to test timing differences across the studies with varied titles.
We conducted five pilot studies to assess the feasibility of the project. Four of the pilot studies provided adequate data for further analysis. (Due to suboptimal COVID-19 diagnostic inventories used in the first pilot, the first pilot data will not be reported here). The aggregated pilot data from four studies include 208 participants (average age: 37.68 ± 10.48, age range:18-75). Among the 208 participants, 73 identified as female, 131 identified as male, three identified as non-binary/gender diverse, and one participant did not disclose their gender. The specific hypotheses (H1, H2) were examined using Welch’s t-test. Group means and standard deviations are shown in Table 2.
| OCI-r scores (N = 208) | |||
|---|---|---|---|
| Group | n | Mean | SD (±) |
| Tested positive | 59 | 22.05 | 15.87 |
| Tested negative | 30 | 26.23 | 19.20 |
| Self-diagnosed positive | 29 | 21.03 | 16.36 |
| Self-diagnosed negative | 90 | 13.14 | 11.04 |
| SHAI scores (N = 81) | |||
|---|---|---|---|
| Group | n | Mean | SD (±) |
| Tested positive | 18 | 14.00 | 8.61 |
| Tested negative | 14 | 14.43 | 8.72 |
| Self-diagnosed positive | 15 | 14.40 | 7.53 |
| Self-diagnosed negative | 34 | 14.38 | 8.93 |
First, we examined whether the measured OC traits are higher in the tested COVID negative group than in the tested positive group (H1). We did not find a significant difference in the OC traits between the tested positive (M = 22.05, SD = 15.87) and tested negative (M = 26.23, SD = 19.20) groups (t(49.65) = 1.028, p = 0.309, Cohen’s d = 0.237) (Figure 2).
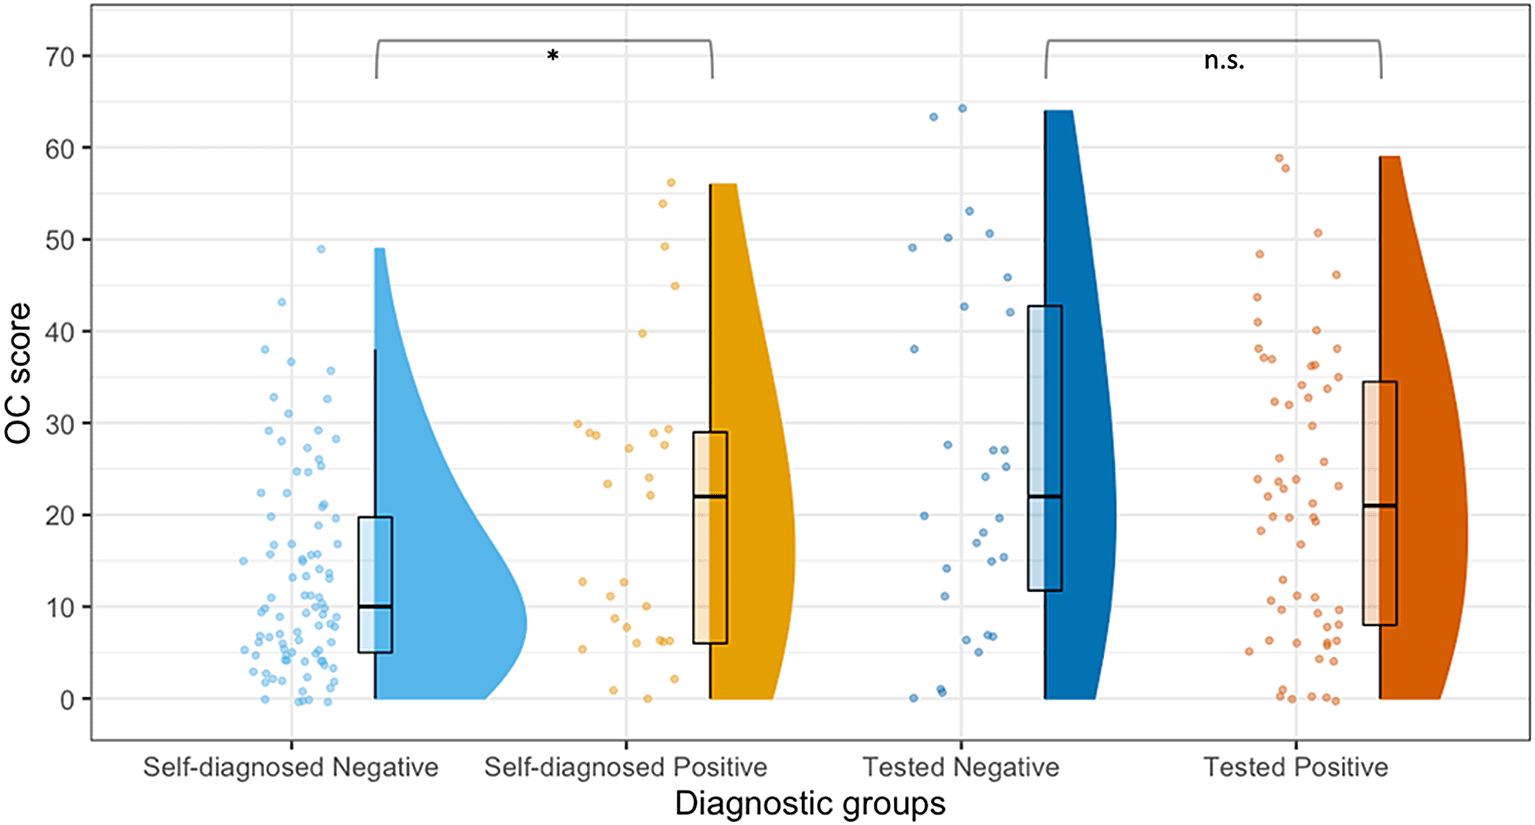
The boxplots represent medians and the interquartile ranges. * indicates p < 0.05; n.s. indicates non-significant differences. OC, obsessive-compulsiveness.
Second, we examined whether the OC traits are higher in the self-diagnosed COVID positive group than the self-diagnosed negative group (H2). The OC traits were significantly higher among the self-diagnosed positive group (M = 21.03, SD = 16.36) relative to the self-diagnosed negative group (M = 13.14, SD = 11.04; t(36.57) = 2.426, p = 0.021, Cohen’s d = 0.566) (Figure 2).
Based on the effect sizes in the pilot study, we conducted power analyses to determine the planned sample size for our studies. Power analyses were conducted in R using the package pwr.40
The first hypothesis (H1) was not significantly supported, and Cohen’s d was 0.237, indicating a small effect size.41 If we assume that the effect size is nevertheless indicative of a potential, small effect present in the population, the necessary sample size with a priori power of 0.95 is 464 participants for each of the tested and self-diagnosed groups of 1856 in total. Since this pilot result was non-significant and thus there is little concern that the observed effect size was inflated with potential sampling biases, we simply used the observed effect size value to estimate the required sample size without adjusting it with a method such as the small telescope method42 (Figure 3).
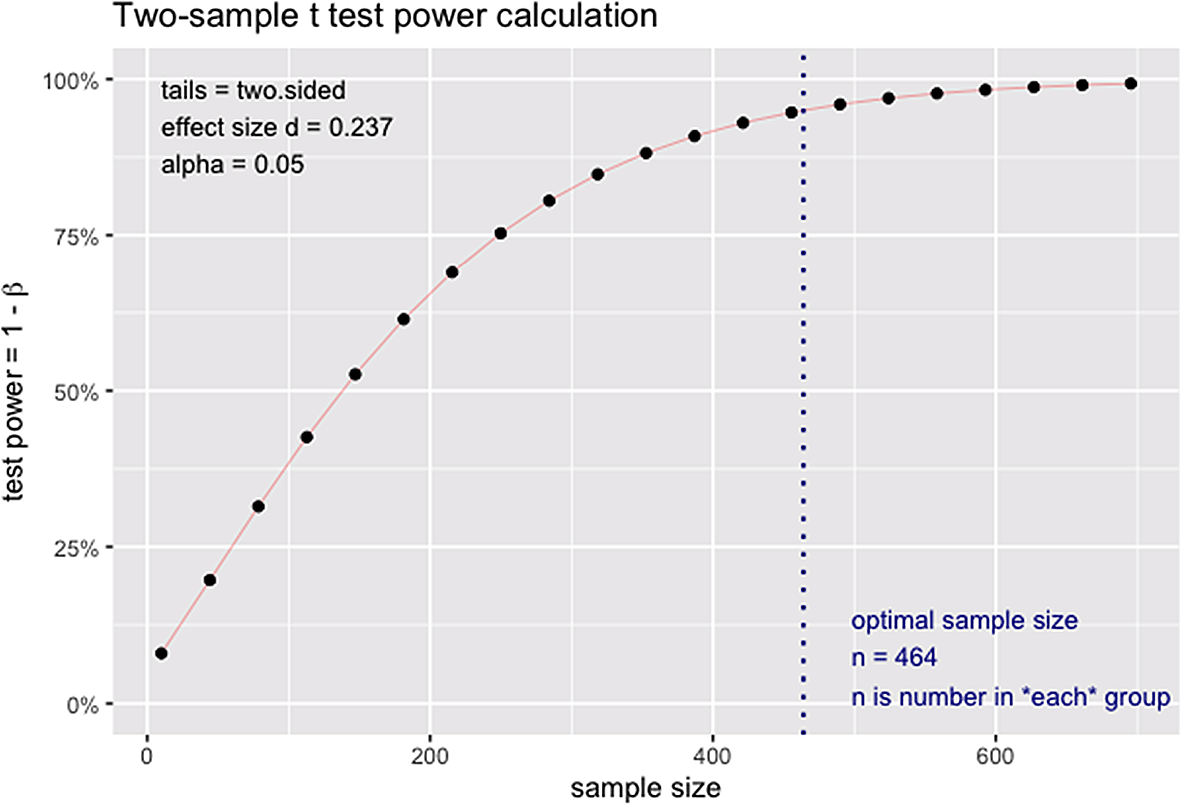
H1, first hypothesis.
The second hypothesis (H2) was supported with Cohen’s d = 0.566, indicating a medium effect size.41 Since the results were obtained from pilot studies (thus likely under-powered), we followed the suggestions of Simonsohn (2015) in applying the small telescope approach to more conservatively estimate our sample size.42 The approach entails first computing the effect size under the assumption that the previous (in our case, pilot) study had 0.33 statistical power. Then, using this effect size, we calculated the necessary sample size again to achieve 0.95 statistical power. In this case, the effect size estimation via the small telescope approach resulted in Cohen’s d = 0.259. Hence, the adjusted necessary sample size is 389 per group or 1556 in total. This number is sufficiently well above a more conventionally estimated sample size with our non-adjusted effect size (Cohen’s d = 0.566), which showed at least 83 participants are necessary for each of the self-diagnosed positive and self-diagnosed negative groups or 332 in total (Figure 4).

H2, second hypothesis.
In summary, we demonstrated that a full sample size of 1856 participants equally distributed between the four COVID diagnostic groups (n = 464) (tested positives, tested negative, self-diagnosed positives, and self-diagnosed negatives) would enable us to reliably test two of the main hypotheses (H1 and H2).
The statistical analysis will be conducted in R version 4.0.0 (R Project for Statistical Computing, RRID:SCR_001905).
We will conduct a 2 × 2 analysis of variance (ANOVA) for testing a potential interaction between Medical-testing (tested or self-diagnosed) and Diagnosis (positive or negative), in order to test the two hypotheses described in the introduction. The first hypothesis is that higher OC is related to lower COVID-19 infection rate due to their enhanced immunizing behaviors (such as hand-washing and social-distancing), which would be examined by comparing the participants who medically tested positive and those who medically tested negative. The second hypothesis is that higher OC is related to a higher (rather than lower) rate of self-diagnosis of COVID-19 (because of their obsessive concerns with contamination), which would be examined by comparing the participants who are self-diagnosed positive versus self-diagnosed negative. That is, between the groups who are medically tested and self-diagnosed, we had the opposing predictions regarding the relationship between higher psychological scores and positive diagnosis. Following our analyses with the pilot studies, we will conduct Welch's two-tailed t-tests for testing each of our hypotheses (H1-H2).
In case Frequentist approaches above fail to support one or some of our hypotheses (Table 3), we will complement our frequentist approach by calculating Bayes Factors (BF) using the R package BayesFactor.43 This will provide us a complementary tool to evaluate the quality of evidence supporting our hypothesis as well as aid in the process of the interpretations of null-results.44 To compute all BFs, we used 0.707 as the r-scale parameter. To interpret the results, we will follow the guidelines by Kass and Raftery (1995) i.e., 1-3 BF is considered as negligible evidence, 3-20 BF as positive evidence, 20-150 BF as strong evidence and more than 150 BF as very strong evidence.45 In case of BF smaller than 1, we have followed Navarro (2013) in interpreting the inverse BF in support of the null hypothesis.46
We will conduct a set of exploratory analyses to shed light on more detailed relationships between psychological traits and COVID-19 diagnosis as well as potential mediating factors. Specific exploratory hypotheses will be denoted with “exp” subscript (i.e., Hexp), while hypotheses, which mainly support the main results are denoted as “sup” (i.e., Hsup). The figures of these exploratory analyses on the pilot data can be found as Extended data.50
Recently published studies have identified an increase in some obsessive-compulsive symptoms in people with OCD.47 By contrast, a longitudinal study suggests that OC traits in the general population (rather than symptoms in the clinical population) may not significantly change with the pandemic.10 To assess if there was any change in the general population, we will compare the OC scores of our pilot sample with the OC scores collected during the main data collection phase.
To further investigate the relationship between OC traits and self-diagnosis, we will examine whether higher OC traits may be related to increased access to medical testing to validate self-diagnosis. Specifically, we will compare OC traits between the medically tested and the self-diagnosed groups regardless of the diagnostic outcome (Hsup1). With our pilot data, we found that the medically tested group (M = 23.46, SD = 17.07) showed significantly higher OC traits than the self-diagnosed group (M = 15.07, SD = 12.92) (t(157.94) = 3.882, p < 0.001, Cohen’s d = 0.555).
In our main analyses, we will treat the levels of OC as continuous variables reflecting the diversity of those traits in general populations.7 We are further interested in whether the participants exceeding the clinical cut-off OC score of 2135 would particularly show differential COVID-19 history than the rest of the participants. First, we will examine whether the hypothesized relationship between OC and COVID-19 diagnosis (H1, H2) would be supported even when excluding participants with clinical levels of OC.
With the pilot data, none of the results remained intact if we excluded the clinically high OC participants (Figure 5). No difference was found in OC traits between the medically tested positive and medically tested negative groups (H1): (t(26.74) = -0.857, p = 0.800, Cohen’s d = 0.275); nor between self-diagnosed positive versus negative groups (H3): (t(23.51) = -0.925, p = 0.818, Cohen’s d = 0.245).
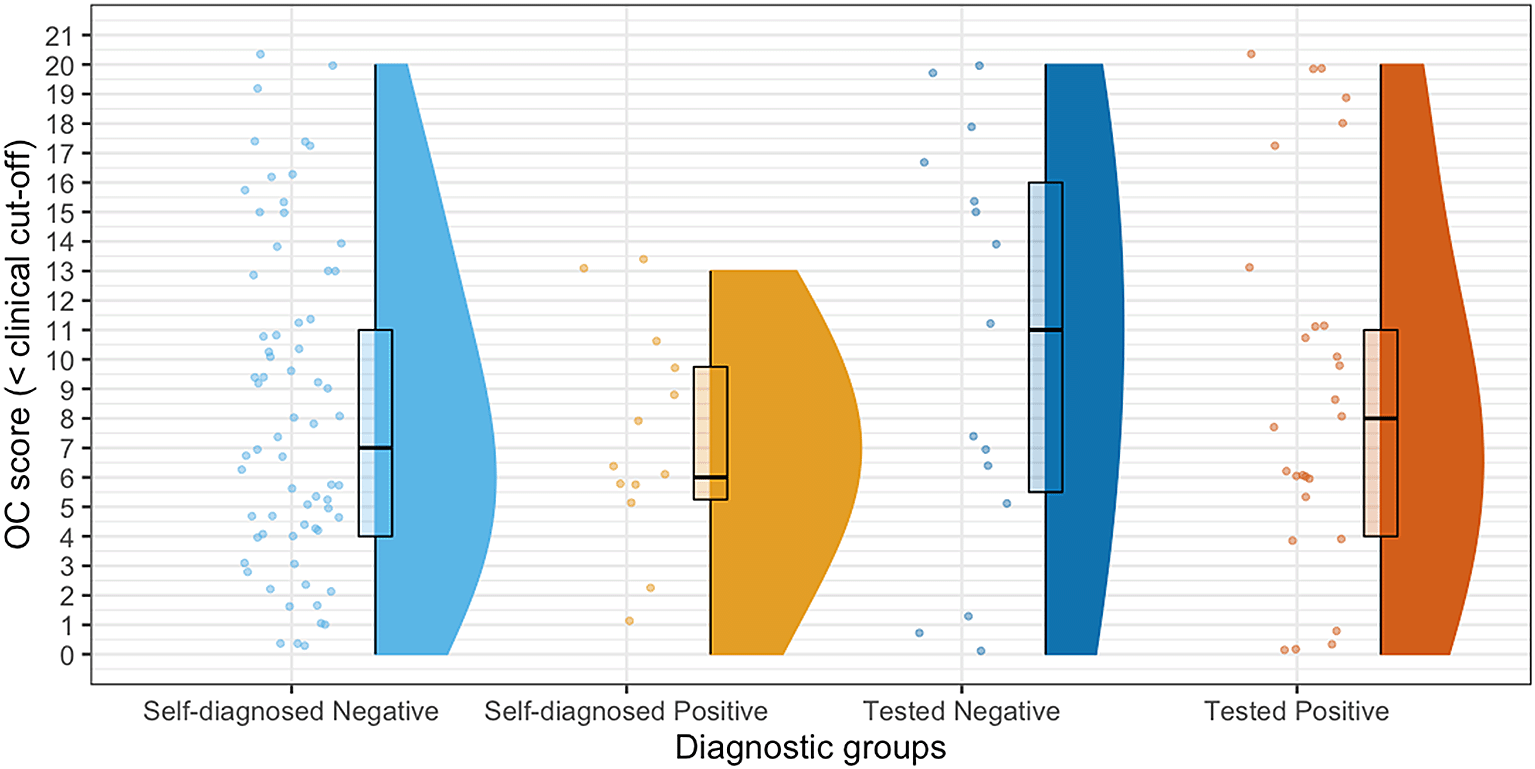
The boxplots represent medians and the interquartile ranges. OC, obsessive-compulsiveness.
Relatedly, we will examine whether there are significantly disproportionate representations of the participants with clinical levels of OC (Hsup2) in the four COVID-19 diagnostic groups (i.e., medically tested positive, medically tested negative, self-diagnosed positive, self-diagnosed negative). Again, we will use the clinical cut-off score of 21 for OCI-r.35 We will use this value to classify the participants into high OC and low OC groups. In those exploratory analyses with the main data collection, we will additionally exclude participants who report their diagnostic status of OCD even if their questionnaire scores are below the cut-off criteria.
We will use the Chi-square test of independence to investigate the relationship between COVID-19 diagnosis and the proportions of clinical levels of OC participants. In our pilot studies, with OC, a significant association was found (X2(3, N = 208) = 18.236, p < 0.001) highlighting a selective under-representation of the participants with clinical OC levels in the self-diagnosed negative group (Figure 6).
We will test whether higher OC scores are associated with more subjective confidence in self-diagnosis of COVID-19 positivity. That is, the participants who had not taken any COVID-19 testing would report their self-detection of COVID-19, by selecting [“Surely positive”, “Probably positive”, “Probably negative”, “Surely negative”]. We will convert these response options as a four-point scale of high to low confidence and examine the correlation between the confidence level and the psychological traits (Hsup3). With our pilot data, we found no significant correlation between OC scores and confidence levels (r(115) = 0.10, p = 0.272) (Figure 7).
In the aforementioned planned analyses, we plan to treat the OC level as one entity. Yet, OC traits consist of several subscales.35 Thus, we will investigate the role of specific OCI-r subscales (washing, hoarding, obsessing) in medically validated history of COVID-19 positivity (H1) and self-diagnosis of COVID-19 positivity (H2). To this end, we will conduct the same analyses as testing the main hypotheses (see Table 1 and Statistical analysis) while substituting the total OC scores with the scores for each subscale.
With the pilot data, the results recapitulated the findings based on the total OC scores. First, similar to the main pilot findings with the total OC scores, there was no significant difference between the medically tested positive and negative groups with any of the OC subscales (H1):
OC washing scores between the medically tested positive and medically tested negative groups (t(58.96) = 0.850, p = 0.199, Cohen’s d = 0.190).
OC hoarding scores between the medically tested positive and medically tested negative groups (t(51.70) = 1.054, p = 0.148, Cohen’s d = 0.242).
OC obsessing scores between the medically tested positive and medically tested negative groups (t(47.43) = 0.906, p = 0.184, Cohen’s d = 0.211).
OC ordering scores between the medically tested positive and medically tested negative groups (t(56.58) = 0.311, p = 0.378, Cohen’s d = 0.071).
OC checking scores between the medically tested positive and medically tested negative groups (t(52.76) = 1.092, p = 0.139, Cohen’s d = 0.250).
OC neutralizing scores between the medically tested positive and medically tested negative groups (t(55.09) = 1.047, p = 0.150, Cohen’s d = 0.237).
By contrast, in line with the pilot results with the total OC scores, we found significant differences when comparing the self-diagnosed positive and negative groups (H2) except in case of the neutralizing subscale:
OC washing traits among self-diagnosed positive vs self-diagnosed negative groups (t(36.16) = 1.958, p = 0.028, Cohen’s d = 0.459).
OC hoarding traits among self-diagnosed positive vs self-diagnosed negative groups (t(35.53) = 1.809, p = 0.039, Cohen’s d = 0.427).
OC obsessing traits among self-diagnosed positive vs self-diagnosed negative groups (t(37.39) = 1.711, p = 0.047, Cohen’s d = 0.396).
OC ordering traits among self-diagnosed positive vs self-diagnosed negative groups (t(38.95) = 2.642, p = 0.006, Cohen’s d = 0.602).
OC checking traits among self-diagnosed positive vs self-diagnosed negative groups (t(43.41) = 1.864, p = 0.034, Cohen’s d = 0.409).
OC neutralizing traits among self-diagnosed positive vs self-diagnosed negative groups (t(36.37) = 1.561, p = 0.063, Cohen’s d = 0.365).
As general health anxiety has some commonality with OC traits such as heightened fear of contamination, we will examine whether general health anxiety as measured with SHAI38 will contribute to COVID-19 infection histories similarly to OC scores (Hexp1). While health anxiety shows some commonality with OC traits, SHAI has been shown to reliably differentiate between hypochondriasis and OC in clinical samples.48 Since the SHAI inventory was only included in pilot five, we only have data from 81 participants.
To explore the relationship between SHAI and infection rates, we will use ANOVA with a 2x2 factorial design between Medical-testing (tested or self-diagnosed) and Diagnosis (positive or negative). With the pilot studies, none of the main effects or the interaction was significant (all p-values > 0.910) (Figure 8). As the SHAI scores showed no difference between any groups, the pilot results thus suggest the specificity of observed effects of OC traits.
If OC traits generally contribute to reducing infection, then we might find additional correlational evidence. For example, the higher the scores for OC 1) the later the date of infection and 2) more symptoms reported when infected (possibly due to higher interoceptive awareness). Also, the heightened sense of infection awareness might lead to 3) more frequent voluntary medical testing to check the COVID. Additionally, the higher scores of OC may be related to 4) enhanced willingness to take vaccination for COVID-19. To test these possibilities, we will test four correlations between OC scores and infection dates (Hsup4) (Figure 9), the number of symptoms reported (Hsup5) (Figure 10), the rate of taking a COVID-19 test for voluntary reasons rather than external reasons, such as traveling or being involved in contract-tracing (Hsup6) (Figure 11), and past record with as well as future plan to take the vaccine for COVID-19 (Hsup7).
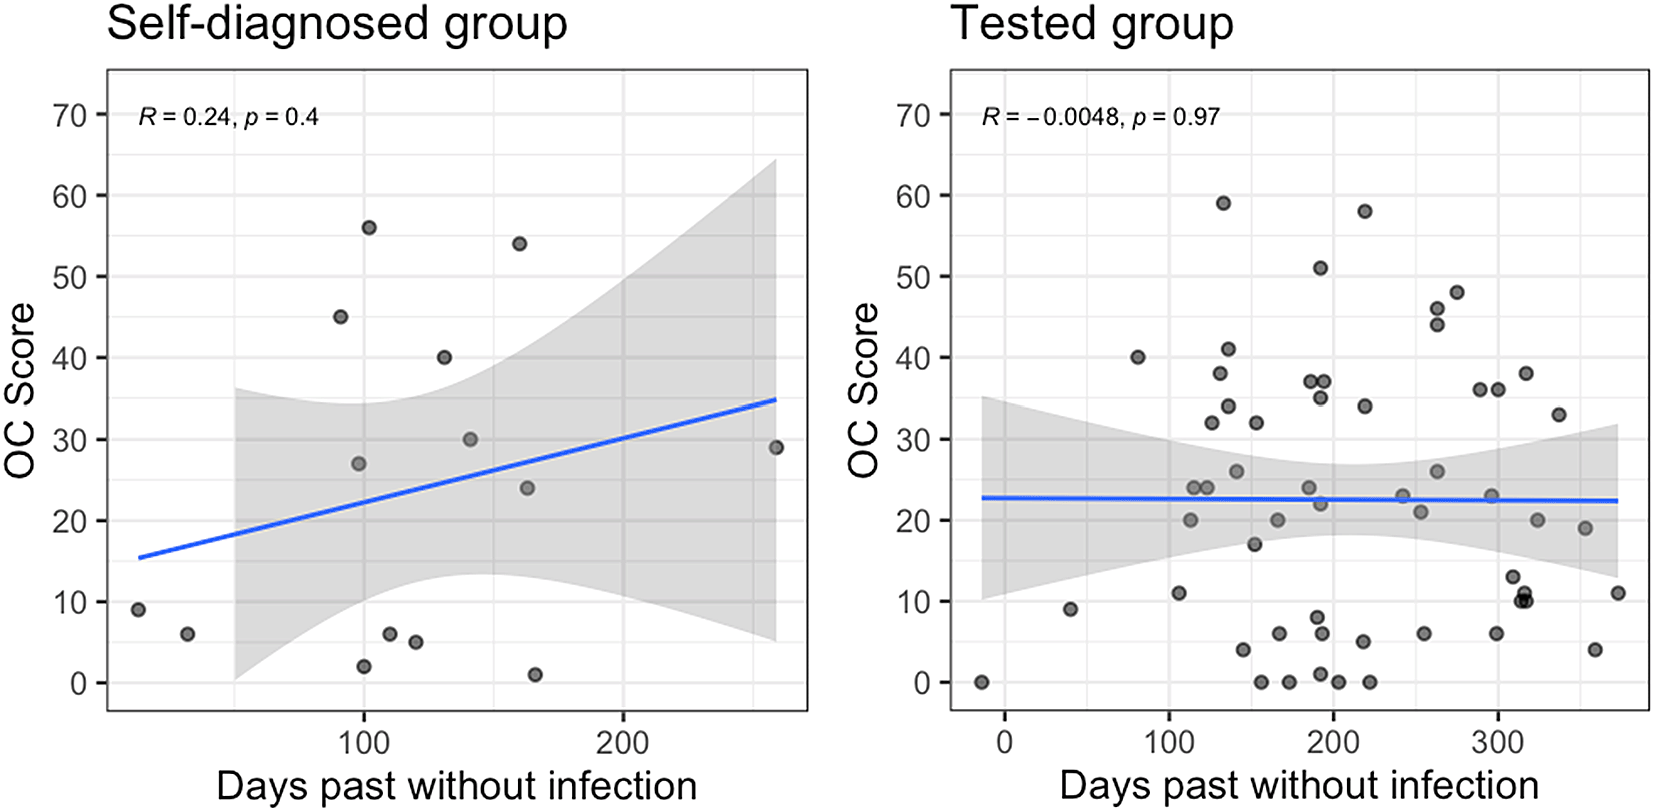
For participants who reported a date for their diagnosis (via test or subjectively), we calculated the number of days between their diagnosis and the 1st of December 2019. OC, obsessive-compulsiveness; COVID-19, coronavirus disease 2019.
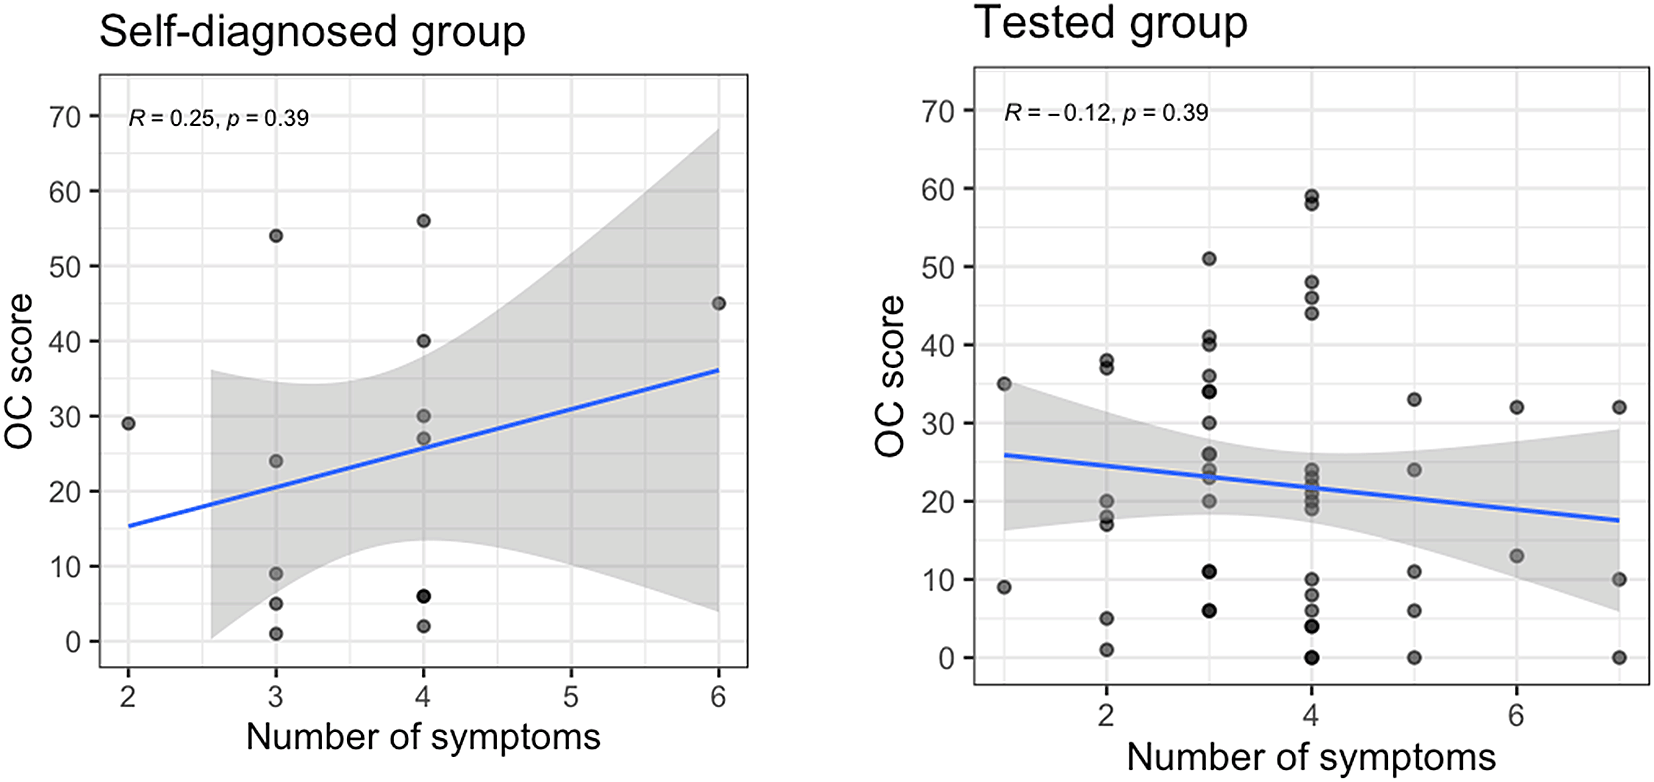
OC, obsessive-compulsiveness; COVID-19, coronavirus disease 2019.
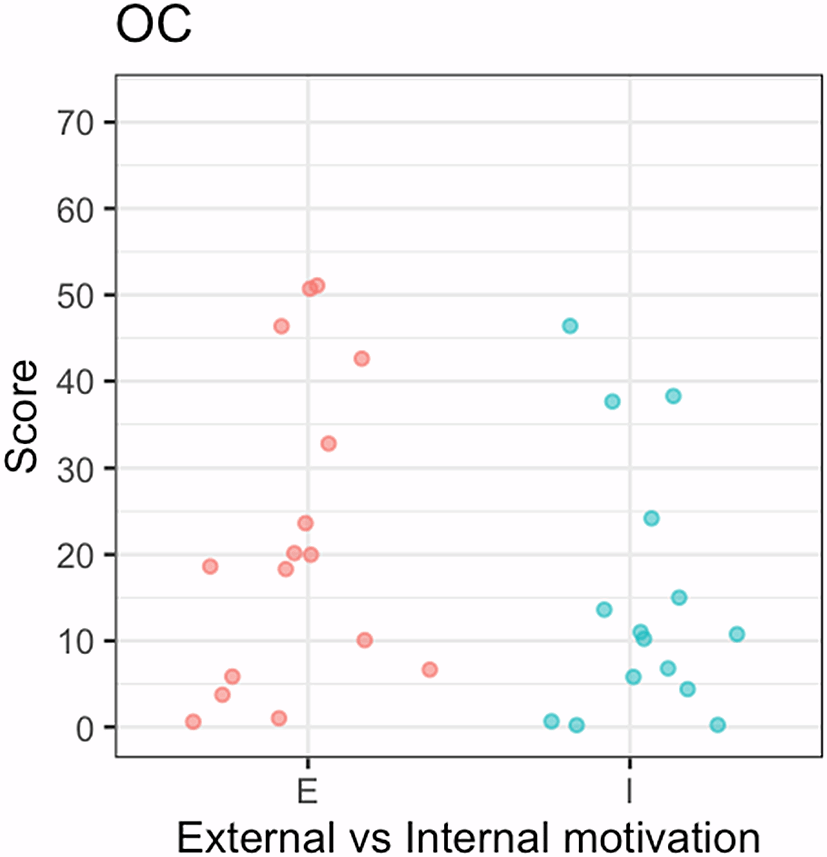
Data available only in pilot five. OC, obsessive-compulsiveness; COVID-19, coronavirus disease 2019.
With the pilot studies, none of the examined correlations showed significance (all p-values > 0.1). The OC scores in the voluntary testing vs the external reasons-motivated testing groups were examined using Welch's t-test and we found no significant difference.
As an additional validation check for the main findings, we will examine if the observations (in our main analyses, see Table 1) are replicated in case of another respiratory illness (i.e., influenza). This analysis will be accompanied with an assessment of attitudes towards vaccination including past vaccination for influenza (Hexp2, Hexp3).
When we examined the above question in the pilot data, we recognized that the medically tested population for influenza was not present in sufficient numbers to test the hypotheses meaningfully (H1). No significant differences were found between the self-diagnosed positive and negative groups for influenza and OC traits:
OC traits among self-diagnosed influenza positive vs self-diagnosed influenza negative groups (H3): (t(25.15) = 0.756, p = 0.228, Cohen’s d = 0.168) (Figure 12). Furthermore, there was no significant difference in OC traits between vaccination status (Figure 13).
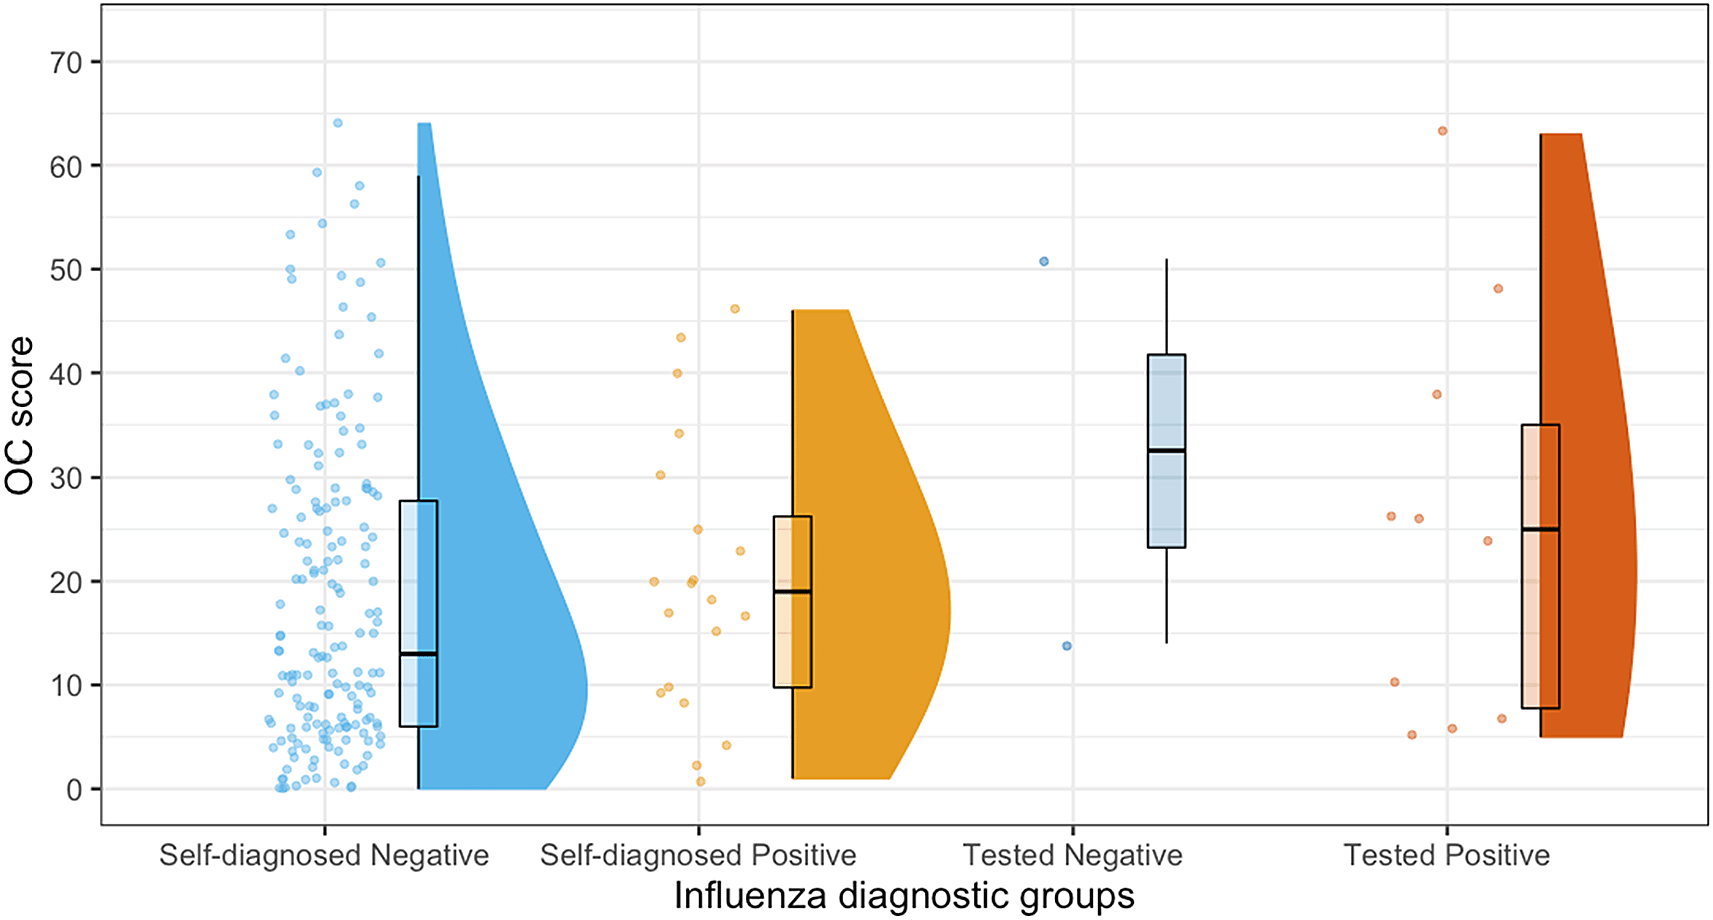
The boxplots represent medians and the interquartile ranges. OC, obsessive-compulsiveness.
‘I don’t know’ or ‘I prefer not to answer this question” were excluded. The boxplots represent medians and the interquartile ranges. OC, obsessive-compulsiveness.
Finally, we will explore the roles of socio-economic status (SES) variables and their mediating roles in the effects of OC scores (age, gender, employment, income, ethnicity) using linear mixed-effects models. For example, we will examine if medically tested individuals have higher incomes. Furthermore, we will also use area of residence (indicated by ZIP codes and grouped according to states) as a potential covariate as well as the maximum durations of lockdowns in that state.
We will examine whether the demographic variables including age, gender, and others may differ across the four diagnostic groups of the COVID-19 (i.e., medically tested/self-diagnosed positive or negative). In case any of the demographic variables statistically differ across the groups, we will conduct our main frequentist analysis (ANOVA) while controlling for such variables to see if the effects of OC still hold.
We will also explore the relationship between OC and commonly recommended immunizing behaviors for example, cleaning of hands and surfaces, social distancing, and the number of vaccinations. We will follow the analysis by Shah et al. (2021) in categorizing participants into high and low adherence groups and we will use these groupings to test for differences in OC scores.49
The raw data and the analysis codes will be made available open access via Open Science Framework in line with FAIR Data Principles.
We have conducted a pilot study and have all methodological platforms ready to start data collection after Stage 1 acceptance.
Open Science Framework: Neurodiversity and COVID. 10.17605/OSF.IO/XR2TJ.50
This project contains the following extended data:
Data are available under the terms of the Academic Free License (“AFL”) v. 3.0.
The work was partly supported by Japan Science and Technology agency (JST) presto (JPMJPR18J3) and JST moonshot (20343198) awarded to AiK.
| Views | Downloads | |
|---|---|---|
| F1000Research | - | - |
|
PubMed Central
Data from PMC are received and updated monthly.
|
- | - |
Provide sufficient details of any financial or non-financial competing interests to enable users to assess whether your comments might lead a reasonable person to question your impartiality. Consider the following examples, but note that this is not an exhaustive list:
Sign up for content alerts and receive a weekly or monthly email with all newly published articles
Already registered? Sign in
The email address should be the one you originally registered with F1000.
You registered with F1000 via Google, so we cannot reset your password.
To sign in, please click here.
If you still need help with your Google account password, please click here.
You registered with F1000 via Facebook, so we cannot reset your password.
To sign in, please click here.
If you still need help with your Facebook account password, please click here.
If your email address is registered with us, we will email you instructions to reset your password.
If you think you should have received this email but it has not arrived, please check your spam filters and/or contact for further assistance.
Comments on this article Comments (0)