Keywords
forecasting, electricity consumption, exponential smoothing, time series
This article is included in the Energy gateway.
forecasting, electricity consumption, exponential smoothing, time series
In Malaysia, energy is no longer viewed as a luxury as it is becoming a necessity in our everyday activities such as in transportation, production, commercial activities, and residential anthropogenic activities.1 Energy consumption in residential sectors grew up to 7% within the period 1978 to 2015.2 As one of the countries with the highest recorded energy per capita and energy intensity over the years, electricity is considered as an important form of energy which drives Malaysia’s economic development.3,4 The Malaysia Energy Information Hub (MEIH) revealed that electricity consumption for the residential sector in 2018 was 2553 ktoe (kilotonne of oil equivalent), which is a slight decrease from 2017 with 2610 ktoe. However, in 2017 the World Energy Markets Observatory (WEMO) reported that electricity consumption is projected to increase by 4.8% annually up to 2030.
Thus, it is important to conduct a forecast of electricity consumption as it is significant for economic development as well as policy improvement.5,6 As a reliable and an important tool for making decisions, there are several forecasting techniques that can be used. In fact, the accuracy of forecasting can be observed to obtain significant results in the projection of electricity consumption.5 In this study, three different exponential smoothing models were utilised to forecast electricity consumption: simple, Holt, and Brown’s exponential smoothing.
This aim of this research was to conduct a study in order to forecast electricity consumption in Malaysia until the year 2032. This research also attempts to identify the most appropriate exponential smoothing model in forecasting electricity consumption.
Lee et al.,7 conducted a study involving six different forecasting methods, which were used to predict electricity consumption in Universiti Tun Hussein Onn Malaysia (UTHM), Malaysia. The study selected a mean absolute percentage error (MAPE) as the measurement of error. Historical data were obtained monthly from 2011 until 2017 which generated a projection up until December 2018. From the six forecasting models, Holt-Winters’ exponential smoothing was found to be the best technique implemented due to having the lowest MAPE. Similarly, Nazim and Afthanorhan8 also found that Holt’s exponential smoothing was the best method to predict Malaysia’s population from 2004 to 2020. The study selected a mean square error (MSE) as a criterion to determine the best model. There were four different techniques used which were single exponential smoothing (SES), double exponential smoothing (DES), Holt’s exponential smoothing, and adaptive response rate exponential smoothing (ARRES). Lima et al.,9 claimed that economic data could be forecasted using Holt-Winters’ exponential smoothing, which involves comparing additive and multiplicative practices. The results showed that multiplicative exhibited the best forecasting performance. Maçaira et al.,10 forecasted the best yearly projection for residential electricity consumption in Brazil by applying exponential smoothing. All the studies mentioned above provided economic projection values together with consumption growth and were validated by the accuracy of the forecast.
In contrast, Popeangă and Lungu11 found that the double moving average was the best technique in forecasting energy consumption in Romania from quarter one until quarter four of 2014. The study used two different moving average practices. Suresh12 used an autoregressive integrated moving average model (ARIMA) to analyse and forecast electricity consumption in India. The proposed ARIMA with the neural network (NN) model provided the best future time-series forecasting. A data set of 40 years of electricity consumption was analysed by Mahia et al.,13 using ARIMA methods. Several steps were conducted, and the best model was selected based on the lowest Akaike Information Criterion (AIC). Notably, the literature has specific reasons to conduct a moving average when the data set performs seasonally, particularly throughout the study period.
From a business perspective, exponential smoothing is used in projecting sales. For example, Sidqi and Sumitra14 applied the single and double exponential smoothing in a study with MAPE as the criterion to determine the accuracy of the forecast model. As a result, the single exponential smoothing exhibited the lowest MAPE. In the agricultural sector, Talwar and Goyal15 analysed and compared coriander prices in India using several exponential smoothing methods. The results showed that the Holt-Winters’ trend adjusted model provided the best model with the lowest error measurement in MSE. A study by Booranawong and Booranawong16 in Thailand showed that the double exponential smoothing method provided better performance in predicting Thai chilli and lemongrass prices. The study utilised MAPE to determine the minimum error measurement from other methods such as multiplicative Holt-Winters’ (MHW) and additive Holt-Winters’ (AHW). The forecasted prices of the agricultural products were from October 2016 to December 2019. Regardless of the sector, exponential smoothing is very suitable to conduct forecasting together with the least error of measurement, such as MAPE.
Based on previous literature, exponential smoothing has been widely used, and this technique captures the time series that may change its behaviour, and the model parameters should adapt to that change in behaviour as well.17 Currently, studies that provide exponential smoothing as a mechanism to predict the electricity consumption of the residential sector are limited. Therefore, this study selected this method as it is considered an appropriate technique to conduct a forecasting of the residential electricity consumption in Malaysia.
Three exponential smoothing models were used to forecast electricity consumption in this study: simple exponential smoothing, Holt’s exponential smoothing, and Brown’s exponential smoothing. Yearly data from 1997 to 2018 was obtained from the Malaysia Energy Information Hub (MEIH). The forecasting period started from the year 2019 until 2032. Details on the function and formula of the simple exponential smoothing, Holt’s exponential smoothing, and Brown’s exponential smoothing are explained in the following sections.
Simple exponential smoothing is the most widely used model in forecasting if there are no cyclic variation patterns or consistent growing patterns involved.14 The formula for this method is as follows18:
where:
: simple exponentially forecast value in period m, for ; : actual value in time t;
: unknown smoothing constant to be determined for value between 0 and 1;
: forecast value at period t.
Holt’s exponential smoothing can be used in forecasting when there is a linear trend in the historical data of the forecast. According to Alias,19 this method requires three equations which are exponential smoothed series, trend estimate, and forecast.
where:
: exponential smoothed series;
: trend estimates;
: forecast for m-step-ahead period.
This method is also known as the double exponential smoothing and can be used if there is a linear trend in the data. The trend is a smoothed estimate of average growth at the end of each period.17 The formula for Brown’s exponential smoothing is as follows:
: exponentially smoothed value of at time t;
: double exponentially smoothed value of at time t;
: computes the difference between the exponentially smoothed values;
: computes the adjustment factor;
: forecast for m-step-ahead period.
According to Kalekar,17 the forecasting model should be validated. Here, an error measurement such as mean absolute percentage error (MAPE), relative mean square error (RMSE), or mean absolute error (MAE) is needed. The selection of an error measurement has a significant effect in determining the most accurate forecasting method. In this study, MAPE was selected to verify the model because it is the most suitable measurement to compare the accuracy of the forecasting methods, as it measures relative performance.7,14,20 A low MAPE score indicates that the forecasting model has a good performance.21 The range of the MAPE score is shown in Table 1.
An analysis of the historical data was conducted to examine the pattern of electricity consumption trend (kilotonne of oil equivalent, ktoe) from 1997 until 2018 for the residential sector in Malaysia.
Based on Figure 1, the trend pattern in this time series is linear and no seasonality is involved. In addition, the graph shows a constant increase in the pattern. In 2016, a total of 2679 ktoe of electricity was consumed as the highest value. The consumption value gradually decreased from 2017 to 2018 with values of 2610 ktoe and 2553 ktoe respectively as shown in Table 2. Thus, all three exponential smoothing methods, namely simple, Holt’s and Brown exponential smoothing were capable of forecasting electricity consumption. The lowest MAPE was compared to identify the most appropriate exponential smoothing model.
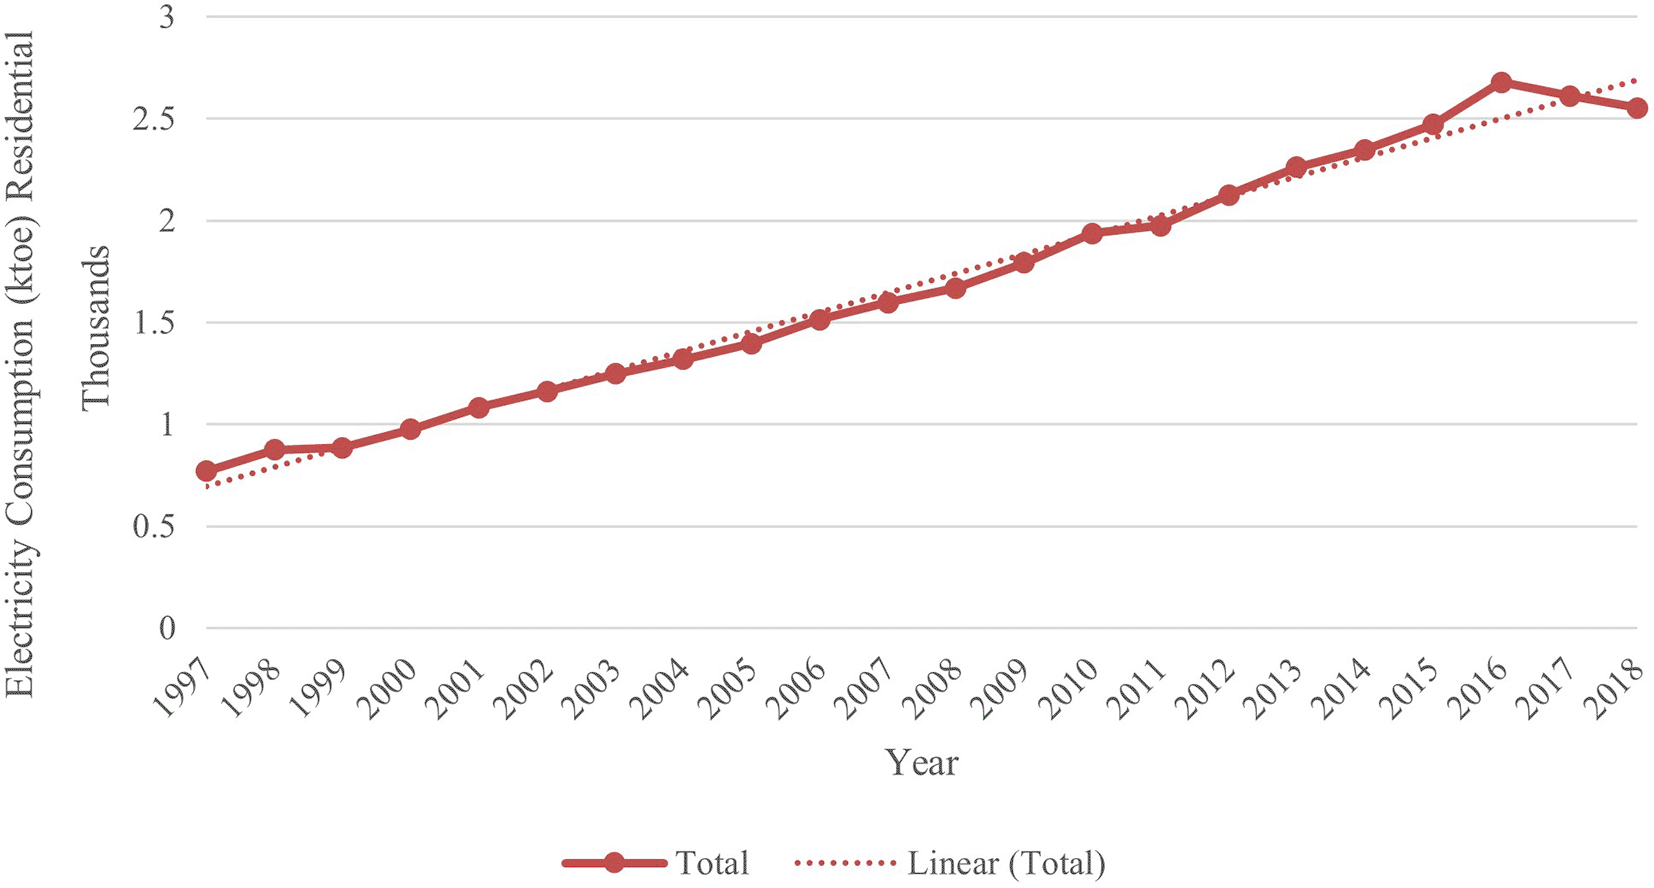
(Source: Malaysia Energy Information Hub, https://meih.st.gov.my/statistics.)
The simple exponential smoothing was analysed using SPSS version 26 (IBM SPSS Statistics, RRID:SCR_019096) starting from the year 2019. Referring to Figure 2, the three lines represent the limit of the forecast values for the forecast year: yellow indicates the upper limit of electricity consumption, purple indicates the best prediction of electricity consumption, and brown indicates the lower limit of electricity consumption at a particular year. This means that the expected electricity consumption could fall between the green and brown dotted lines.
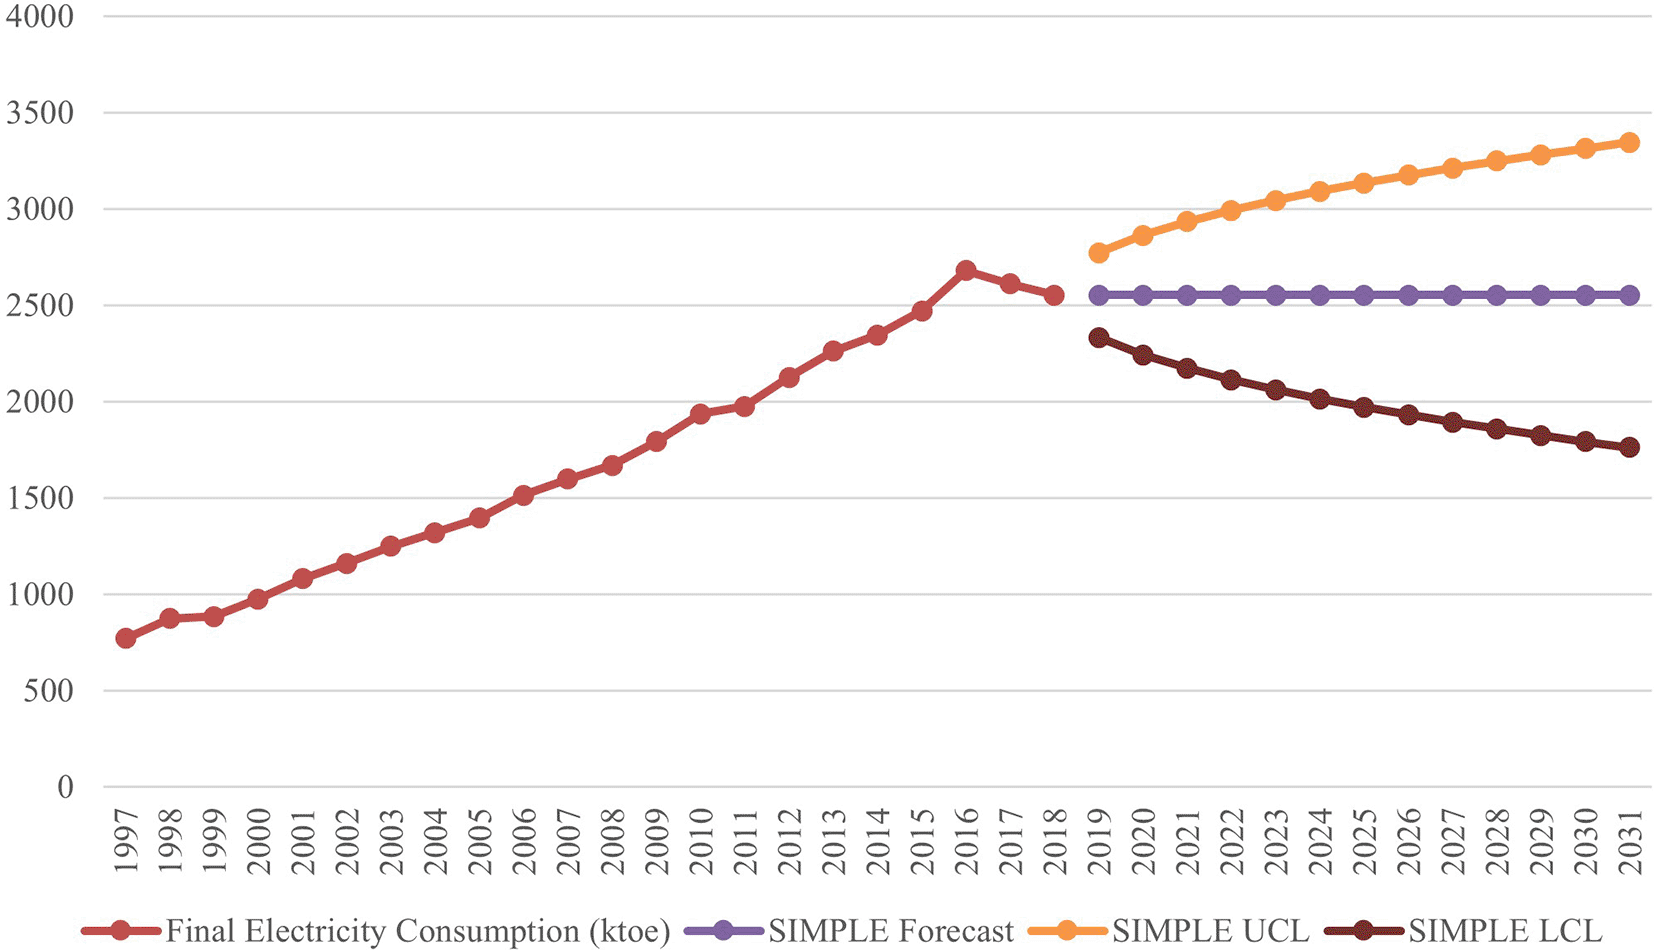
UCL: upper confidence level (upper limit); LCL: lower confidence level (lower limit).
Based on Table 3, the year 2019 recorded the best forecasted electricity consumption, which is 2553 ktoe; the consumption maintains this value until 2032. However, this method also predicted a wide range of possible values until 2032. For example, the electricity consumption in 2032 is predicted to be between 3345 ktoe as the upper limit and 1760 ktoe as the lower limit, but the best value generated is 2553 ktoe.
The accuracy of the forecasting value was measured via model fit statistics. As shown in Table 4, there are three error measurement scores generated by SPSS version 26: relative mean square error (RMSE), mean absolute percentage error (MAPE), and mean absolute error (MAE). For simple exponential MAPE, the score is 5.678.
Figure 3 shows Holt’s exponential smoothing method, which was conducted. It is expected that the electricity consumption value would fall between the pink and brown dotted lines for the forecast year, but the width is narrower compared to the previous method. It can be observed that the forecast has a considerable upward trend from 2019 until 2032.
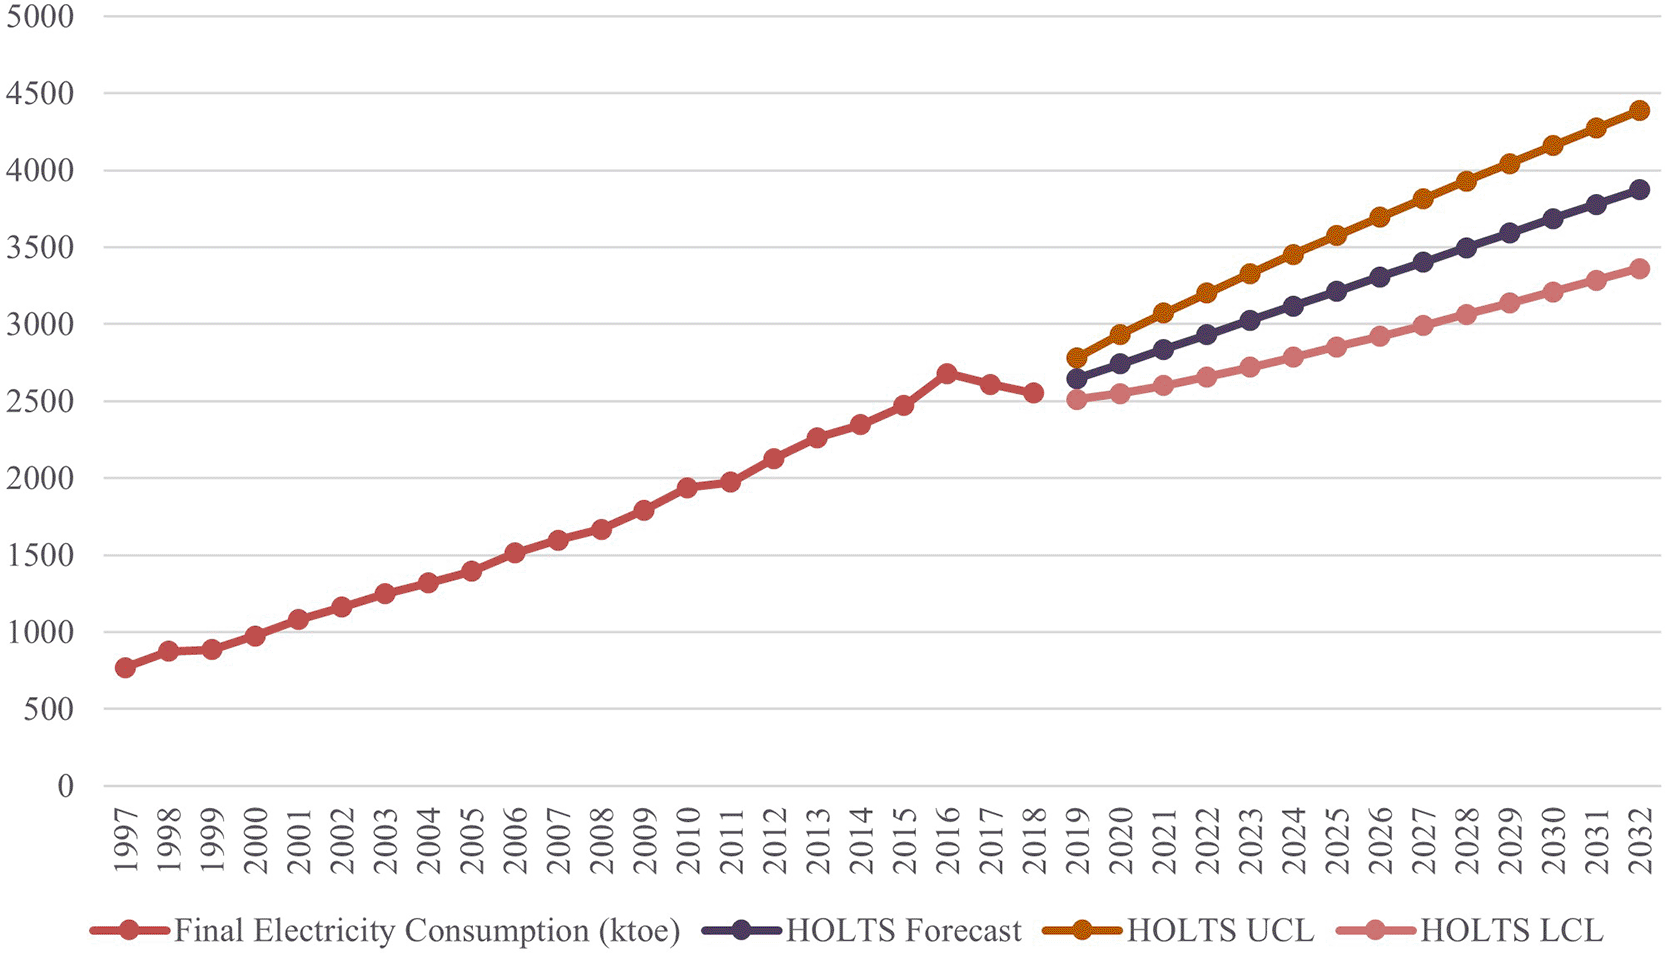
UCL: upper confidence level (upper limit); LCL lower confidence level (lower limit).
The value of the best forecasted electricity consumption was 2647 ktoe for 2019 and 3873 ktoe for 2032 as shown in Table 5. In 2032, the predicted electricity consumption value would be between 3360 and 4386 ktoe whereas the best projected value is 3873 ktoe. Table 6 shows the accuracy of the forecasting where the score measured by MAPE is 2.299.
The last forecasting method is Brown’s exponential smoothing (Figure 4). This method enjoys a very wide range of forecasting values where the upper and lower limit values experienced a steep trend. In 2019, the forecasted electricity consumption value is 2402 ktoe. However, the value gradually decreases year by year until 2032 with a consumption value of 2399 ktoe as presented in Table 7. In 2032, the predicted electricity consumption value would be within 4967 ktoe as the maximum value and 90 ktoe as the minimum value; the best projected value is 2399 ktoe. Table 8 shows the MAPE score for Brown’s exponential smoothing, which is 3.125. The lower the MAPE score, the higher the accuracy of the forecast.
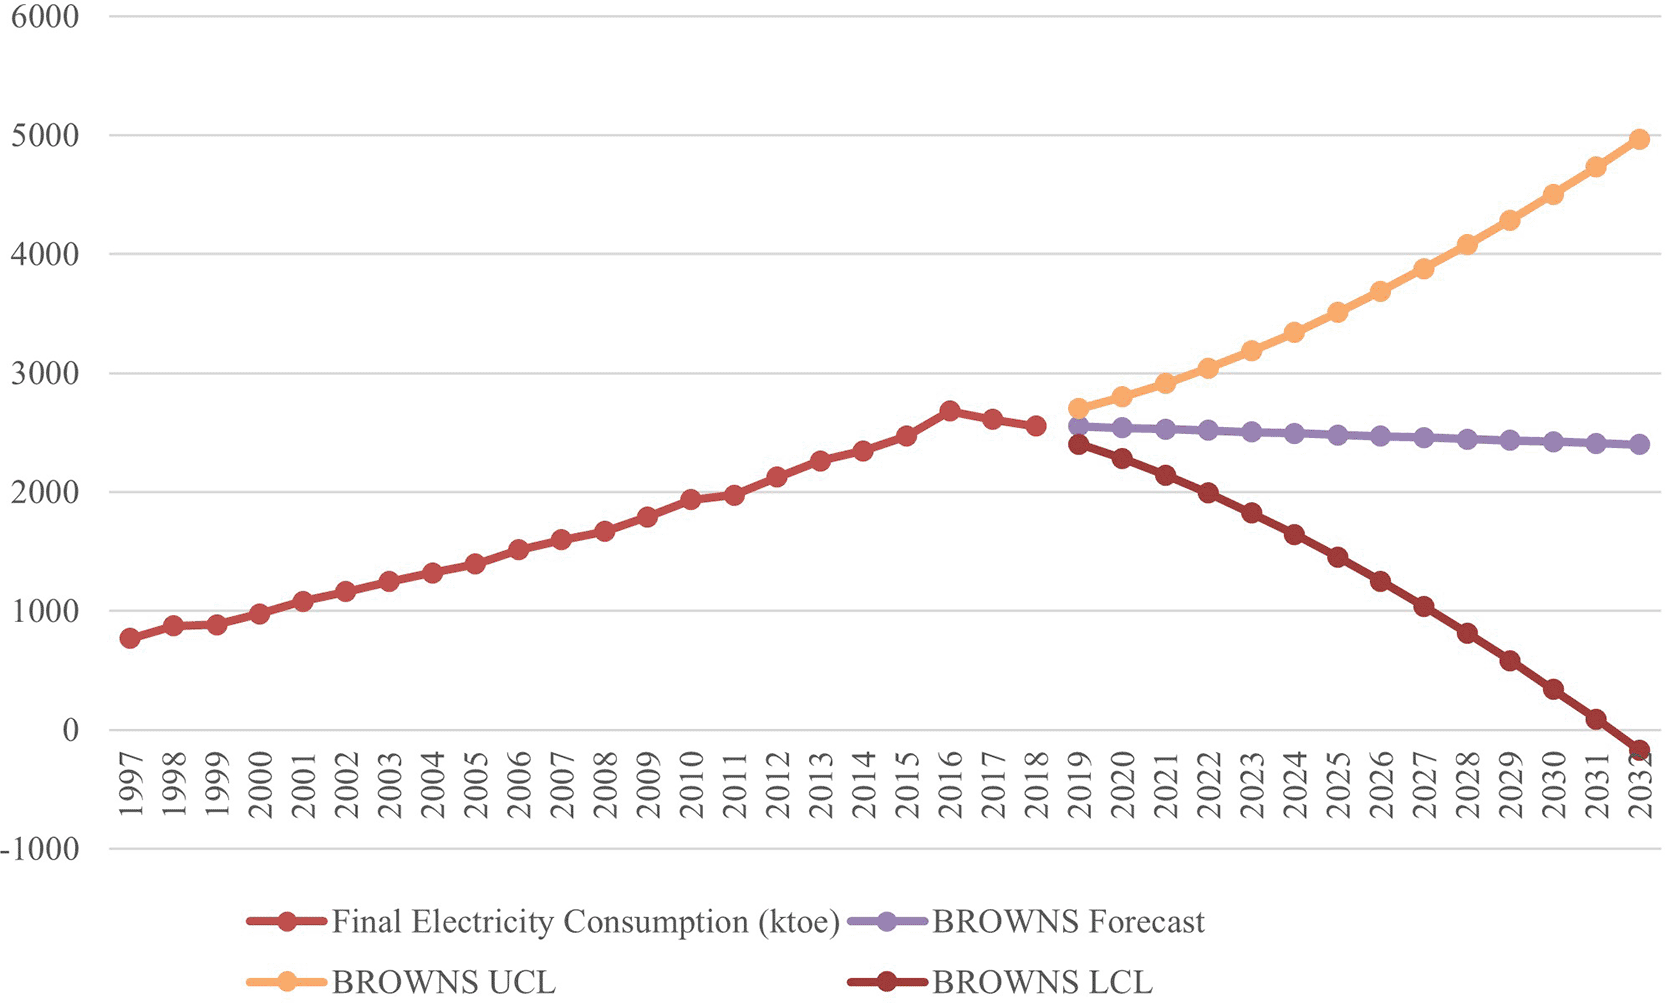
UCL: upper confidence level (upper limit); LCL: lower confidence level (lower limit).
Table 9 shows the summary of all smoothing methods using MAPE as the measurement. Holt’s exponential smoothing is the most suitable method to predict the electricity consumption of the residential sector in Malaysia. This is because this method has the lowest MAPE score which is 2.299 compared to the other two methods. The result is consistent with Omer et al.22 where they used MAPE to identify the most appropriate prediction model. Therefore, in this study, Holt’s exponential smoothing is the best method to forecast future electricity consumption in Malaysia.
| Method | MAPE |
|---|---|
| Simple exponential smoothing | 5.678 |
| Holt’s exponential smoothing | 2.299 |
| Brown exponential smoothing | 3.125 |
Table 5 lists the forecasting values from 2019 until 2032 generated by Holt’s exponential smoothing. In 2032, the maximum electricity consumption is 4386 ktoe and the minimum consumption is 3360 ktoe. However, the best predicted value is 3873 ktoe.
The aim of the study was to forecast the total electricity consumption in Malaysia until the year 2032 and to identify the most appropriate exponential smoothing model to predict this consumption. Based on the results and discussion, Holt’s exponential smoothing was found to be the most appropriate model in forecasting electricity consumption in Malaysia. Generally, electricity consumption in residential sectors comes from electrical appliances. Hence, based on the predicted consumption growth, energy efficiency regulations by electrical manufacturers should be revised. Campaigns for less energy demand in households should also be implemented. This can benefit both parties by maximising energy efficiency and minimising electricity consumption. As a suggestion for further study, moving average methods can also be applied to predict electricity consumption. There are various types of moving average method including the integrated model such as autoregressive–moving-average (ARMA), autoregressive integrated moving average (ARIMA), autoregressive integrated moving average- neural network (ARIMA-NN), or the hybrid model. These methods can be used by future researchers to further expand on this study.
| Views | Downloads | |
|---|---|---|
| F1000Research | - | - |
|
PubMed Central
Data from PMC are received and updated monthly.
|
- | - |
Provide sufficient details of any financial or non-financial competing interests to enable users to assess whether your comments might lead a reasonable person to question your impartiality. Consider the following examples, but note that this is not an exhaustive list:
Sign up for content alerts and receive a weekly or monthly email with all newly published articles
Already registered? Sign in
The email address should be the one you originally registered with F1000.
You registered with F1000 via Google, so we cannot reset your password.
To sign in, please click here.
If you still need help with your Google account password, please click here.
You registered with F1000 via Facebook, so we cannot reset your password.
To sign in, please click here.
If you still need help with your Facebook account password, please click here.
If your email address is registered with us, we will email you instructions to reset your password.
If you think you should have received this email but it has not arrived, please check your spam filters and/or contact for further assistance.
Comments on this article Comments (0)