Keywords
remote sensing, NDVI, Landsat 8 satellite, Gradient Boosting Regressor, machine learning, agriculture, crop yield, Geographic information systems (GIS)
This article is included in the Agriculture, Food and Nutrition gateway.
This article is included in the Machine learning: life sciences collection.
remote sensing, NDVI, Landsat 8 satellite, Gradient Boosting Regressor, machine learning, agriculture, crop yield, Geographic information systems (GIS)
Agriculture is a term that is used broadly to describe the various aspects and origin of plant and animal foodstuffs and plant growth. This term exists in a framework consisting of three environments, i.e. the biophysical environment, socio-political environment, and economic and technological environment (Yunlong and Smit, 1994). Agriculture plays an important role in a country, both developed and developing countries. However, not all countries have the same agricultural technology, and the differences are seen in developed and developing countries. For example, according to the United States Department of Agriculture, corn yields in the US in 2020 were around 4.3 t/ha. Meanwhile, corn yields in Ethiopia have only increased from 0.9 to 3.5 t/ha since 1960 (Petersen, 2018). In Indonesia, corn yields increased by about 4.52% from 2014 to 2015 (BPS-Statistics Indonesia, 2015). Farmers in developing countries don’t have financial and educational resources available compared to farmers in developed countries, in general. Therefore, yield prediction in developing countries is imperative as the crop yields are more susceptible to droughts and other dangerous issues (Petersen, 2018).
There are a few agriculture-related research methods that have been used to predict crop yields. Petersen (2018) predicted the yield of corn, soybean, and sorghum –two to four months before its harvest time. He utilized remote sensing technology from MODIS satellite imagery to obtain the relationship between a few vegetation indices and crop yields using a machine learning method (i.e. multivariate regression). Shiu and Chuang (2019) predicted the yield of rice paddy using SPOT-7 satellite imagery to obtain the vegetation index of rice paddy. They used a machine learning method (i.e. support vector regression) to predict the yield of rice paddy. Pantazi et al. (2016) also used a machine learning method (i.e. artificial neural network) and satellite imagery to predict the yield of wheat. Ahmad et al. (2010) estimated soil moisture using TRRM satellite imagery using machine learning methods (i.e. support vector machine and artificial neural network). Maas (1988), utilized Landsat satellite imagery to estimate the yield of sorghum grain.
The following research shows that crop vegetation indices have a linear relationship with yield. These researchers used machine learning methods called linear regression. Bartlett et al. (1989) utilized satellite imagery to estimate solar radiation and carbon dioxide exchange of a grass canopy. Du Plessis (1999) obtained a linear relationship between a vegetation index and rainfall using NOAA AVHRR satellite imagery. Irsan et al. (2019) predicted corn yield from a few types of vegetation indices extracted from Sentinel 2A satellite imagery. Zhang et al. (2019) predicted rice paddy productivity from a vegetation index extracted from Landsat 8 satellite imagery and Sari et al. (2013) utilized Landsat 8 satellite imagery to estimate rice paddy yield.
Currently, remote sensing technology can be used to detect the phenomenon of food plant vegetation because satellite imagery is easily accessible to anyone (Maas, 1988). Useful data such as vegetation indices and the earth’s surface temperature can be generated from satellite imagery. Vegetation indices describe how healthy the crop is (Zhang et al., 2019), and surface temperature is one of the external factors that affect crop growth (Bartlett et al., 1989). This research utilized Landsat 8 satellite imagery to obtain a vegetation index (i.e. NDVI) and surface temperature. The relationship between remote sensing data and crop yields was obtained using Gradient Boosting Regressor machine learning methods as Gradient Boosting Regressor is a linear method that uses boosting techniques to produce a powerful and robust model in predicting crop yields (Friedman, 2001).
In this research, we built a computational model in several stages to predict the yield of lowland paddy crops, which is illustrated in Figure 1. This workflow diagram is described in detail in the following section.
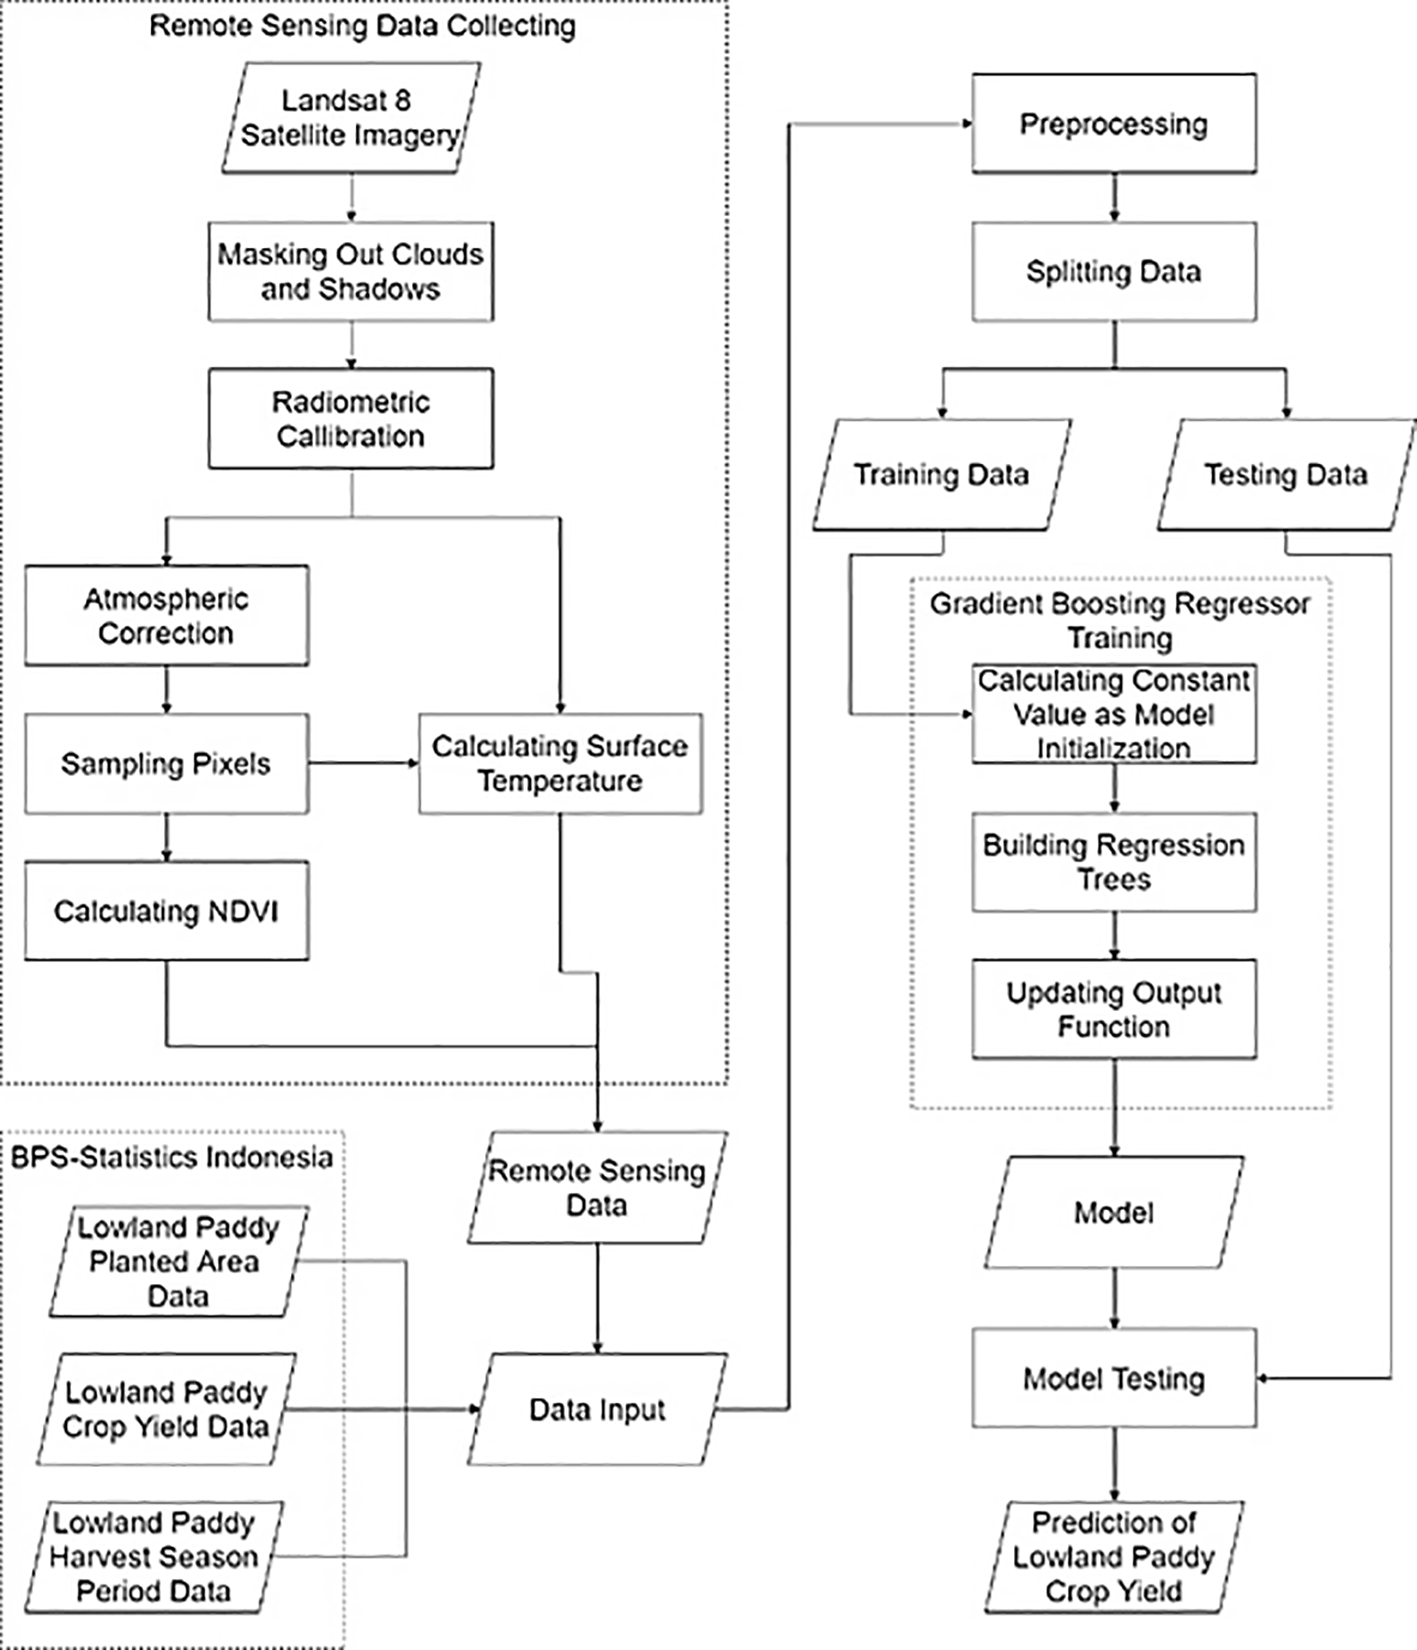
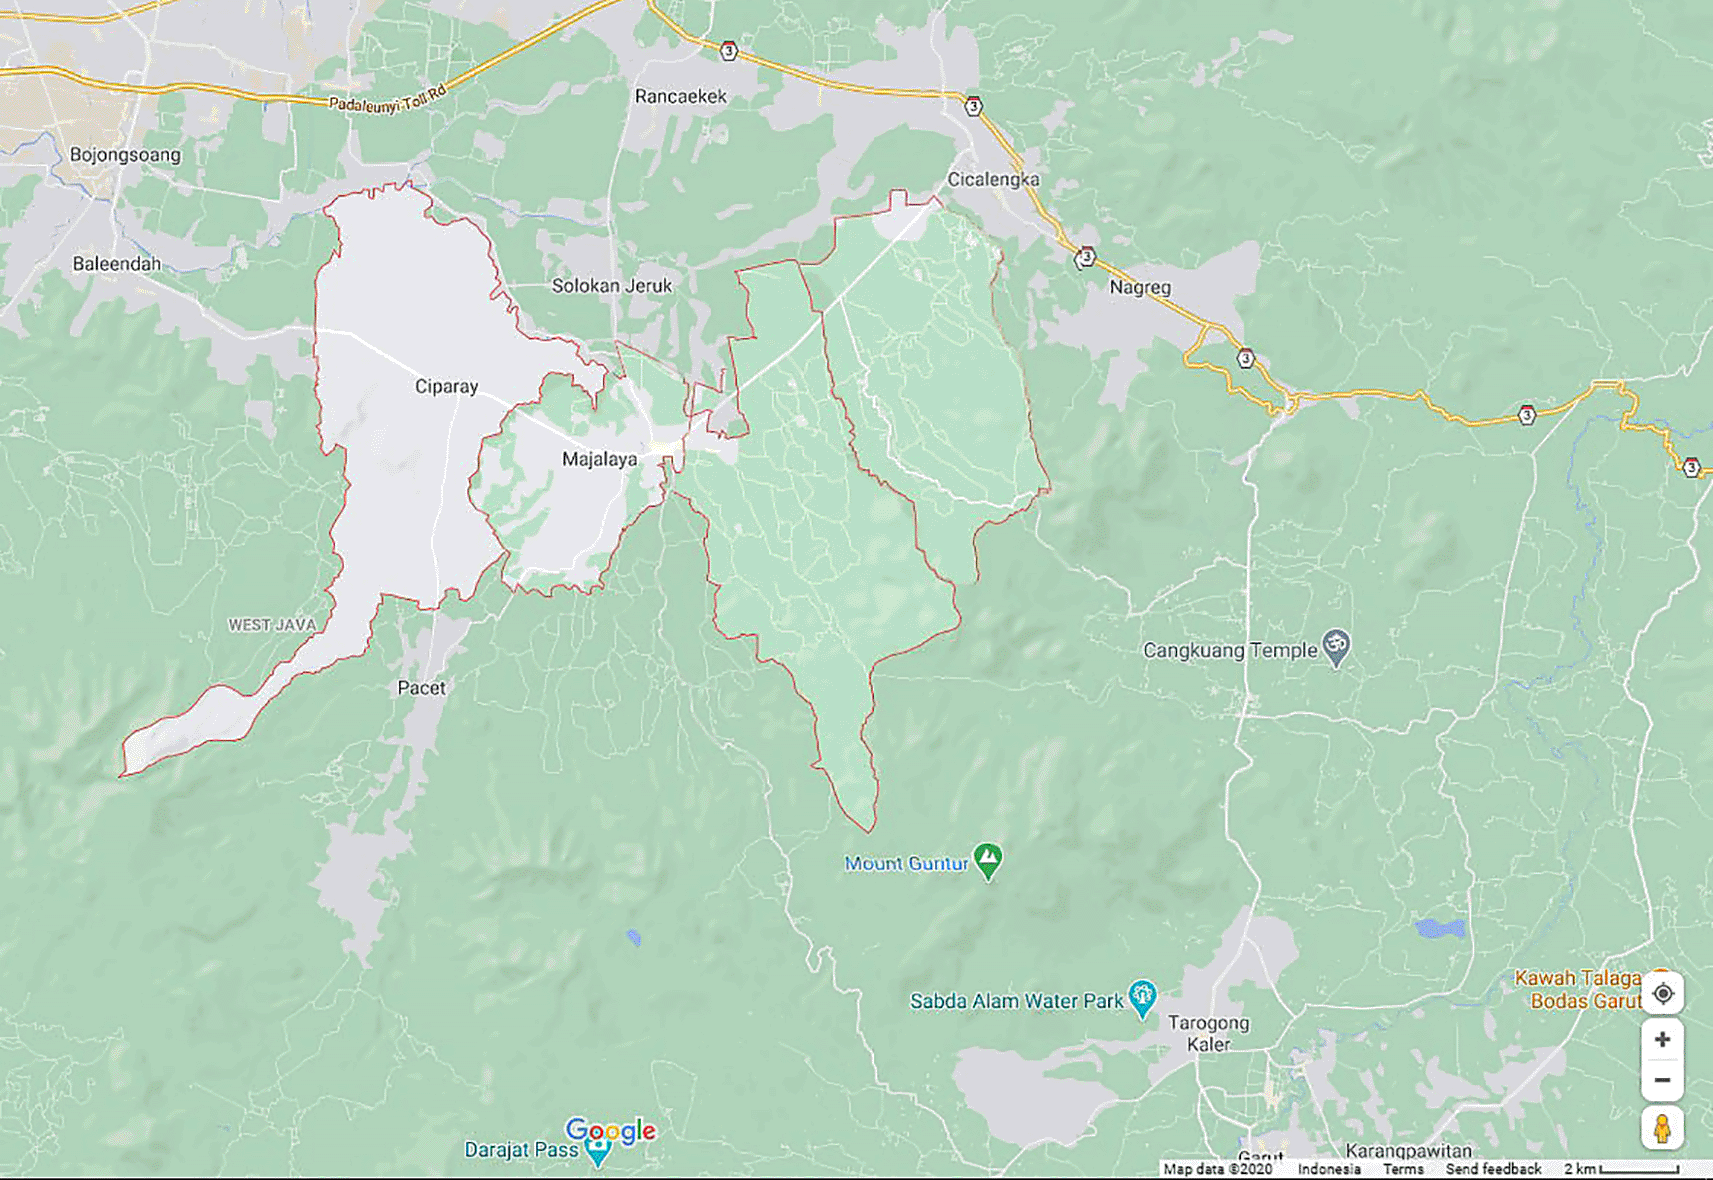
The first stage in the workflow diagram was remote sensing data gathering and processing using ENVI remote sensing software version 5.3 or other software that has the ability to process Landsat 8 satellite data, such as the open-access alternatives: QGIS (RRID:SCR_018507), Orfeo ToolBox, and GRASS GIS, which can provide equivalent functions. Landsat 8 (L8) satellite imagery were downloaded from the EarthExplorer website with the following criteria: 1) dataset using satellite Landsat 8 OLI/TIRS C1 Level-1; 2) coordinate on Bandung (Lat: -6.9455, Lon: 107.6138); 3) date from May 21, 2013 to December 5, 2015. The specific location that was studied included four different sub-districts in Bandung, which were Cikancung, Ciparay, Majalaya, and Paseh. Landsat 8 (L8) satellite imagery data was processed to obtain the Normalized Difference Vegetation Index (NDVI) and the earth’s surface temperature value. Lowland rice yield data was obtained from reports published by BPS-Statistics Indonesia of Bandung (see Data availability).
An Indonesian topographical map was used to determine the boundaries of the paddy field area in Bandung. This can be downloaded through the Indonesia Geospatial Portal. All relevant data can be found in Riza et al. (2022a).
Before the satellite imagery data was processed, the data was resized and divided into subsets so that the data size was not too large. Large data sizes caused slow processing and consumed a lot of storage on the computer. Resizing and sub setting of data were performed using Region of Interest (ROI) files created based on the topographical map. Satellite imagery data was cleaned if pixels were considered as clouds and shadows using the Quality channel in L8 imagery. The pixels that were considered disrupting were greater than 2800 on the Quality L8 band (Landsat Missions | U.S. Geological Survey (usgs.gov)). The pixels that were processed were pixels with a value below 2800. Satellite imagery data needed to be calibrated and corrected so that the image was free from disturbances caused by the atmosphere. An example of this is the absorption of red light by ozone gas in the atmosphere that distorts the reflectance value in the imagery so that it cannot represent the phenomenon of vegetation (Tanre et al., 1992).
Not every pixel in the imagery could be involved in the process of obtaining NDVI and the earth’s surface temperature value due to the disturbances of the clouds and shadows. Clouds and shadows cause variations in the number of pixels in various locations every day. Therefore, sampling techniques were required. The number of samples can be obtained by the Cochran formula (Cochran, 2007) as follows:
Where:
number of samples
Z value depends on confidence level
percentage picking a choice (0.5 used for sample size needed)
confidence interval
For a finite population number, there are adjustments to the formula as follows:
Where:
number of samples
number of populations
The sampling technique used was stratified random sampling that is already available in the ENVI software. ENVI will automatically stratum the total pixels and determine which pixels will be sampled.
The NDVI vegetation index is a transformation of the combination of the red and near-infrared band (Ikasari et al., 2016) that is formulated as follows:
Where:
NIR = reflectance of near infrared
Red = reflectance of red
Near infrared contributes to light reflected by leaf structures, while the red band contributes to light absorbed by leaf structures (Jensen, 1996). In ENVI, NDVI calculations can be obtained automatically based on the type of satellite imagery using the NDVI tool.
The temperature of the earth’s surface is one of the external factors that can affect the growth of paddy crops. Cold temperatures will cause rice seedlings to grow slower than warmer temperatures (Vergara, 1992). In the L8 imagery, the temperature of the earth’s surface can be obtained by performing a brightness temperature calibration on the thermal band of the satellite imagery.
The second stage in the workflow is the data pre-processing stage. This stage consists of three stages, which are the one-hot encoding process, adjusting the array of input data, and data standardization. One-hot encoding is an approach to convert categorical features into a more suitable format as input in a machine learning model (Zheng and Casari, 2018). Gradient Boosting Regressor model as a regression model requires input data in numerical form. The categorical features of remote sensing data used in this study were the harvest period or harvest sub round features.
Adjusting the input data array converts the data from Pandas DataFrame into a NumPy array. This conversion is intended so that the data can be processed using various mathematical operation functions available in the NumPy library version 1.19.1 (RRID:SCR_008633) in Python (Python Programming Language, RRID:SCR_008394).
Data standardization aims to change each feature in the input data so it has the same value range, which is between 0 and 1. With standardization, each feature has the same opportunity to influence the computational model. Standardization was done using Z-score standardization (Zill et al., 2011) which is formulated as follows:
Where:
standardized samples
samples
mean of samples
The Gradient Boosting algorithm uses the boosting technique to the Gradient Descent method, both for classification and regression problems (Bishop, 2006). The model built with the Gradient Boosting Regressor algorithm (Friedman, 2001) can be seen in Table 1.
The training process begins with an input consisting of input data and loss function derivatives. The loss function that can be used in this model is the square loss function (Friedman, 2001) which is formulated as follows:
Constant value initialization is done by calculating the optimal value that can minimize the loss function. After the constant value has been initialized, calculate the (pseudo residual) for each row of data. Once is obtained, create a Regression Tree that predicts . Calculate (output value) for each leaf in the Regression Tree. Update the output function every time the Regression Tree is built.
The Regression Tree (James et al., 2013) model as a weak learner in Gradient Boosting Regression can be seen from the algorithm in Table 2.
The metric used for the data splitting process in the Regression Tree used in this study is variance reduction (Loh, 2011), which involves the variance value for the total data and two splitting results based on the threshold. Model testing is done by tracing each Regression Tree that has been created. The learning rate is involved in the leaf value obtained in each tree to obtain the prediction result. The prediction results at the testing stage are the output of this research workflow. The source code of this computational model can be found in Riza et al. (2022b).
We conducted experiments based on the workflow diagram that was built. This section describes the experimental study in constructing a computational model to predict the yield of lowland paddy crops.
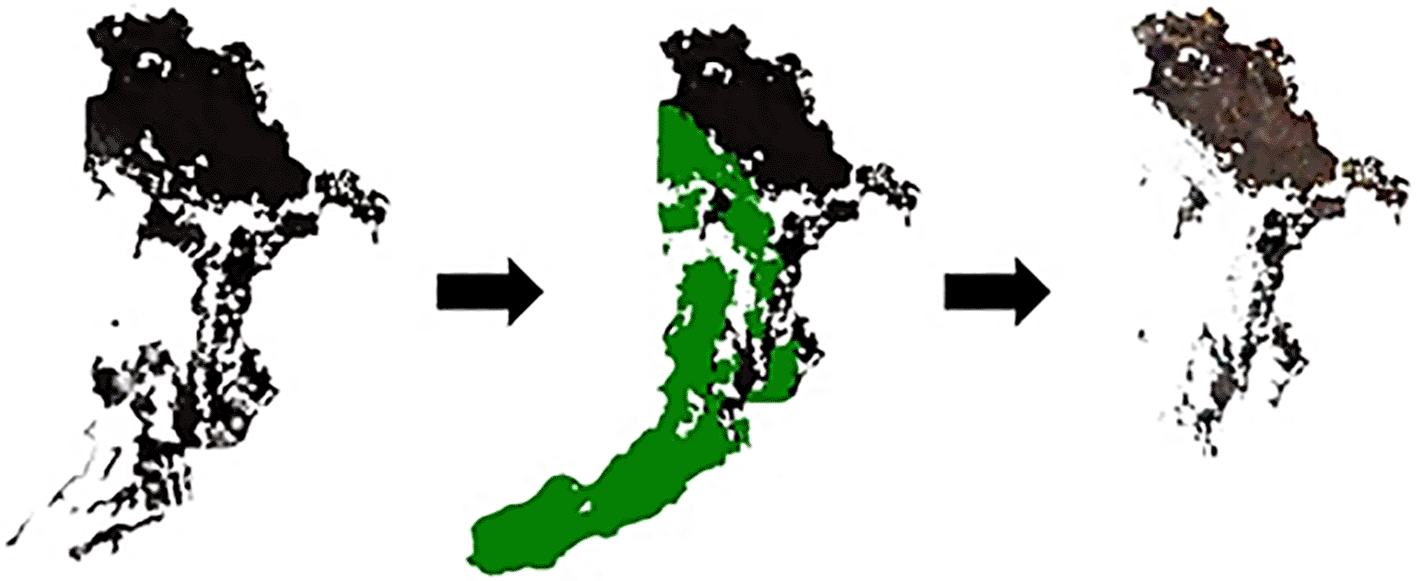
Figure 2 is a map of Bandung as a research area and the zone of interest is in white. Pixels that interfered with image data (clouds and shadows) were removed using the Quality channel on the Landsat 8 (L8) image data. The Region of Interest (ROI) was created based on disrupting pixels. Figure 3 shows the ROI file of the cloud pixels and its shadow in green.
After the imagery data was clean of disturbing pixels, the next step was to perform radiometric calibration and atmospheric correction. The differences in the image before and after being calibrated and corrected are not visible to the human eye. Nevertheless, the difference can be seen in the reflectance value that changes at each stage as in Table 3. After the data was calibrated and corrected, the pixel value was adjusted to obtain the accurate reflectance value by dividing 10,000 by all pixels.
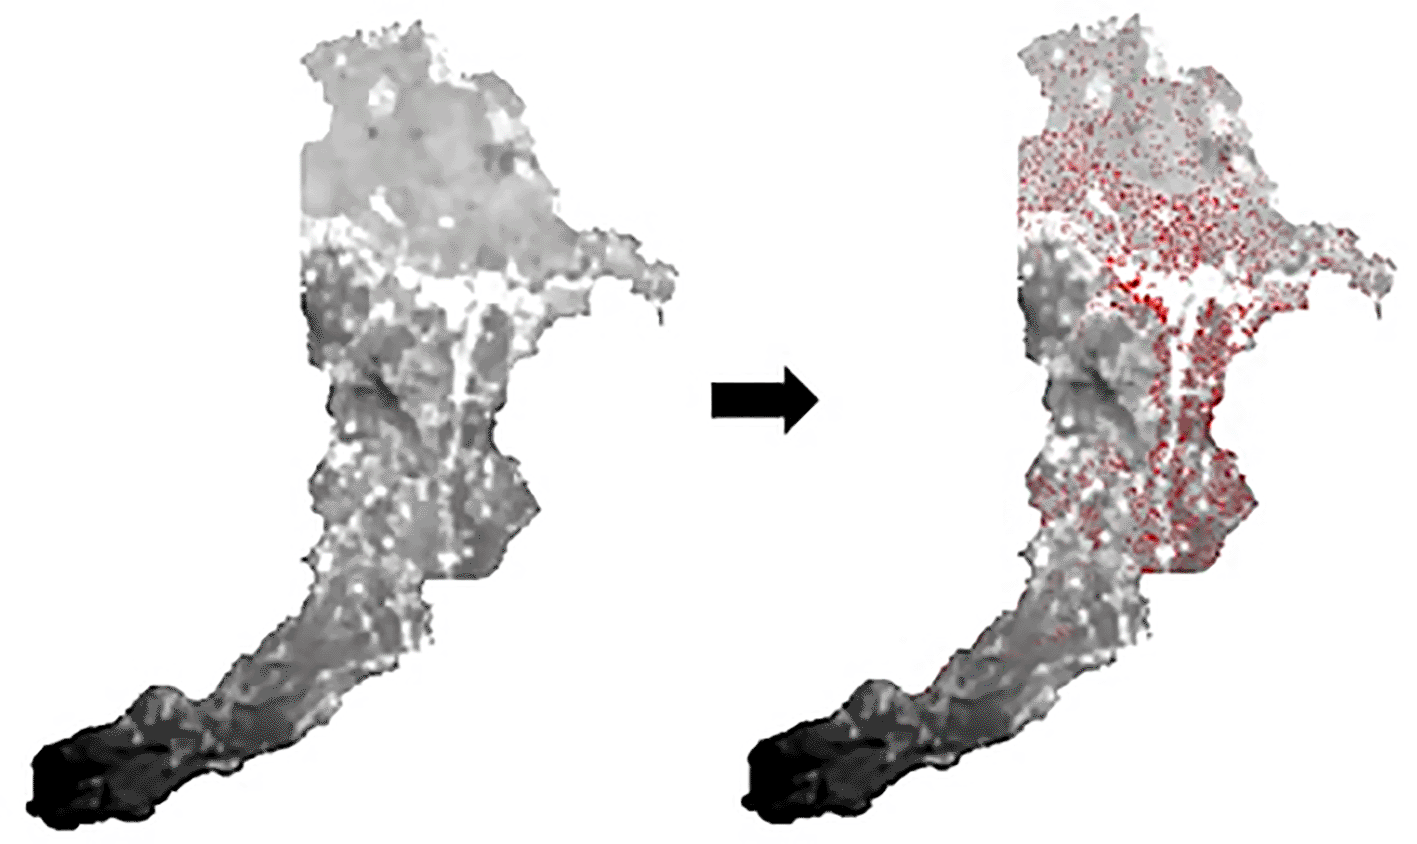
The sampling process on ENVI was done using the Generate Random Sample Tool Using Ground Truth ROIs by creating an ROI file specifically for the paddy crop area to be sampled. ROI files can be created in the Band Threshold to ROI tool by marking all pixels. After the ROI file was available, the next step was to determine the required sample size using the Cochran formula (Cochran, 2007). The sampling technique used in ENVI was stratified random sampling. Figure 4 shows the appearance of the sample pixel dots on the L8 imagery data.
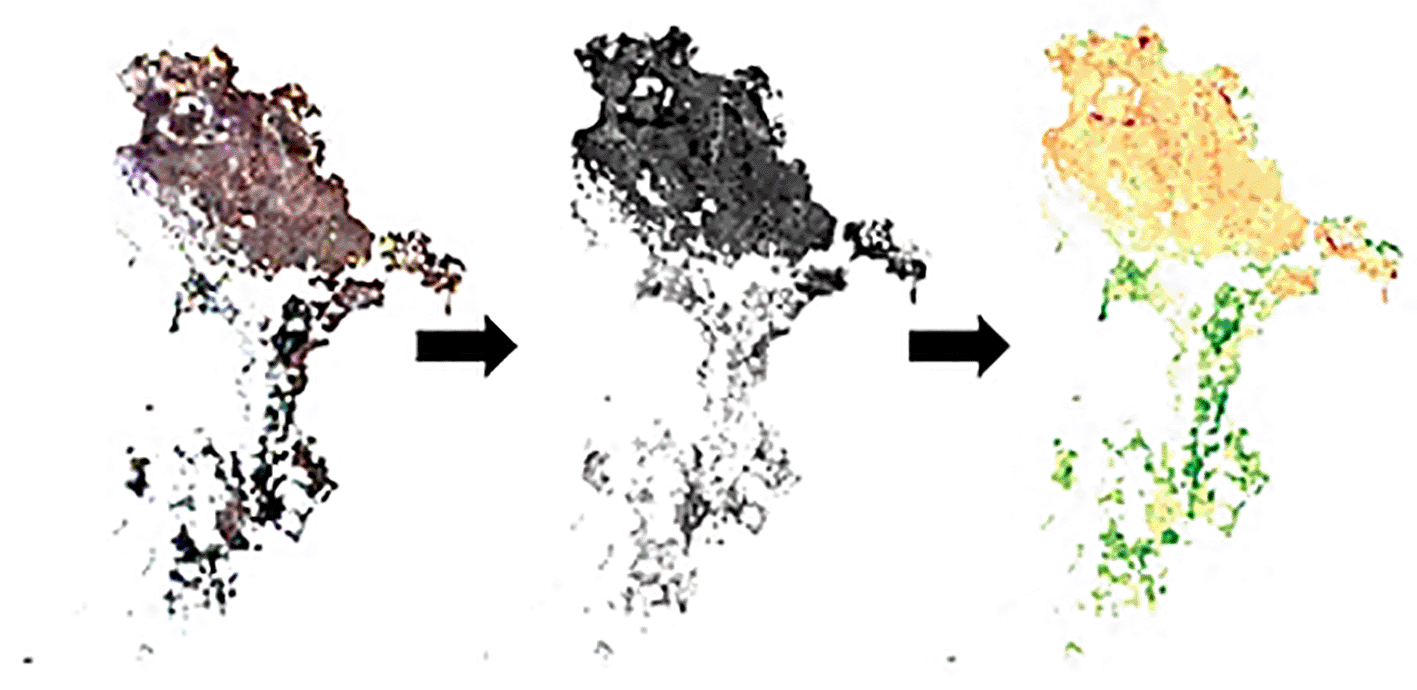
NDVI vegetation index was calculated after the imagery data was calibrated and corrected. Calculations were done by the NDVI tool in ENVI by selecting the type of OLI sensor (Landsat 8) with the red channel band (number four) and the near-infrared channel band (number five). Figure 5 is the difference in the appearance of the image before and after being transformed into NDVI. The image on the right is the result of adding a colour slice so that the difference between high NDVI values and low NDVI values can be seen properly.
After the NDVI was obtained within a predetermined period, the next step was to plot the NDVI value into a parabolic graph. It represents one harvest season for the paddy crop. The NDVI value taken from one harvest season is the biggest.
The temperature of the earth’s surface can be obtained by performing the Brightness Temperature radiometric calibration on the thermal band of the L8 satellite imagery. After calibration, the pixel values in the image represent Kelvin units. To convert Kelvin to Celsius, we can use the Band Math tool and enter the formula below:
After the satellite imagery data was processed using ENVI, the next step was to combine the remote sensing data with the yield of lowland paddy crop reported by BPS-Statistics Indonesia. The report from BPS-Statistics Indonesia is a report for each district per year in one file. The data available in each report file is the yield of lowland paddy crop and the area of planted paddy crop for each village. Data downloaded from BPS-Statistics Indonesia is required to obtain the percentage of paddy crop yield in each period.
Table 4 is the input data as a result of combining remote sensing data with lowland paddy yield reported for several different harvest seasons. The NDVI column, total pixels, and temperature are data obtained from remote sensing data collection, while the period column, planted area, and paddy crop yield are data obtained from the BPS-Statistics Indonesia.
The total pixels (population) are included in Table 4, but the sample size is not. This is because the total pixels already represent the sample value itself. In Table 4 there is also a period column that indicates the period or sub round for taking NDVI values. P1 indicates January – April, P2 indicates May – August, and P3 indicates September – October. This period column represents the date of the image data used to obtain the NDVI value. The column for the planted area is in hectares and the column for production is in quintal units, obtained from reports on food crop yield in Bandung.
Remote sensing and loss function data were required to build the computational model. In doing so, the model also required several parameters, e.g. the number of Regression Trees to be created (estimators), learning rate, the maximum value of the Regression Tree depth (maximum depth), and the minimum amount of data obtained by a node in the Regression Tree for data splitting.
Scenarios were performed to compare the accuracy and speed of computations. In the scenario of comparing the accuracy, the root mean squared error (RMSE) was used to evaluate the experimental results. RMSE is the standard deviation for the residual or the resulting predictive error. RMSE shows how much residual dispersion occurs (Barnston, 1992). RMSE is formulated as follows:
Where:
index of predicted data
index of observed data
predicted data
observed data
number of samples
All parameters may influence the RMSE value in the scenario of comparing the accuracy. The larger the size and number of regression trees built, the greater the opportunity for the model to study the data. The greater the learning rate value used, the shrinkage of the predicted results for each Regression Tree will also be greater. Therefore, all of the parameters in the RMSE value testing scenario were involved.
The computation speed of the Gradient Boosting Regressor algorithm depends on the number and size of the Regression Tree being built. Therefore, the computation speed can be influenced by several parameters, e.g. estimators, minimum samples split, and maximum depth.
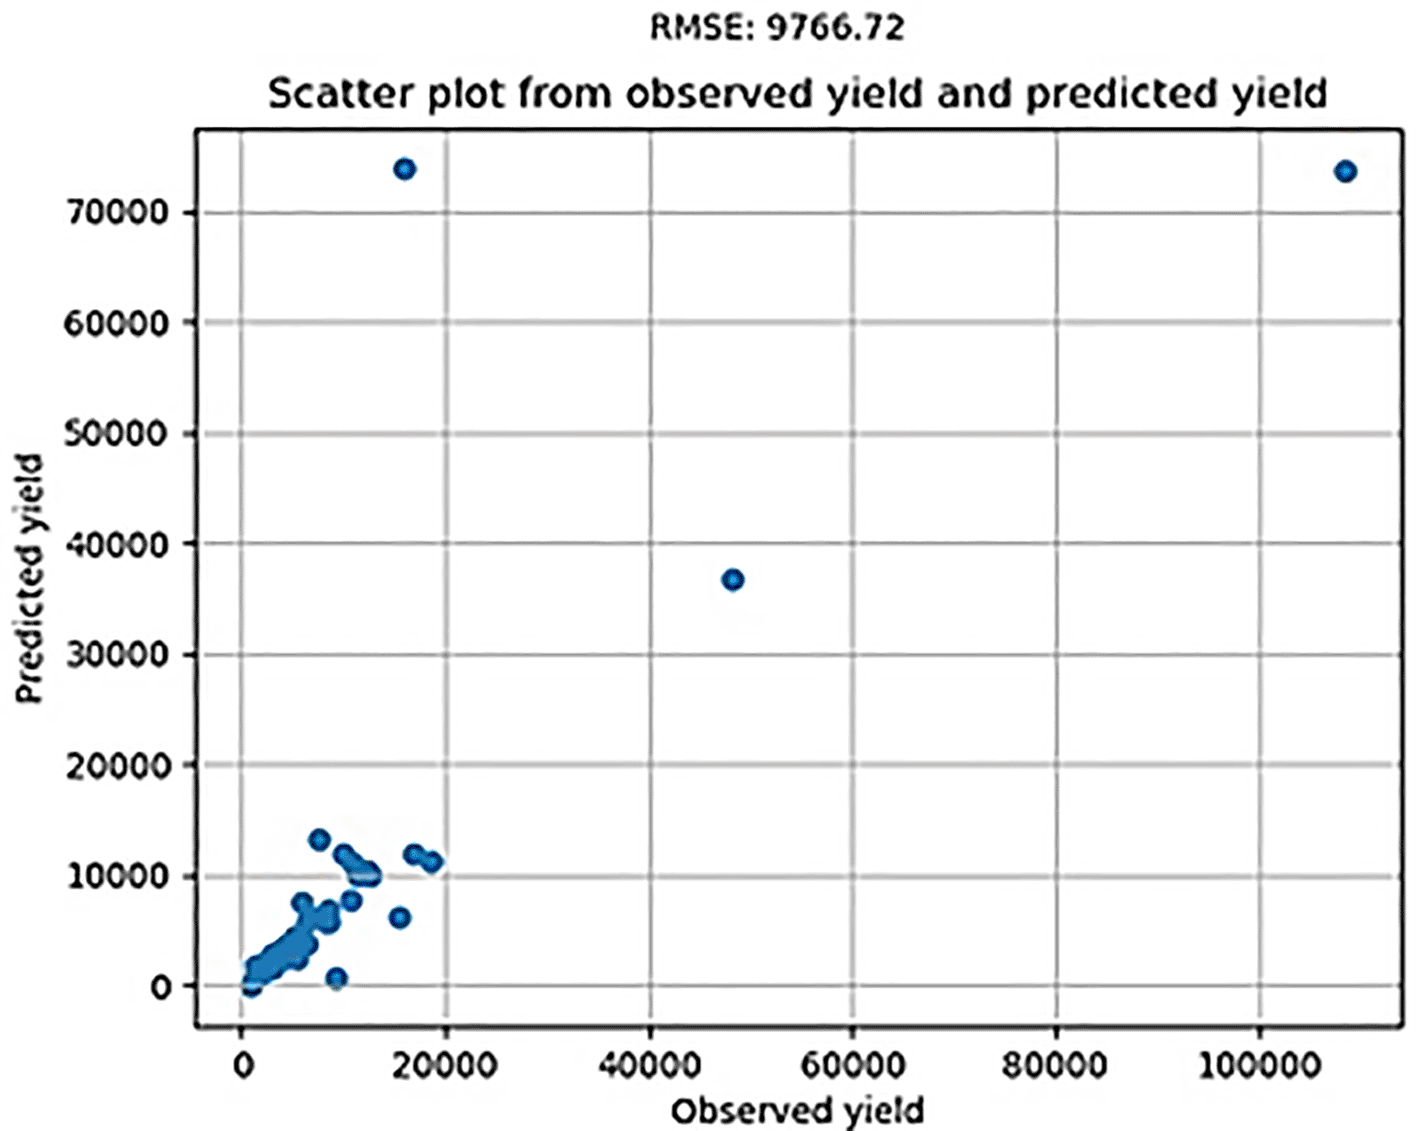
The output of the program is a file in the comma-separated value (CSV) format which contains data on the prediction of lowland paddy crop yield based on the data input at the beginning of the program. Table 5 is the output of the program displayed in the CSV file with an estimator parameter of 2000, a learning rate of 0,001, a maximum depth tree of 4, and minimum samples split of 2. The scatter plot and RMSE value are shown in Figure 6.
To test the effect of parameters on the RMSE value, a model was built based on several scenarios. The scenario in Table 6 is a combination of various parameters. The parameter estimator was tested at the values of 200, 500, 1000, 1500, and 2000. The learning rate parameters were tested at values of 0.1, 0.01, and 0.001. The minimum parameters of samples split were tested at values 2 and 10. The maximum depth parameters were tested at values 4, 6, and 8.
From Table 6, we could see that the value of scenario number 75 produces the best RMSE value. From this experiment, the scenario with the best parameter combination is an estimator of 2000, a learning rate of 0.001, minimum samples split of 2, and a maximum depth of 4.
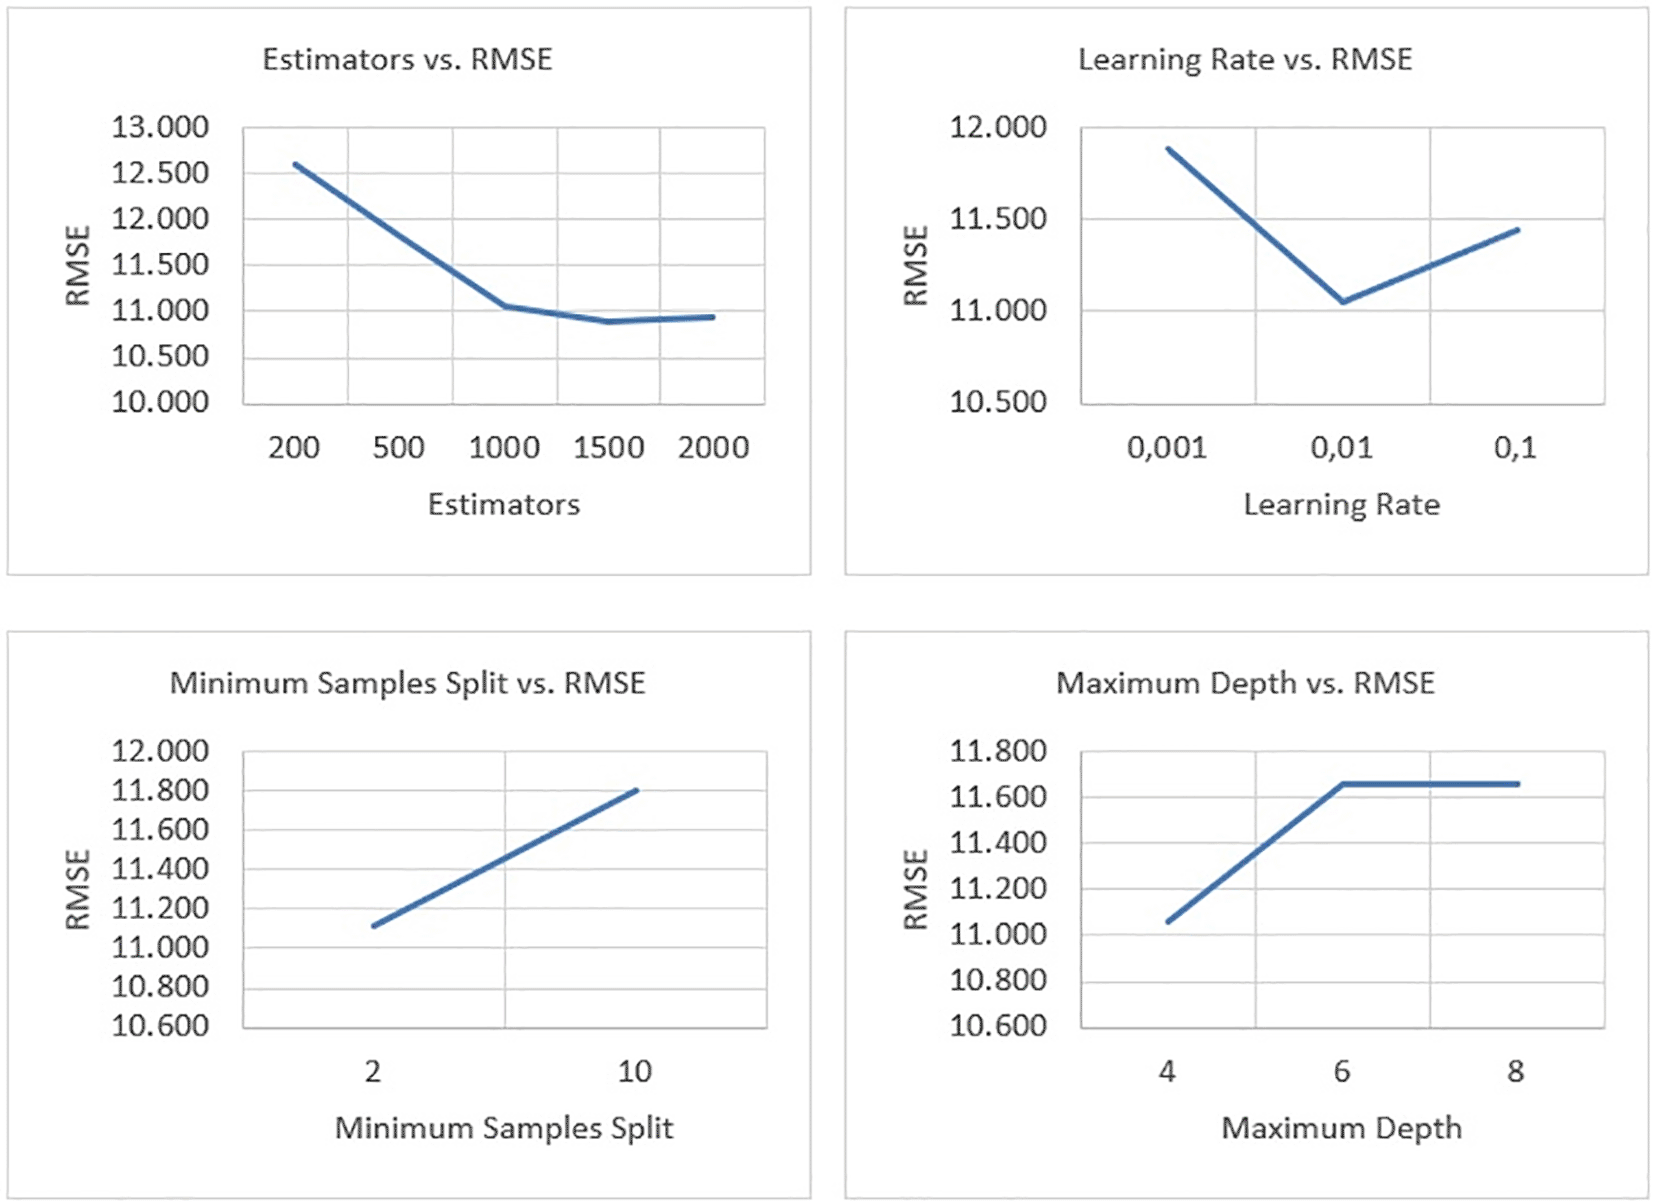
Figure 7 contains graphs showing the average RMSE value for each estimator, learning rate, minimum samples split, and maximum depth. The RMSE value tends to be constant in the estimator with a value of 1000 to 2000. The value of the estimator with the best RMSE was 1500. The value of the learning rate with the best RMSE was 0.01. The minimum value of samples split with the best RMSE was 2. The maximum depth value with the best RMSE was 4.
According to the experiments, it can be seen that the developed application was able to predict crop yields with reasonable accuracy. This result can be compared with research conducted by Petersen (2018). This study predicts production 2-4 months before harvest time based on MODIS satellite imagery. The model was created and validated using satellite imagery of Illinois, United States of America by calculating the linear fit between production and vegetation index. The model is made by looking for a linear regression relationship between the average vegetation index and the vegetation index anomaly with production. The model made is able to predict the production of corn, soybeans, and sorghum, respectively, the median error is 5.7%, 5.8%, and 22%. The next model is applied in several countries on the African continent by making predictions for 2-4 months before harvest time. The result is that the prediction has an error of less than 5%.
After performing some experiments, we came to several conclusions that were in line with the research objectives as follows: (i) This research succeeded in conducting a regression analysis between the NDVI vegetation index and rice production using the Gradient Boosting Regressor algorithm with five main stages. The stages are remote sensing data collecting, data preprocessing, data standardization, model training, and model testing; (ii) This research succeeded in designing a computational model to identify the yield of lowland paddy crops based on the regression relationship in the Gradient Boosting Regressor algorithm between the vegetation index and its yield; and (iii) This study conducted 90 experiments divided into two main scenarios. From the results and discussions, the authors conclude that the estimator parameters, learning rate, minimum samples split, and maximum depth used have different contributions to the accuracy and speed of computation in the computational model to predict the yield of lowland paddy crops.
Open Science Framework: Underlying data for ‘Remote sensing and machine learning for yield prediction of lowland paddy crops’, https://doi.org/10.17605/OSF.IO/P9CY3 (Riza et al., 2022a).
This project contains the following underlying data:
• Data NDVI with ENVI.zip: Data containing vegetation index (i.e., NDVI)
• Data Portal Geospasial Indonesia.zip: The Indonesian topographical map was used to determine the boundaries of the paddy field area in Bandung.
• Dataset Final.xlsx
Data are available under the terms of the Creative Commons Zero “No rights reserved” data waiver (CC0 1.0 Public domain dedication).
Landsat 8 (L8) satellite imagery were downloaded from the EarthExplorer website. An Indonesian topographical map was used to determine the boundaries of the paddy field area in Bandung and is available from the Indonesia Geospatial Portal). Lowland rice yield data was obtained from reports published by BPS-Statistics Indonesia of Bandung:
• Ciparay City: Ciparay, 2013; Ciparay, 2014; Ciparay, 2015.
• Cikancung City:: Cikancung, 2013; Cikancung, 2014; Cikancung, 2015.
• Paseh City: Paseh, 2013; Paseh, 2014; Paseh, 2015.
• Majalaya City: Majalaya, 2013; Majalaya, 2014.
Source code available from: https://github.com/lala-s-riza/Remote-sensing-and-machine-learning-for-yield-prediction-of-lowland-paddy-crops.git
Archived source code at time of publication: https://doi.org/10.5281/zenodo.6459715 (Riza et al., 2022b).
License: GNU General Public License (GPL-2.0)
| Views | Downloads | |
|---|---|---|
| F1000Research | - | - |
|
PubMed Central
Data from PMC are received and updated monthly.
|
- | - |
Provide sufficient details of any financial or non-financial competing interests to enable users to assess whether your comments might lead a reasonable person to question your impartiality. Consider the following examples, but note that this is not an exhaustive list:
Sign up for content alerts and receive a weekly or monthly email with all newly published articles
Already registered? Sign in
The email address should be the one you originally registered with F1000.
You registered with F1000 via Google, so we cannot reset your password.
To sign in, please click here.
If you still need help with your Google account password, please click here.
You registered with F1000 via Facebook, so we cannot reset your password.
To sign in, please click here.
If you still need help with your Facebook account password, please click here.
If your email address is registered with us, we will email you instructions to reset your password.
If you think you should have received this email but it has not arrived, please check your spam filters and/or contact for further assistance.
Comments on this article Comments (0)