Keywords
climate change; smart adaptive building envelope; indoor environmental quality.
climate change; smart adaptive building envelope; indoor environmental quality.
Building envelopes play an essential role in protecting internal spaces whilst facilitating climate control. These must respond to external forces, whether tangible forces like climate and environmental factors or intangible forces such as social factors and cultural heritage. Solutions to these external forces have been excessively imported to Egypt from western countries due to socio-political changes and swift development. Despite the difference in the environmental and cultural conditions, educational buildings in Egypt have adopted the fully glazed western building design. During the 20th century, heating, ventilation and air conditioning (HVAC) systems and artificial light were used to provide thermal comfort and lighting to buildings,1 which later developed into what is now known as “the international style”. The international style is characterized by its uniform design regardless of the building location, a fully glazed geometric shape without any form of aesthetics or ornamentation.2 This approach diluted the local identity; buildings in Cairo now look similar to those in Moscow or Beijing. The building envelope no longer reflects the identity, context or surrounding climatic conditions.
The paper evaluates the impact of climate change on coastal cities; in particular, Alexandria, Egypt. It then addresses the relationship between the climate and the built environment, building performance and indoor environmental quality (IEQ); identifying the existing strategies to oppose climate change on different scales, impacts of climate change on building performance and IEQ factors. An overview of smart adaptive building envelopes (SABEs) is then provided as a potential passive solution to overcome the effects of climate change on educational buildings, and an educational building case study is selected, Arab Academy of Science and Technology (AAST), Al-Alamein campus in Alexandria, Egypt. Thermal, light and energy simulations are run to analyze the existing building design challenges and assess SABE performance as a potential solution. Finally, the results are discussed, the challenges and limitations of the paper are addressed, and a set of guidelines on the international and local level are recommended.
Buildings are responsible for 30 to 40% of the global energy demand.3 Disregard for Egypt’s building context, location, and climate is the reason for undesirable building performance in this regard. Occupants’ needs can be often ignored, in terms of well-being and productivity. The primary energy demands of educational buildings are attributed to lighting and ventilation. Since building envelopes are the barrier between the internal and external environment, controlling natural lighting and ventilation would be ideal in order to apply sustainable design strategies to achieve the optimum levels of IEQ, comfort, well-being, health and productivity. With Egypt’s recent development and economic growth, the western aesthetic approach of fully glazed building envelopes has been mimicked in a misplaced environmental context and cultural background. It causes enormous energy demand accompanied by energy shortages.4 This approach has added to the economic crisis. Thus, Egypt has urged stakeholders to use new technologies to reduce energy consumption. This paper aims to address the advantages of using SABEs in educational buildings using simulation-based comparative methodology, to compare between building performance with and without using SABEs. SABEs respond to the local environment and climatic challenges, to provide thermal comfort and natural daylight with the least energy consumption.
Climate change impact on Alexandria
Recently, coastal cities have been vulnerable due to their location; significant events of flooding, sea-level rise or unexpected weather patterns can drastically impact infrastructure, the construction of buildings, transportation networks, drainage systems, and communication networks. These drastic events will affect not only coastal cities but also coastal communities. More than 360 million inhabitants of coastal cities which are 10m above sea level are prone to natural catastrophes that threaten their lives, like storm surges and floods, due to climate change.5
Alexandria is already facing the impacts of climate change and is expected to face serious challenges in the future. It is the second-largest city in Egypt. The population is in continuous increase; currently it is 5,449,817 and growing by 1.9% every year. The city of Alexandria has the largest harbor in Egypt. Alexandria has a moderate climate as a result of its location. The climate in Alexandria is classified as BWh by the Köppen-Geiger system,6 with subtropical deserts, moderate winters with light rainfall and dry summers.7 During the past few years, Alexandria has witnessed a decrease in temperature accompanied by rain during winter, and significant heat waves with a high percentage of humidity during summer.8 The average annual temperature of Alexandria is 20.8 °C, a continuous increase as it was 14 °C in 2018.7 The average yearly precipitation is 181 mm.
External climate and built environment
Since it is quite challenging to withhold climate change phenomena,9 global efforts are now focused on developing sustainable methods and strategies to anticipate, assess, and control buildings’ performance under the foreseen consequences of climate change.10 Buildings act as a climate modifier since they separate the indoor spaces from the external climate change events. Buildings and climate influence each other; they have a direct interrelationship.11 Buildings contribute to climate change due to their heavy energy consumption, which also affects the functionality of buildings.12,13 Thus, the sustainable design of buildings is key in overcoming the consequences of climate change by responding to different climatic patterns.
Designing sustainable and resilient buildings has significant potential for greenhouse gases reduction.14 Several factors, however, must be considered to achieve sustainability in the built environment, such as energy efficiency and thermal comfort.15 Strategies for designing sustainable and resilient buildings can broadly be categorized as mitigation strategies and adaptation strategies16 as shown in Figure 1. Mitigation strategies focus on preventing or reducing greenhouse gases to make the impact of climate change less severe. Adaptation strategies, on the other hand, focus on responding and adjusting to the current or the future impacts of climate change. Table 1 shows the difference between mitigation and adaptation strategies in terms of spatial scale, time and sector. Adaptation strategies are further classified into two categories: active and passive.17 Active strategies encompass the efficiency of ventilation technologies and strategies like HVAC. On the other hand, passive responses focus on bio-climatic concepts, for example building orientation, insulation methods and natural ventilation. Passive strategies are used to attain thermal comfort within the interior environment by reducing thermal exchange between the interior and exterior environment. This paper focuses on the passive strategies of sustainable educational buildings to provide the optimum comfort for building users and reduce energy consumption.
Building performance: IEQ
Historically, IEQ did not receive much attention from designers or users than other building-related topics.18 But recently, IEQ has been gaining more attention than ever; it is involved in building design, policymaking, and building regulations. However, IEQ itself is a contested topic due to the multidisciplinary interest in it. As a result, there are several competing definitions, further leading to misinterpretations of what is considered good IEQ for building users.
The objective concept of energy efficiency in combination with subjective ideas of well-being is vital to achieving sustainable buildings. Well-being, health and comfort are defined as perceptual and physical qualities that play a vital role in the everyday experience of architecture and in connecting indoor to outdoor spaces.19 Users’ perception of indoor thermal comfort or discomfort depends on physiological and psychological reactions to the thermal characteristics of a space.20 Therefore, thermal characteristics are interweaved between tangible characteristics and the immaterial dimensions of the built environment.21
The quality of life inside buildings is defined by the IEQ.22 IEQ influences occupants’ comfort, health and productivity.23 However, IEQ is influenced by climatic conditions, occupants’ factors24 and different building-related factors.25 There are four main factors that tackle IEQ: indoor air quality (IAQ), thermal comfort, visual comfort, and acoustic comfort.26 This paper focuses on thermal comfort and visual comfort as follows:
Thermal comfort
Thermal comfort is one of the main parameters that control IEQ. Building occupants have to be thermally comfortable to be optimally productive. Thermal comfort depends on the occupant’s thermal adaptation, influenced by personal factors such as metabolic rate and clothing, and environmental parameters such as solar radiation, humidity, air velocity, and temperature.27 In the case of occupants’ exposure to a sense of thermal discomfort, this leads to increased energy consumption to achieve thermal comfort. Factors that influence thermal characteristics need to be considered during the design phase to achieve optimum thermal comfort. Making early decisions and considering these factors in the early design stage reduce energy consumption save money and time.
Visual comfort
Visual comfort plays a vital role in well-being and productivity, especially in educational buildings.28 Work productivity, performance and satisfaction are affected by visual comfort within workspaces.29 Lighting is a key factor affecting visual comfort, and physical and psychological health is affected by visual discomfort. For instance, insufficient light decreases the ability to see small details clearly.30,31
Visual comfort is an essential quality in educational buildings. Thus, a building’s sources of light (daylight and artificial light) should be considered during the architectural design phase to get a more holistic image32 since it directly impacts well-being, productivity, and satisfaction. Window dimensions, geometry, and glazing control the amount of natural light inside spaces. Artificial light is as crucial as natural light to ensure visual comfort throughout the day. Natural light is important for creating better IEQ. However, glare can occur due to big windows that allow excessive light. Glare can cause significant visual and health problems.33 The acceptable range of glare is between 500-1500 cd/m2.
“Adaptivity/adaptation” is to understand, interpret, and interact due to alterations in the surrounding context and environment. The contextual and environmental changes are described by dynamism. Meanwhile, contemporary designs are often based on a set of static factors that hardly can adapt to dynamic changes, such as opening size and building structure. Environmental and climatic changes directly impact people’s daily lives and needs. Thus, the paradigm of designing a performance system has to change to attain a higher level of climatic response. Responding to dynamic environmental variables like solar patterns and wind variation in the static structure of conventional buildings creates disengagement between the building’s structure and its surrounding environment. High-performance dynamic adaptive systems must respond to climatic conditions; these systems offer better efficiency and IEQ than static systems.34 Table 2 shows the advantages and disadvantages of SABEs.
For instance, in educational buildings that depend on mechanical air conditioning, there is a gap between the building envelope and its role as an environmental moderator. It also causes insensitivity to the surrounding environment. Sustainable buildings can adapt to the surrounding environment and its changes and take advantage of it. A building envelope is a key component in making the building sustainable, and its material, geometry, thermo-physical and optical properties.35 The majority of existing envelopes are used for heating or cooling purposes, depending on the climate. Adaptive building envelopes improve building energy efficiency by actively changing their thermal and optical properties, using kinetic energy to respond to climatic changes.36
The high-performance adaptive design approach adopts a passive design strategy for building envelope, impacting a building’s energy performance and consumption.37 The application of smart materials in building envelopes plays an important role in creating a sustainable passive design that can cope with environmental changes and offer building users different forms of comfort. The hybrid of adaptive and smart building envelopes achieves the goal of creating a comfortable indoor environment, regardless of the unexpected patterns of weather, with the minimum energy consumption.
SABEs can respond to climatic changes and integrate daylighting, shading and natural ventilation as mentioned in Table 2, which decreases the energy consumed by building operations.34 The building envelope is a significant aesthetic element. It can motivate architects and designers to settle for high-performance envelopes that will attract stakeholders and clients due to the design flexibility in using different technologies and materials to create varied visual features. SABEs are described as envelopes that can change their properties as a response to the surrounding environment and climatic changes, as they control the different parameters of the building envelope.38 The changes can occur in various forms, such as introducing airflow or chemical change in a material—the SABE helps create a better indoor environment to boost well-being and achieve the optimum IEQ for building occupants.
The paper focuses on educational buildings in coastal cities, choosing the AAST Al Alamein campus’s main building in Al-Alamein, Alexandria, Egypt. The methodology is simulation-based; it is divided into two steps, as shown in Figure 2. Step one is pre-study, for problem identification (result 1A) and solution identification (result 1B); step two is assessing the proposed outcomes of step one and simulation of the proposed SABE design. Comparing the existing results to the proposed results concludes a set of guidelines and decision support tools for designing SABEs for educational buildings in coastal cities (result 1C).
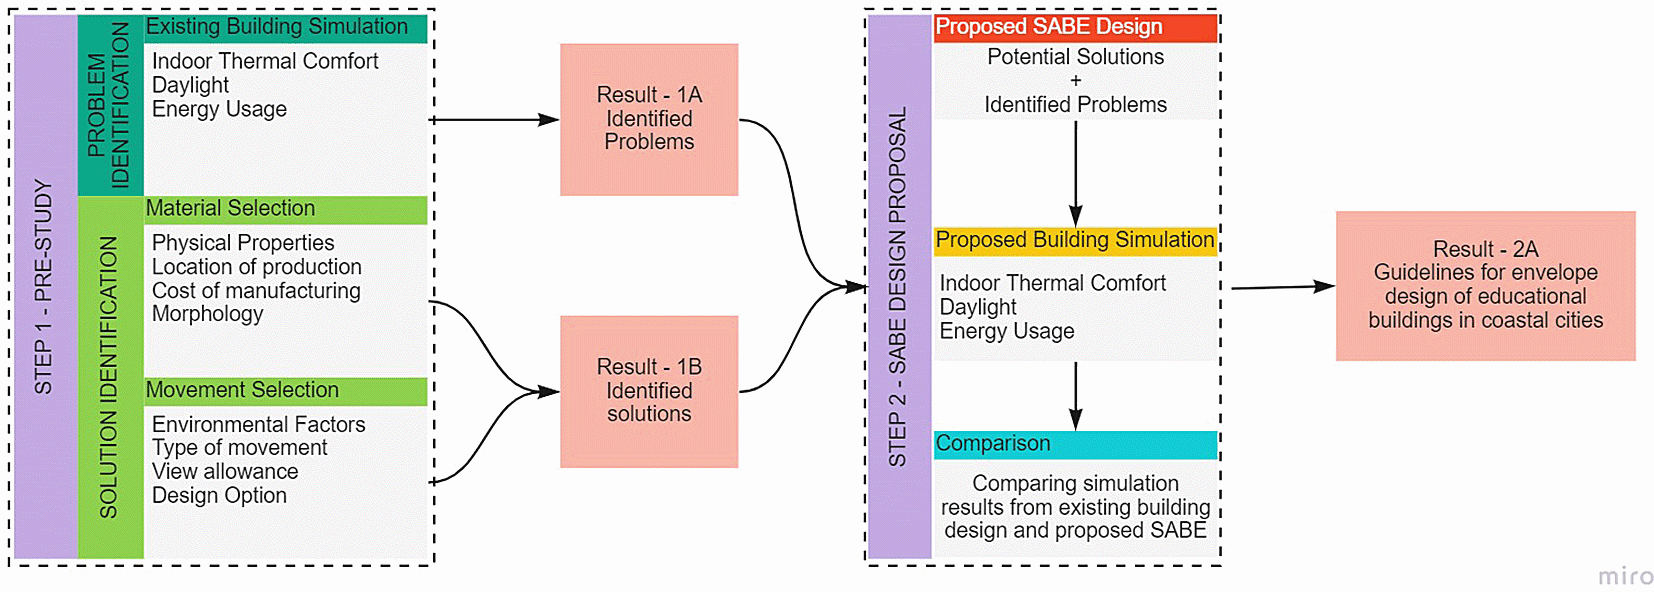
The pre-study step of the methodology aims to identify the problems facing the existing design of the studied building (AAST Al-Alamein campus) due to climatic changes. This step is divided into three parts as follows.
Problem identification: existing building simulation
This part analyzes the building performance to identify the problems encountered by the building.
The energy simulations for this project are conducted using an energy simulation engine called OpenStudio 3.0.1 by NREL.39 The 3d modelling software Rhino 7.0 educational version40 is used along with the Grasshopper 1.0.0 tool41 to perform a parametric analysis of the existing and proposed SABE solutions. Blender is a free software that can work with Grasshopper the same way as Rhino using the same Grasshopper script. Honeybee 1.142 is a wrapper for OpenStudio that enables parametric energy simulation within Rhino as a plug-in. As shown in Figure 3, all the simulation results in the following section are produced via Honeybee. The simulation is a 3-step process to generate the results.
1. Zoning and 3D modelling: a thermal model is created based on auto computer-aided design (CAD) drawings provided by the AAST to represent the existing building accurately. Zoning is an important step in the energy modelling process. It captures the real use cases of each room in the building; the energy consumption and comfort requirements in classrooms are different from those in a mechanical room. In addition to the zoning, details about the existing building envelope are also considered using the auto CAD drawing; the windows and atrium’s location, type and size are extracted.
2. Material: existing materials of the building, construction type and weather conditions. The construction type assigned for the building is an ‘American Society of Heating, Refrigerating and Air-Conditioning Engineers (ASHRAE) zone 2 hot climate concrete construction’.
3. Loads and schedule: loads are assigned used occupancy schedules. The purpose of the building is set as ‘school’, specific functions are categorized, like classrooms, corridors and offices. Assigning the occupancy serves multiple purposes:
• Defines the functioning energy requirement of each space.
• Defines the schedule (time, dates and holidays) of occupancy of the building.
• Makes appropriate assumptions for the number of people present inside the rooms.
• Regulates and controls windows (open/closed), the lighting (on/off), the HVAC (on/off/and temperature control) and equipment loads such as computers and lights.
• Regulates the body heat given up by each person and the ventilation requirements for each person considering their zone.
4-Results: building simulations are used in the AAST Al-Alamein campus with a focus on three aspects as follows:
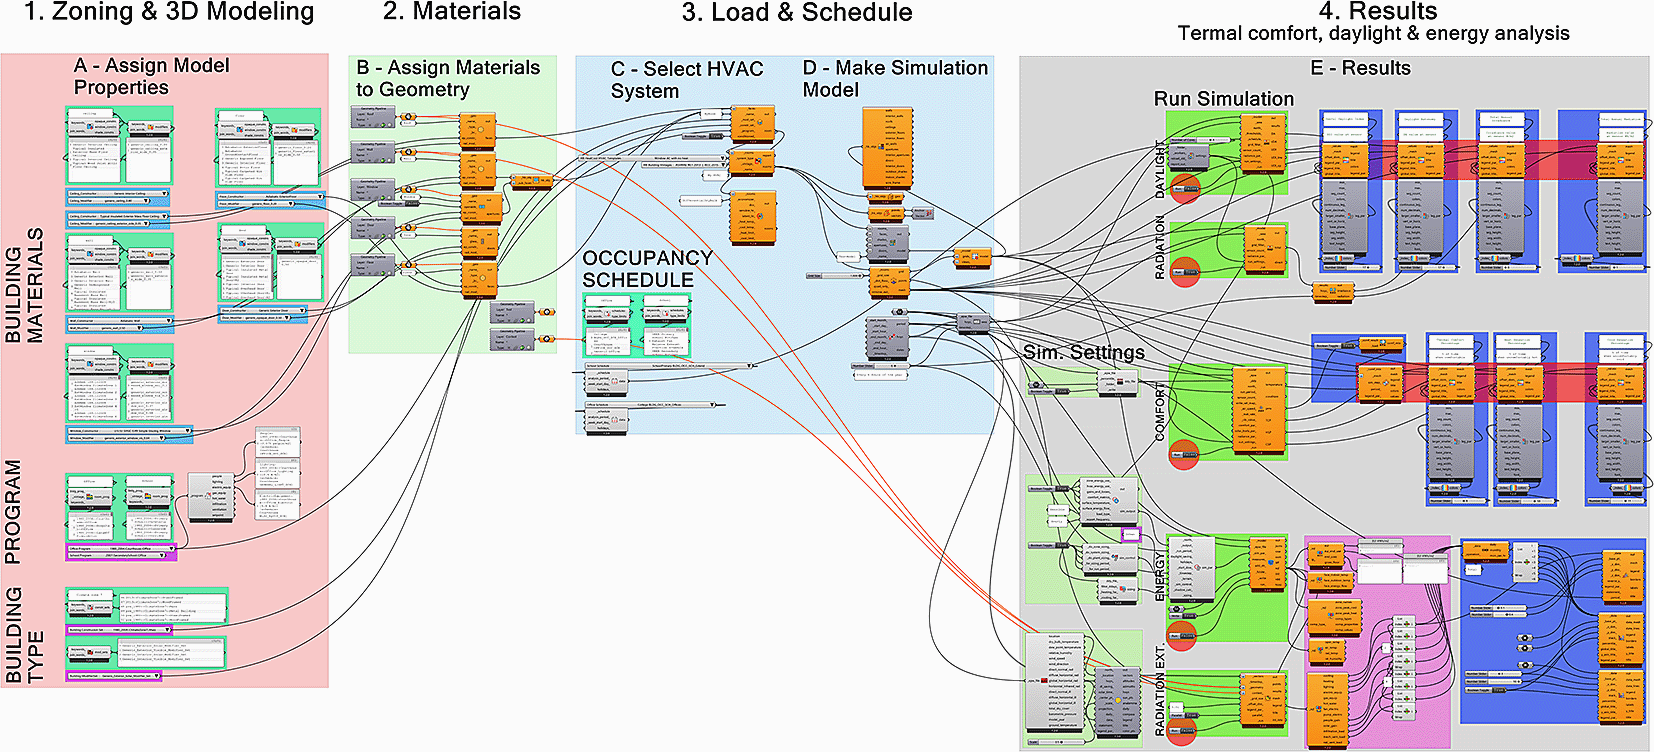
(2) Material selection. (3) Loads and schedule. (4) Results.
Indoor thermal comfort
• This component requires input like outdoor temperature, wind speed and mean radiant temperature.
• Model: a Honeybee Model for which adaptive comfort is mapped. The environmental parameters are set based on the location of the AAST campus in Al-Alamein.
• Weather data: the path to an EPW weather file is used for the comfort map simulation. Weather data (.EPW file) for the Al-Dabaa area was the closest identified weather data to the building’s location.
• Airspeed: a single number for airspeed in m/s or an hourly data collection of airspeeds that align with the input run period. Airspeed is used for all indoor comfort evaluations.
• Comfort parameters: optional comfort parameters from the “LB Adaptive Comfort Parameters” component specify the criteria under which conditions are considered acceptable/comfortable. The default will use ASHRAE-55 adaptive comfort criteria.
• Solar body parameters: optional solar body parameters from the “LB Solar Body Parameters”. The default assumed average skin/clothing absorptivity, and a human subject always has their back to the sun at a 45-degree angle.
The output of this component is thermal comfort percentage, operative temperature –summer and operative temperature- winter, and predicted mean value (PMV).
Daylight
This component requires input such as:
• Annual radiance: a list of annual radiance configuration files from the “Honeybee (HB) Annual Daylight” which includes predefined components such as weather file, test points for measuring daylight and the sun-up hours, while setting the complicated components as default.
• Occupancy Schedule: an annual occupancy schedule. It can be the identifier of the energy schedule in schools and universities; a schedule from 9 AM to 5 PM on weekdays is used. It identifies weekends and vacations.
• Threshold: threshold for daylight autonomy in lux, set to 300.
• Minimum and maximum: the minimum and maximum values for useful daylight illuminance are set to 100-3000.
The output of this component is useful daylight illuminance (UDI) and glare analysis; amongst other outputs, daylight autonomy (DA) and continuous daylight autonomy (cDA). DA and cDA are the previous version of the UDI method and provide no additional data. Hence, they are not considered in this study.
Energy usage
• Holidays: all holidays, including the weekends, summer and winter holidays, are identified.
• Start day of the week: assigned as Sunday.
• Start hour: when users start occupying the building.
• End hour: the time when occupants leave the building.
• Terrain: identifying the surroundings of the building (two buildings on the east and west sides of the building) to determine the wind speed around the studied building.
• Monthly ground temperature: a list of 12 monthly ground temperatures. The temperature data is imported via the EPW file.
The outputs of this component are a data tree with all of the building-wide energy balance terms; normalized energy balance is the one chosen as the normalized values make the energy consumption results comparable.
Solution identification: material selection
SABEs are claimed to be a solution for achieving optimum IEQ and reducing energy consumption. However, a SABE is a hybrid, incorporating smart materials in adaptive envelopes. There are different types of smart materials, each has a unique set of factors which are:
• Physical properties (response factors).
• Morphology.
• Cost of manufacturing.
• Location of production.
The factors of adaptation, location of the building and cost budget are the decision support tool for choosing the right smart material for the building envelope.
Solution identification: movement selection
The movement of the building envelope is another variable that is selected based on a set of factors as follows:
These factors are also part of the decision support tool to select the right movement of the building envelope.
The purpose of step two is to apply the identified solution (material and movement of SABEs) to assess the building performance by simulating indoor thermal comfort, daylight and energy usage. Comparing the existing building results and the proposed design serves to confirm or disprove the hypothesis that SABEs can enhance IEQ for occupants and reduce energy consumption. This step is divided into three parts as follows:
Proposed SABE design
The two results from the previous step, identifying the problems and solutions, are used to inform the design of the hypothetical SABE. Identifying the problem allows the proposed design to be specific to the site and its context, whereas identifying the solutions ensures that the SABE is suitable for the building theoretically and feasible practically.
Proposed building simulation
Simulations analyze the indoor thermal comfort, daylight and energy usage of the building with the proposed SABE design; to evaluate the performance of SABEs.
Comparison: existing vs proposed
Comparing the existing design results to the proposed building performance in terms of indoor thermal comfort, daylight and energy usage gives an idea of how effective the SABE is in addressing the problems identified in result 1A. Hence, ensuring that the decision support tool functions as intended.
Indoor thermal comfort
The indoor thermal comfort component analyzes the adaptive comfort for building users. Building occupants adapt themselves to the monthly mean temperature; occupants would feel comfortable if the building temperature is close to the monthly mean temperature, above 10 °C and below 33.5 °C.
Thermal comfort percentage
Thermal comfort percentage is the annual percentage of time during the building’s active occupancy that occupants feel thermal comfort. The comfort percentage is determined using ASHRAE-55, the adaptive comfort criteria and the metabolic rate for the occupants performing daily activities according to a schedule. The results of the simulation for the existing AAST Al-Alamein building indicate the following44:
• The atrium of the building has the worst performance,
• This is followed by zones closer to the windows in the southern, eastern and western sides of the building.
• The low percentage of thermal comfort along the windows is due to heat gain into zones via the glass windows, which must be addressed.
• The internal zones (zones with no external windows) are reasonably comfortable, whereas the corridors with few windows are the most comfortable.
The atrium serves as a transitional space for circulation and special events; in comparison, students and teachers spend most of their active hours in classrooms and internal zones.
Operative temperature
Operative temperature is the calculated temperature of each grid point in the simulation model. The analysis period selected is for two key hours: the summer solstice (21st of June from 13:00 to 14:00) and the winter solstice (21st of December from 13:00 to 14:00). These hours are selected to present the shortest and longest days representing the highest and lowest operative temperature, respectively.
• The zones along the west and south of the buildings experience heat.
• The southern rooms are exposed to more intense heat.
• The rooms adjacent to the north and south of the atrium are affected by heat.
Predicted mean value (PMV)
PMV is the prediction index value of a group of occupants on their thermal sensation scale; the scale has seven points. Thermal equilibrium is achieved when the heat loss is equivalent to internal heat production. The heat balance is influenced by personal factors and environmental parameters, such as metabolic rate, clothing and airspeed, temperature. Personal factors are identified based on the material selection, load and schedule steps. Simulation runs calculating PMV during the summer solstice (21st of June from 13:00 to 14:00) and winter solstice (21st of December from 13:00 to 14:00). The result of the simulation shows the following:
• Building occupants feel slightly warm on the eastern side and feel hot closer to the southern and western windows of the building during the summer.
• Occupants feel neutral in the inner rooms of the building, slightly cool in the south room and cool in the rest of the building during winter.
• In contrast to the summer, the heat by the windows in the south is more noticeable in the winter and has more spread.
• No neutral PMV is achieved, which means that none of the occupants are thermally comfortable during these seasons of the year, other than the inner rooms in winter.
Daylight
Daylight analysis calculates the quantity and quality of daylight within indoor spaces. It analyzes the daylight factor- the ratio between the interior and exterior natural lighting illuminance level.
Useful daylight illuminance (UDI)
UDI is a metric of available daylight in a space, which corresponds to the percentage of occupied time when a target range of illuminances at a point is met by sunlight. Daylight illuminances are set to be desirable between the ranges of 300 to 3000 lux.43
The UDI low-value analysis shows the areas that need artificial lighting, approximately 70% of the whole building, as shown in Figure 4(a). On the other hand, The UDI high-value analysis shows the spaces that have natural daylight-as shown in Figure 4(b). However, some of them have a high intensity of natural sunlight that may cause discomfort to the building occupants.

(a) Existing design; (b) Proposed smart adaptive building envelope (SABE) design.
The UDI simulation of the existing building design shows the following:
• The rooms facing the west, south and north sides of the buildings require no artificial lighting.
• The rooms on the west side of the building require minimum lighting.
• The corridors and interior rooms show the UDI value 0, which fully requires artificial lighting.
Glare analysis
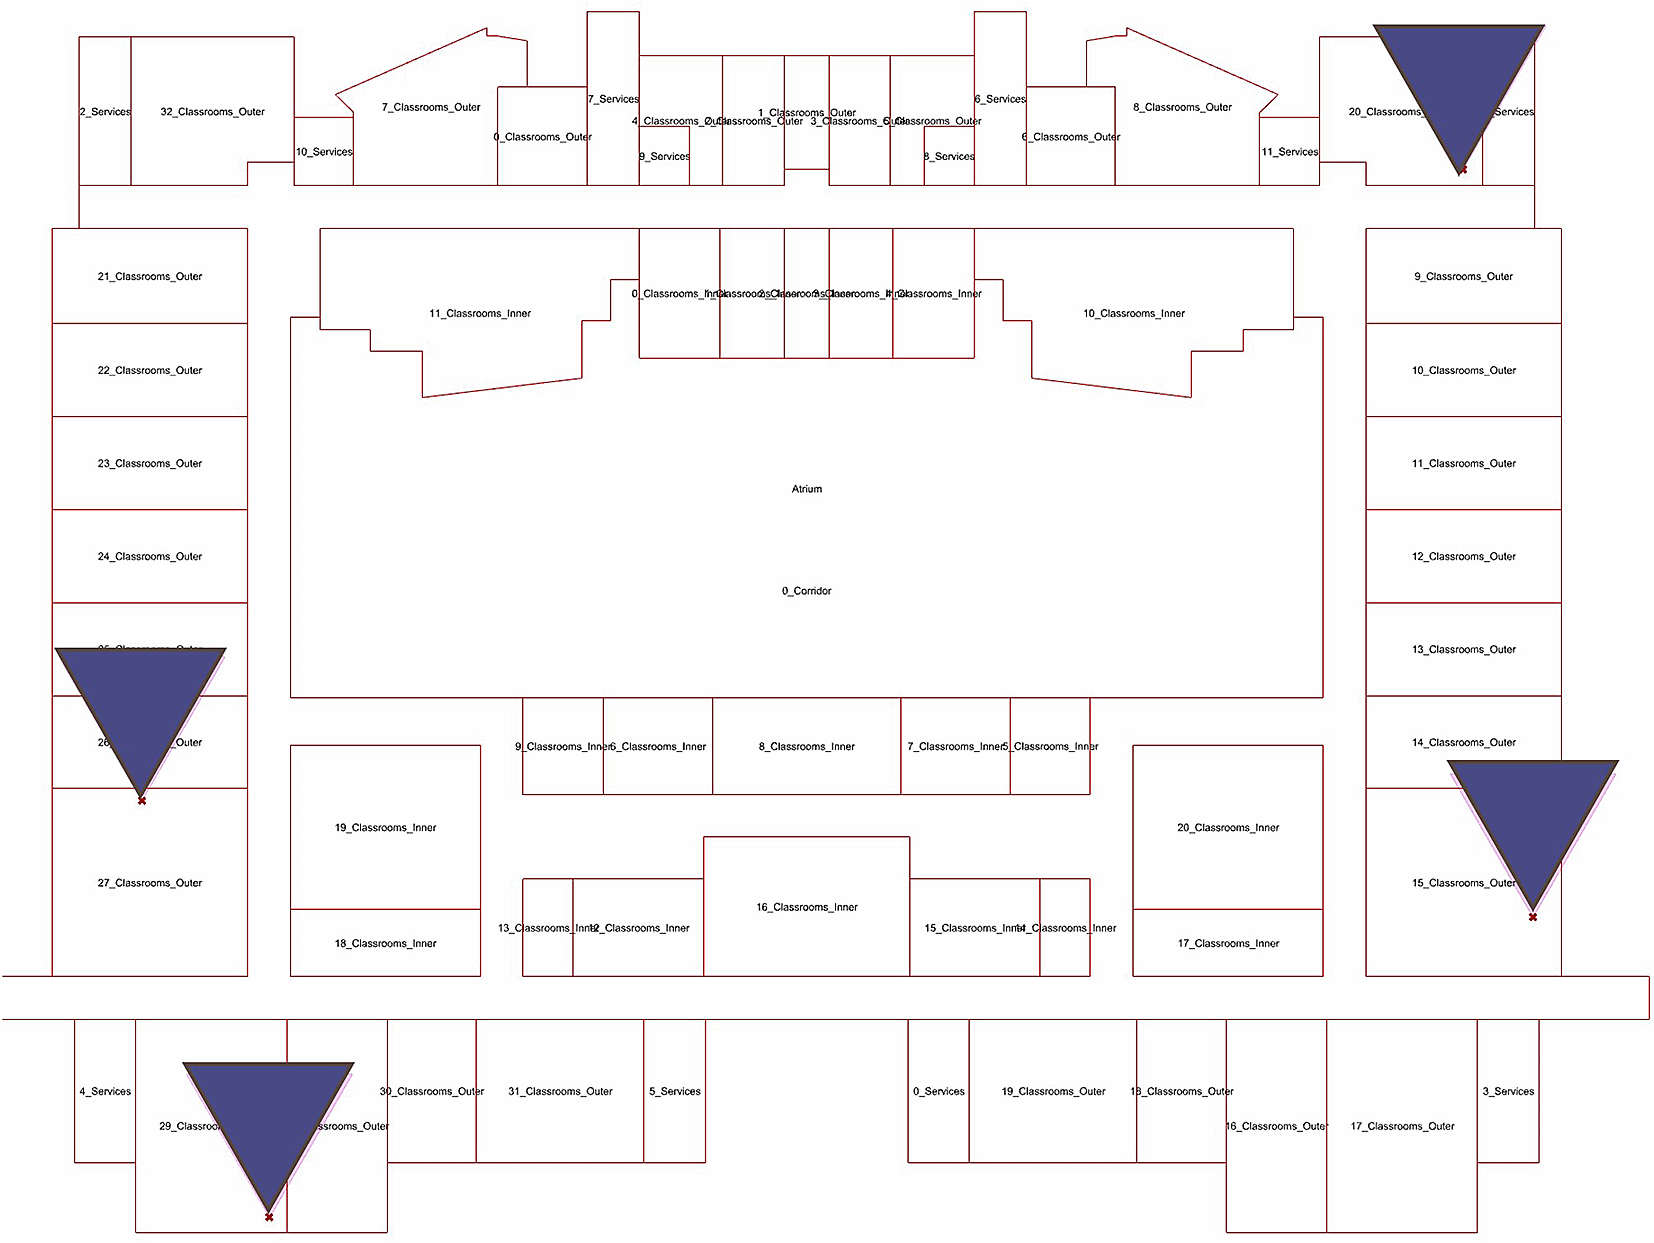
Glare is visual discomfort caused by excessive and uncontrolled light. When direct light shines into the eyes, it is hard for the eyes to adjust to the sudden level change of illumination. Glare problems in educational buildings are significant and can cause occupants health problems. The glare analysis aims to visualize indoor spaces with glare problems. Four classrooms are analyzed to examine the glare situation to measure the glare occurrence in an internal space; the rooms were selected based on the location as shown in Figure 5 and Figure 6; to show the effect of glare on each side of the building; north, south, east and west. The acceptable glare is up to 1500 cd/m2.
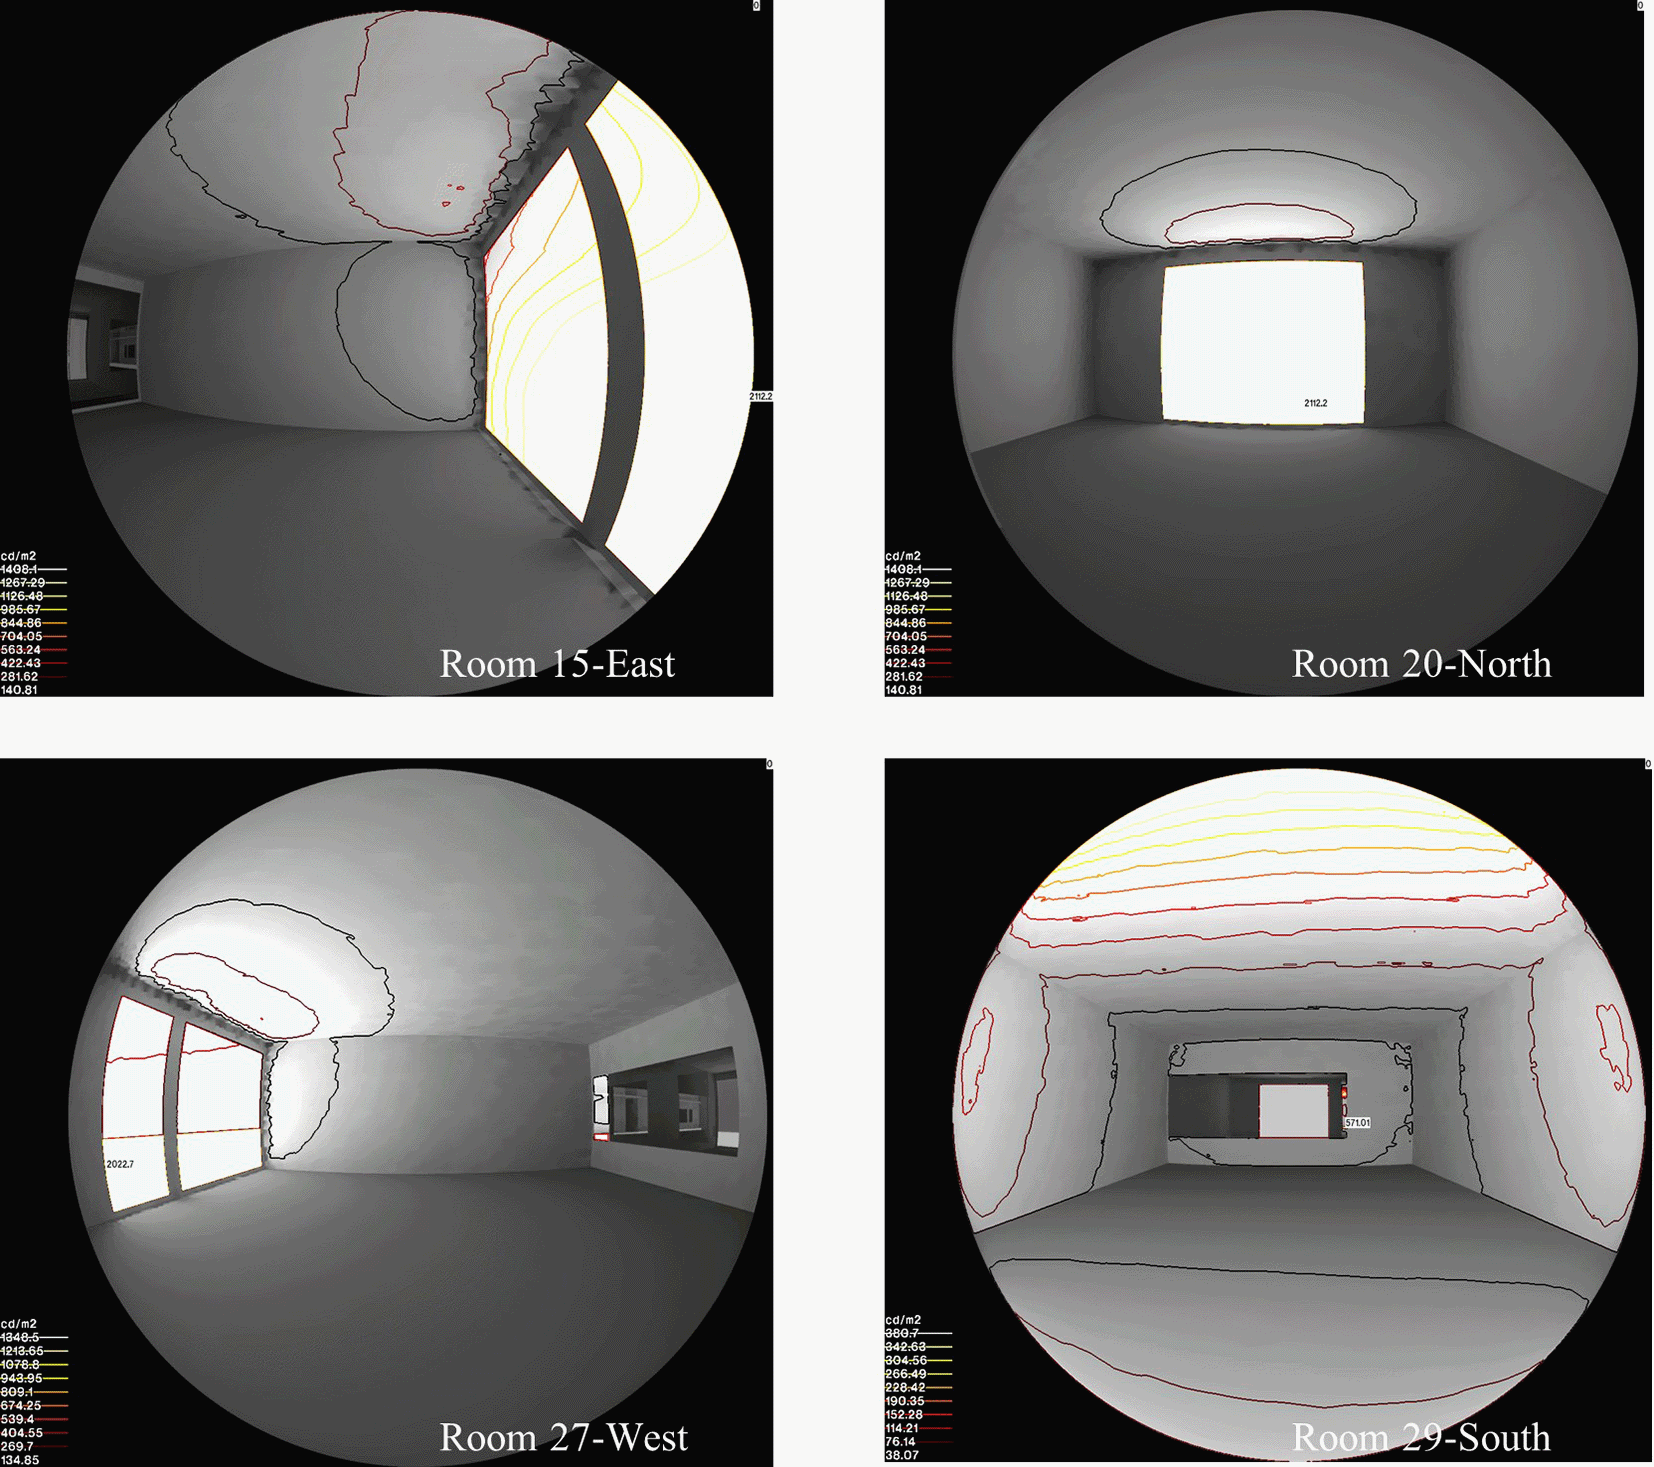
As shown in Table 3, the maximum glare exposure to the four rooms is below 1500 cd/m2, within the acceptable range. Thus, glare is not one of the issues affecting the existing building performance and IEQ.
| Room | Minimum glare exposure | Maximum glare exposure |
|---|---|---|
| Room 15 - East | 281.62 | 1408 |
| Room 20 - North | 281.62 | 1408 |
| Room 27 - West | 269.7 | 1348.5 |
| Room 29 - South | 76.14 | 380.7 |
Energy usage
Energy usage analysis calculates the energy consumption of the building. The cooling demand is generated based on standard equipment load for the zone, and occupancy load is generated from the users occupying the zones. The major areas of energy consumption of buildings are heating, cooling, lighting.
Normalised energy balance
The energy demanded for heating and cooling is directly related to the external temperature. The energy needed for cooling begins consumption in March and increases gradually to reach the peak during July, which has the highest temperature, and stops by October. The energy required for heating begins consuming in November, gradually increasing until reaching the peak in January, which has the lowest temperature, and gradually decreases till April.
• Peak energy consumption comprises heating, cooling, lighting, and equipment demands.
• During summer, the cooling demand is the highest contributor, as it reaches up to 209.86 kWh/m2.
• During winter, the heating demand is the highest contributor, as it reaches up to 188.88 kWh/m2.
• Heating demands during summer and cooling demands during winter are unnoticeable.
The results show unusually high results for the atrium; therefore, the atrium results are not included. Upon further investigation into the results, it is determined that the tools used in this simulation are not appropriate to analyze complex building physics, such as convection in the atrium. To sum up, Table 4 shows the highlights of the existing building design challenges.
Material selection
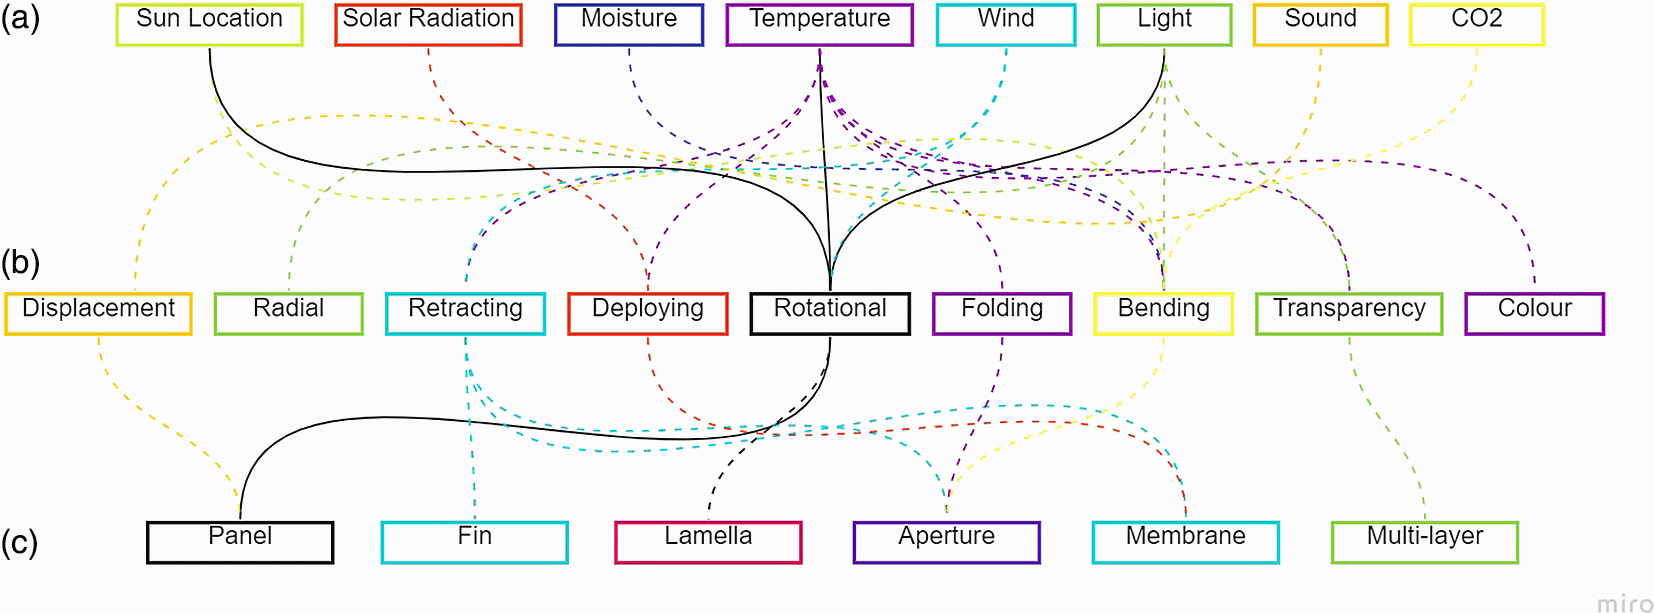
The selection of smart materials used in building envelopes located in coastal cities is based on criteria of identifying material properties (as shown in Table 5), environmental conditions of the building context, cost and accessibility (as shown in Figure 7).

This paper focuses on SABEs in coastal cities and, in particular, Alexandria. Successful material selection is based on choosing a material which is produced within Egypt or proximity countries and which has the properties that can adapt to the local climate. This has the added advantage of reducing carbon dioxide emissions in procuring the materials, stimulating the local economy of the region and incentivizes designers and decision-makers to choose the specified materials.
Figure 7 shows that the clustering of smart materials manufactured within Egypt is shape memory polymer (SMP), shape memory alloy (SMA), and electro active polymer (EAP). However, color-changing materials and phase change material (PCM) may also be available due to Alexandria’s ease of access and proximity to these. Regarding cost, PCM, thermos bimetals and EAP are considered the cheapest, while SMA is regarded as the most expensive. Therefore, SMP, SMA, EAP are focused on. Their properties, advantages, disadvantage and morphology are identified as follows:
By considering different types of smart materials in terms of advantages, disadvantages, morphology and factors of adaptation as shown in Table 5, and cost of manufacturing and location of production as shown in Figure 7, the SMA nickel titanium is selected to be applied as the “smart” material in SABEs (see Table 6).
| Location | Type of smart material | Material name | Density | Thermal conductivity | Coefficient of thermal expansion |
|---|---|---|---|---|---|
| Envelope | SMA | Nickel titanium | 6.45 gm/cm3 | 0.18 W/cm·K | 11×106/°C |
Movement selection
A decision support tool is created to select the right SABE design for the building based on factors of adaptation, as shown in Figure 8. Based on result 1A, sunlight and temperature are the main adaptation factors for the selected case study; rotational panels have been selected. There are different typologies of panels (as shown in Figure 9); vertical panels are preferred if the north, east and west elevations are exposed to the sun since they can block the sun relatively well. Egg-crate shading devices are usually used for non-south facing, high-rise buildings. However, horizontal panels are selected since results-1A show the thermal comfort and light issues are mainly concentrated on the south, east and west sides of the building. It also allows a field for the external view (as shown in Figure 9) which is important for occupants of educational buildings.
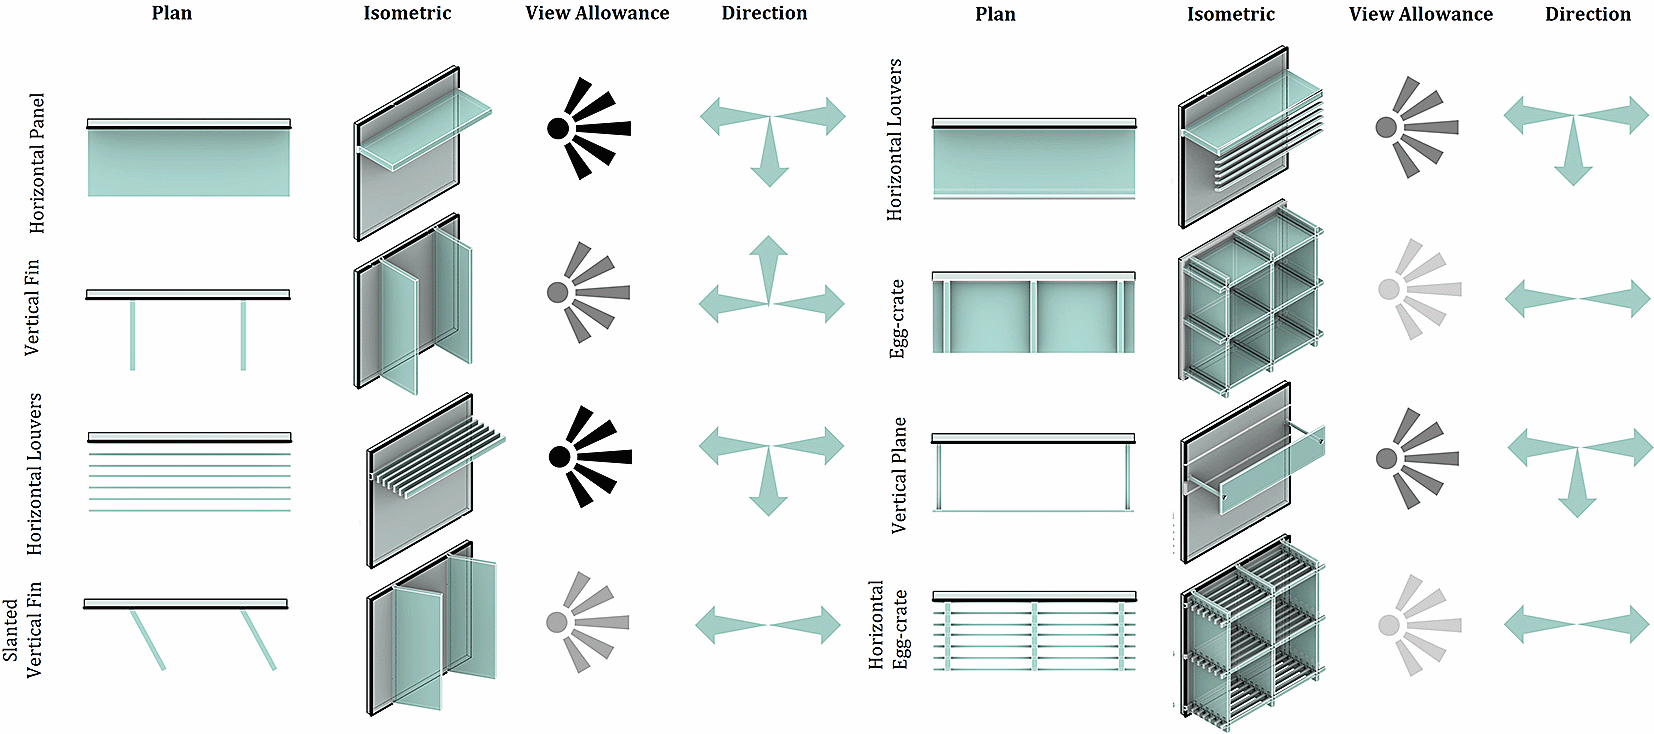
There are two types of external shading devices: fixed and movable. Movable shadings can adapt to variable environmental factors like sun path (solar radiation) and external air temperature. It can be mechanically dependent or made from smart materials. Horizontal, vertical or egg-crate are the basic designs of shading devices as shown in Figure 9. It is necessary during the design phase to measure the preferable solar penetration during summer. Horizontal shading is suitable for southern exposure to the sun. For low rise buildings, south elevations can be shaded using roof overhangs. Horizontal panels and horizontal louvres are considered the most aesthetically pleasing solution for buildings that require good view access for outdoor spaces, like hospitals, residential and educational buildings.
SABE design
As a result of identifying the problems facing the existing building design (result 1A) and identifying potential solutions (result 1B), the SABE is proposed (Figure 10).
The SABE consists of horizontal panels, static ones covering external walls (to add additional insulation to the western and southern sides of the building and aesthetically blend the window panels to the rest of the envelope) and dynamic ones covering windows. The panels are made of SMA (nickel titanium) supported by structure frames. The panels respond to solar radiation and temperature; they can respond automatically in two movements, primary and secondary, as shown in Figure 11. The horizontal panels vertically divided with the dimensions x*y are 0.30*0.20 m, to get better articulation of the panels. The actuators and sensors control the primary movements of the dynamic panels on the building envelope (open/closed movement). At the same time, the finer movement among individual panels is the properties of SABEs responding to environmental changes, as shown in Figure 12.
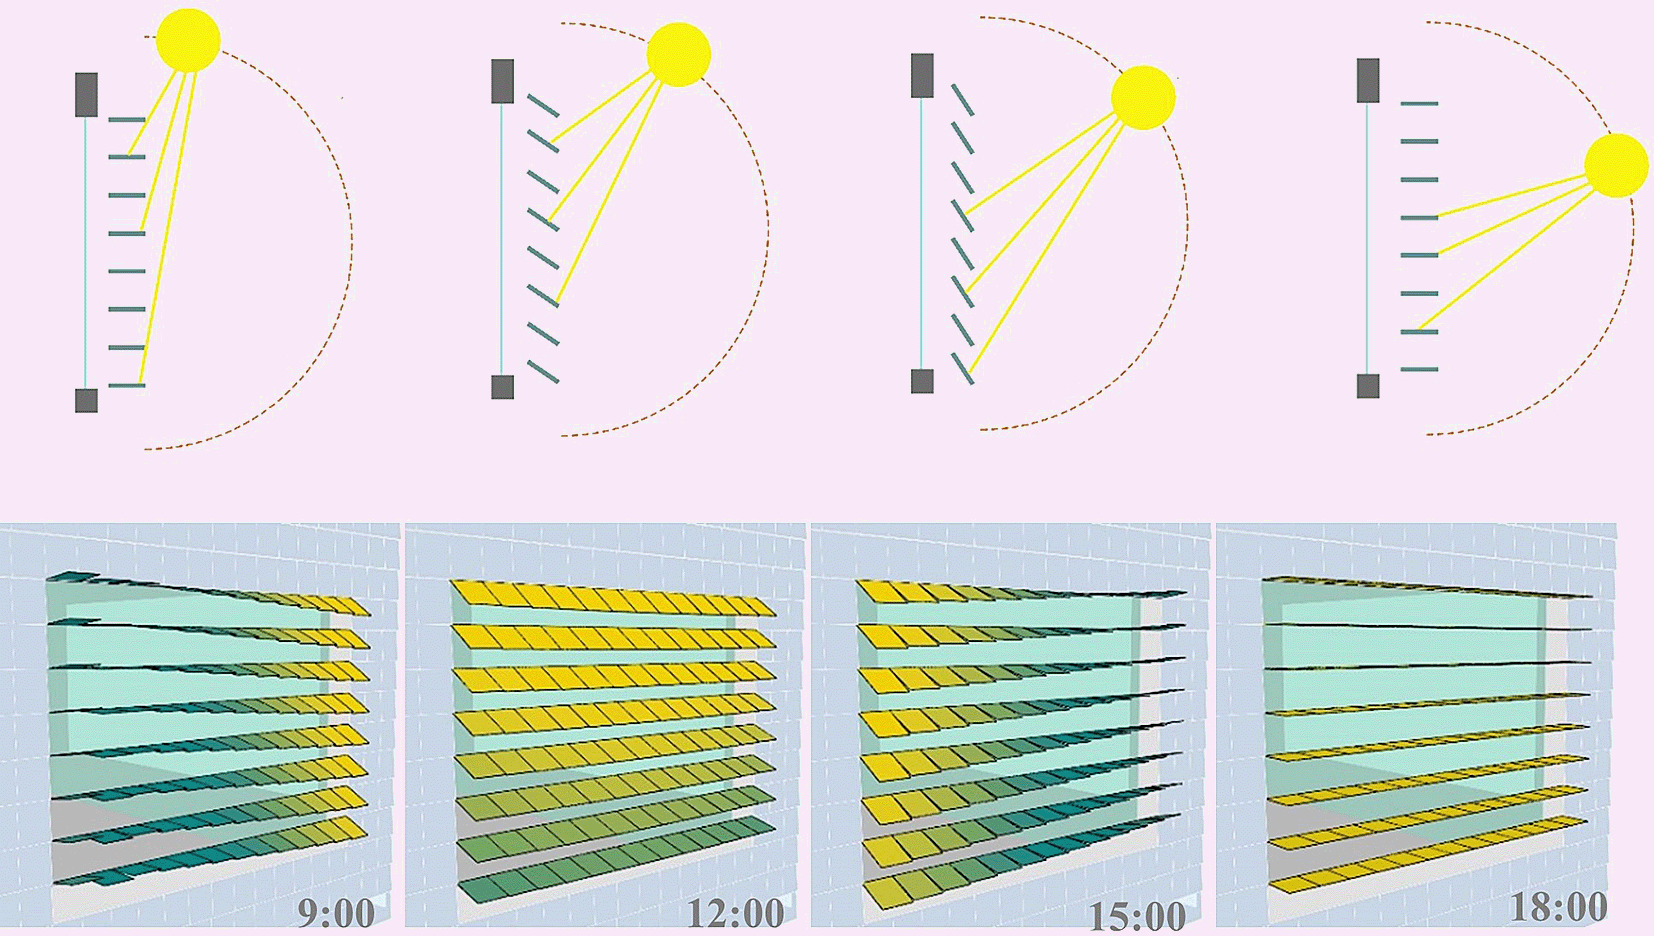
A SABE has two movements, primary and secondary, as shown in Figure 11. The primary movement is controlled by actuators and sensors on the building envelope that react at a larger time interval. The secondary movement controls the fine adjustments between the larger time intervals through a SABE’s smart properties. The actuators and sensors can also supplement the secondary movement during times with low solar radiation due to low thermal conductivity of SMA.
Proposed building simulation: results comparison
Building simulation runs again after applying SABEs to compare the difference between the existing building performance and the proposed SABE design in terms of indoor thermal comfort, daylight and energy usage as follows:
Thermal comfort percentage
The results vary from 0-100% and are colored from red to blue. Red regions imply that occupants in these zones are least comfortable, and the blue zones imply most comfort. It must be noted that the comfort percentage includes both heat and cold sensation. Hence, extreme hot and cold zones are both colored in red.
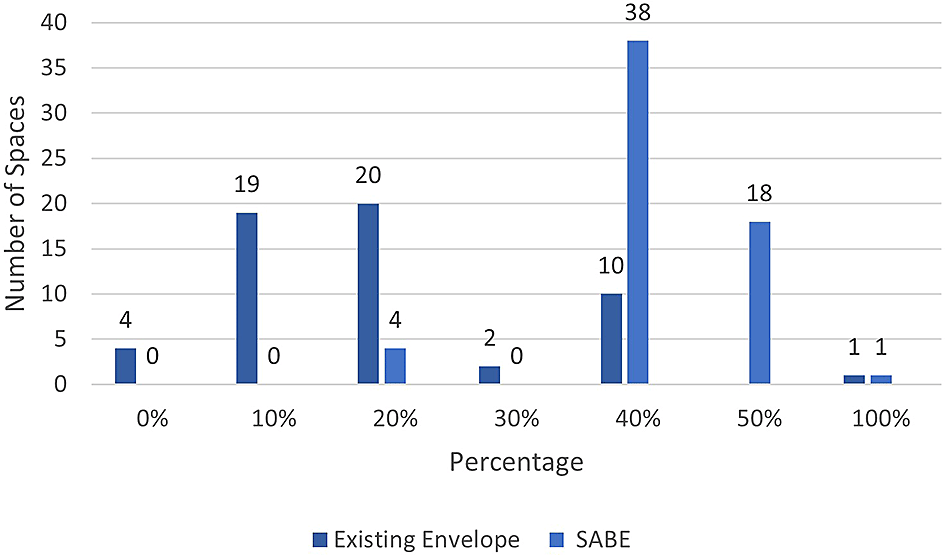
Thermal comfort percentage has significantly increased with the proposed SABE design to 40% of comfortability in rooms with external windows on the north, west, south and east sides, as shown in Figure 13. The percentage of time when the atrium is comfortable has also increased from 0 to 20%. The number of rooms that are 30% thermally comfortable and more has increased from 13 rooms to 57 rooms, as shown in Figure 14.
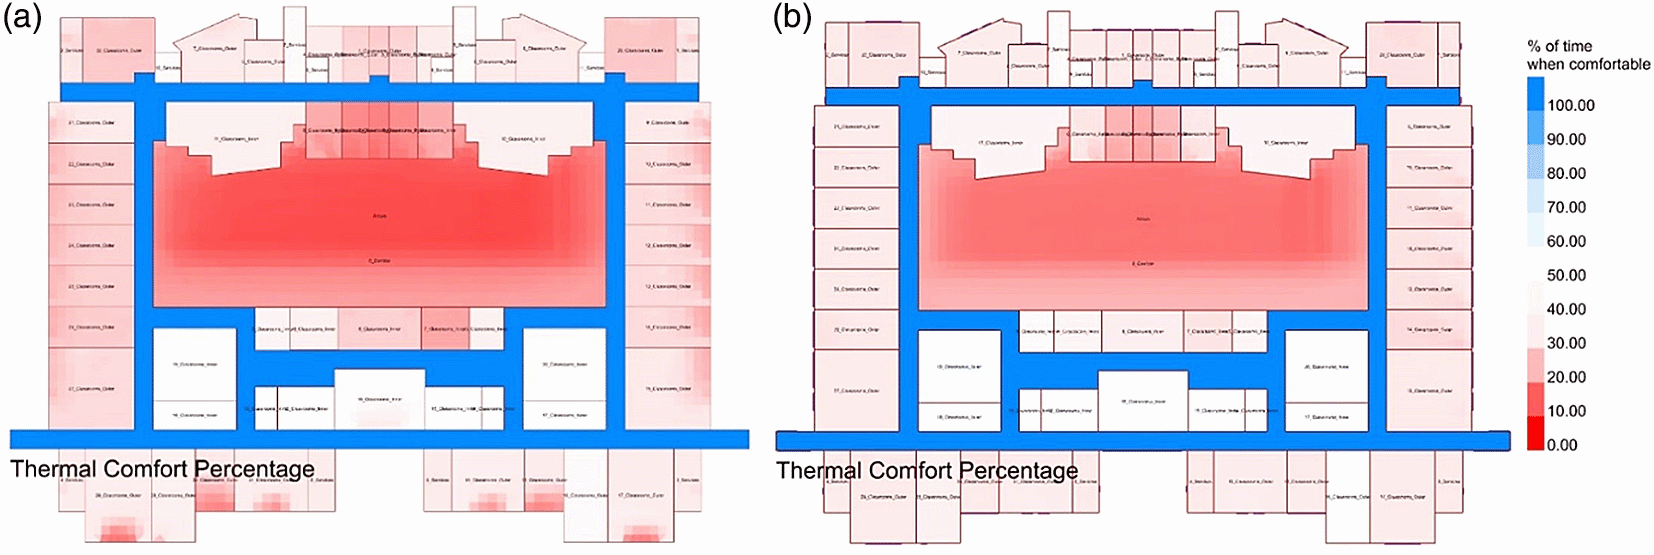
(a) Thermal comfort percentage of existing building design. (b) Thermal comfort percentage of proposed smart adaptive building envelope (SABE) design.
Operative temperature
The analysis grid is colored with its operative temperature in Celsius using a blue-yellow-red gradient color scheme. Blue is the lowest temperature, and red is the highest temperature. It must be noted that the range of values is different. The atrium is excluded from the analysis as previously mentioned, as it is a transitional space for circulation.
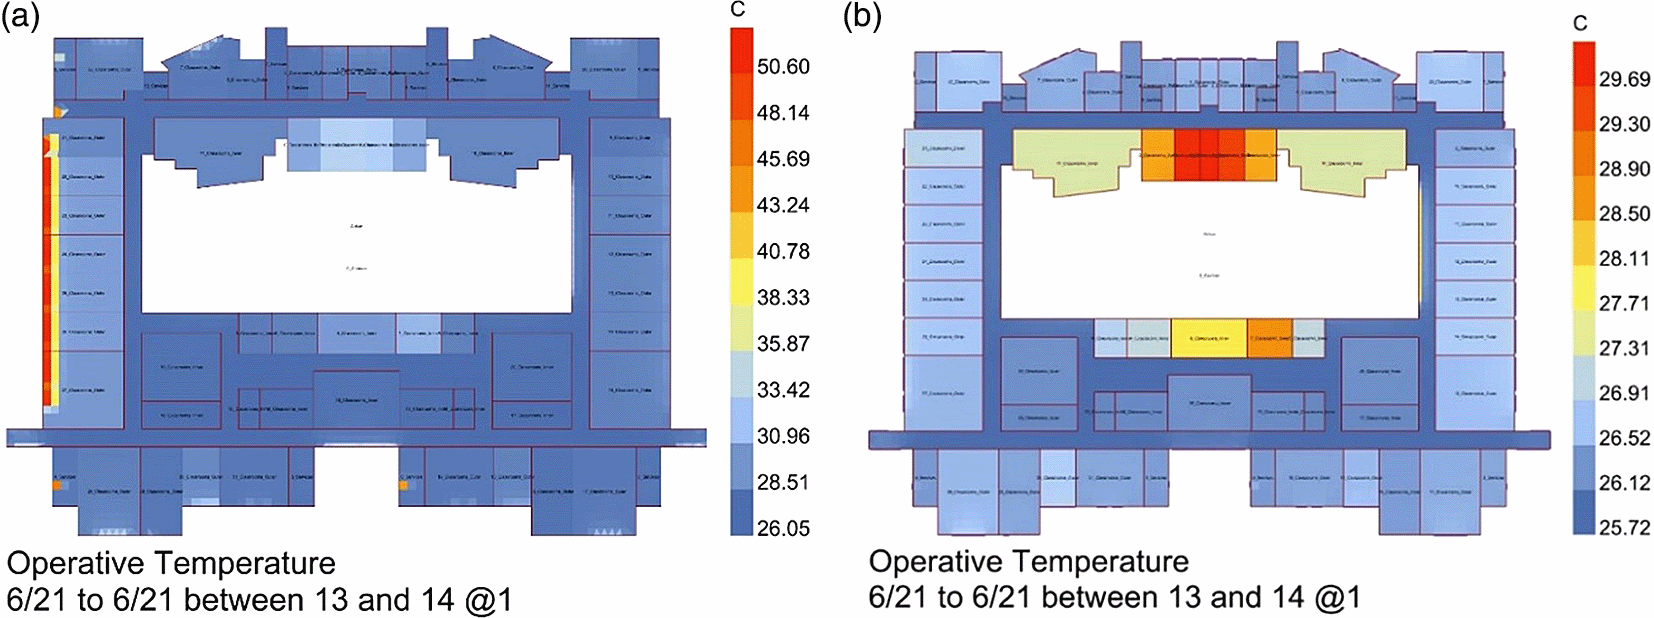
There is an extreme variation between the minimum and maximum temperature (24 °C). This intense heat is focused on the western window, and it is essential to address it. Though the hot spots are more prominent, the minimum and maximum temperature variations are not extreme (16 °C).
The operative temperature of the building during the winter solstice (21st of December between 1-2 pm), as shown in Figure 15, has a slight increase on the north and east sides by 1 degree. However, the temperature of the rooms on the south and west side of the building has dropped to 20-21 °C. The rooms overlooking the atrium have decreased by 2 degrees, reaching a range of 23.9 to 25.8 °C.
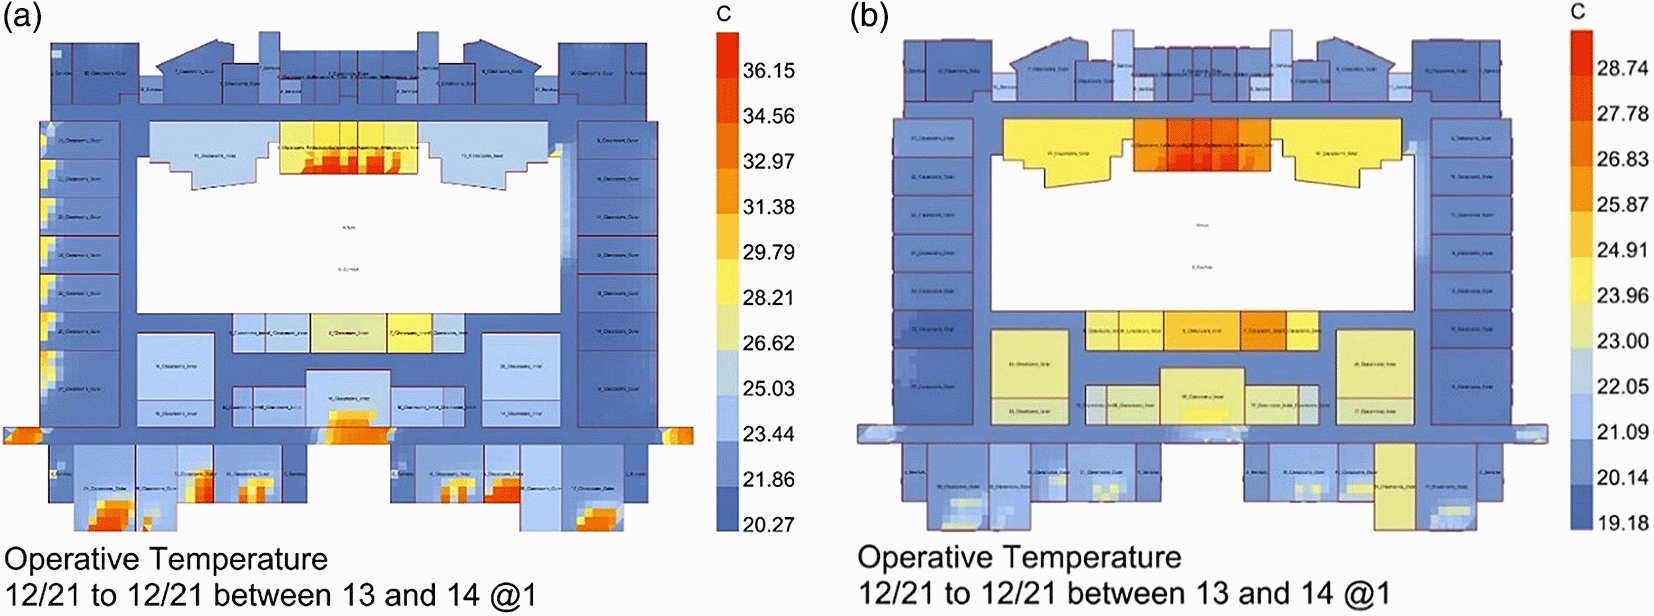
(a) Operative temperature of existing design during winter. (b) Operative temperature of proposed smart adaptive building envelope (SABE) design during winter.
During the summer solstice in the proposed SABE design, the operative temperature, as shown in Figure 16, has decreased (on the 21st of June between 1-2 pm). In rooms on the west side, the operative temperature dropped close to the window from a range of 45-50 °C to 26 °C. The operative temperature of rooms on the east side had reduced from 28.5 °C to 26.5 °C. Rooms on the north and south sides’ temperature decreased from a range of 28.5 °C and 30.9 °C to 26.1 °C and 26.5 °C.
By comparing the existing building design and the SABE design, the number of rooms with an operative temperature of 26 °C has increased from 35 rooms to 48 rooms, as shown in Figure 17a, and the amount with temperatures of 28 °C have decreased from eight to three rooms. During winter, the operative temperature dropped in most rooms, as most rooms’ (20 rooms) temperature is 20 °C, as shown in Figure 17b.

The charts compare the operative temperature of the existing building design to the proposed smart adaptive building envelope (SABE) design: (a) During summer. (b) During winter.
PMV
PMV has improved in the proposed SABE design, as shown in Figure 18. PMV has changed from hot to slightly warm during summer on the west and south sides of the building (close to windows) and rooms that overlook the north of the atrium.

The scale has seven points to predict the thermal sensation of building occupants; predicted mean value (PMV) analysis results of building occupants during summer for: (a) Existing building design. (b) Proposed smart adaptive building envelope (SABE) design.
On the other hand, PMV during winter, as shown in Figure 19, for rooms on the four sides of the buildings have degraded from slightly cool to cool. However, the south of the building and the atrium (close to windows openings) have improved, from hot to slightly cool and slightly warm, respectively.

Predicted mean value (PMV) analysis results of building occupants during winter for: (a) Existing building design. (b) Proposed smart adaptive building envelope (SABE) building.
Occupants feel slightly warm in all rooms during summer in the case of the SABE design. However, occupants feel a range of slightly warm, warm and hot in the existing building rooms, as shown in Figure 20a. During winter (as shown in Figure 20b) the majority of building occupants feel slightly cool in the proposed SABE design (46 rooms), and 38 rooms in the existing design, whereas occupants feel neutral in 15 rooms in the SABE design and 20 rooms in the existing design.

(a) During summer. (b) During winter.
Daylight: UDI
SABEs have a minor impact on the UDI of the rooms located on the north, east and north side of the building, as shown in Figure 21. However, UDI degraded in rooms located on the west side of the building, requiring more artificial light increasing electrical energy usage.

(a) Existing design; (b) Proposed smart adaptive building envelope (SABE) design.
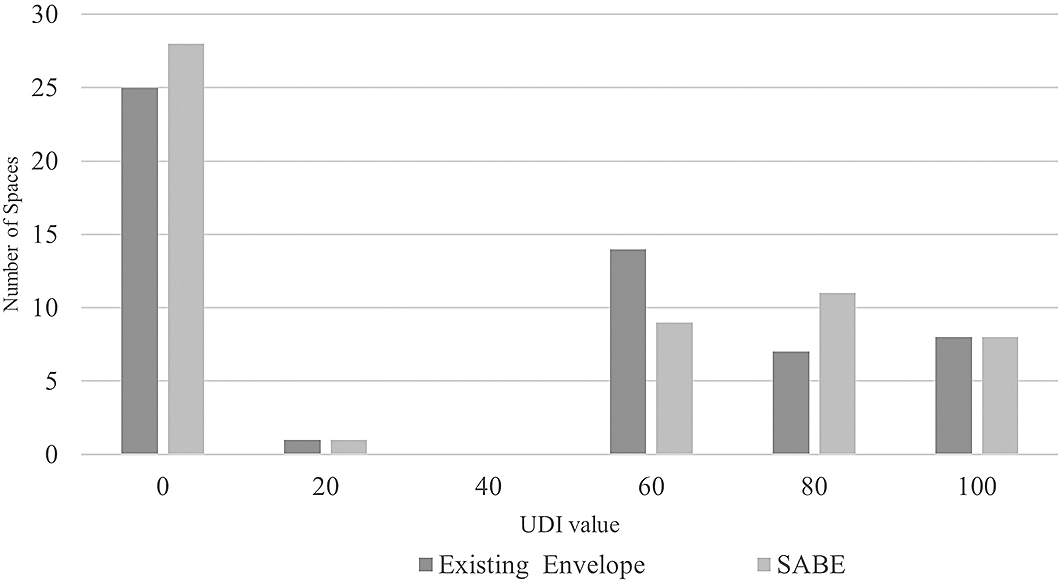
The number of rooms with UDI values of zero and 80 has increased from 25 to 28 rooms and from 7 to 11 rooms, respectively, as shown in Figure 22. The number of rooms with a UDI value of 60 has significantly decreased from 14 to 9 rooms.
Energy usage: normalized energy balance
Energy usage has significantly decreased, as shown in Table 7. The total peak energy consumed has reduced by 7.62% during summer and 5.42% in winter. Heating demand during winter has decreased by 5.52%, and cooling demand during summer reduced by 5.84%. Lighting demand has reduced during summer and winter by 7.04% and 4.67%, respectively. A fraction of energy is used for other mechanical purposes throughout the year.
Indoor thermal comfort, daylight and energy consumption is improved by using SABEs. The peak end-use energy for heating, cooling and lighting is calculated as follows:
End-use energy = energy-use intensity (see Table 8)/coefficient of performance (CoP).
| End-use energy existing design | End-use energy SABE | |||
|---|---|---|---|---|
| Summer (kWh/m2) | Winter (kWh/m2) | Summer (kWh/m2) | Winter (kWh/m2) | |
| Heating | 0.01 | 47.22 | 0.01 | 44.62 |
| Cooling | 59.96 | 0.15 | 56.46 | 0.15 |
| Light | 2.52 | 2.52 | 2.34 | 2.40 |
CoP of heating ranges between 2.0-4.0, CoP of cooling ranges between 2.3-3.5.
CoP of heating is assumed as 4 and cooling as 3.5.
SABEs can improve the IEQ, thermal comfort, levels of daylight and energy use. The results demonstrate that when a SABE is designed according to the local context, weather and building use, they can significantly improve thermal comfort, PMV and daylight. The results also show that while the occupants’ comfort is improved, it does not necessarily come at the cost of increased energy consumption; rather, SABEs reduced the heating and cooling demand. While SABEs are dynamic in their movement, it must be noted that they are permanent envelope fixtures and may pose a problem while optimizing for both summer and winter. The improvement can only be optimized for a particular season; the summer scenario was considered to cause a significant negative impact in the case study discussed. Hence, it was chosen as the optimization goal; this slightly decreased the winter comfort levels in some zones.
It is imperative to acknowledge the technical limitations of software and the limited time and resources available for the case study. Energy simulation is an extremely complex process requiring detailed input on various parameters such as wall composition glazing (gap, air, thickness and so on). Appropriate assumptions were made to the best ability of the author with the available data, but detailed material information may change the results. Large areas with complex geometries and mechanical systems must be simulated at a high resolution (spatially and in time). That requires extremely high computational power, often scaling exponentially. For instance, the area of a room of 5*5 m is 25 m2, but the area of a room of 10*10m is 100 m2 (i.e., doubling the size scales the area by four times), which is not possible with common personal computers.
Honeybee and lb tools are built around the EnergyPlus energy simulation engine. The primary purpose of this energy modelling tool is to calculate radiative heat transfer between the different zones in the building and the outside. However, the study building consists of an atrium that spans multiple floors. The building physics in such a space involve radiative and convective heat transfer. It is determined that EnergyPlus alone is not sufficient to accurately calculate the energy demand for the zone. Hence, results for the atrium are not included. In future studies, it is recommended to use a combination of EnergyPlus and computational fluid dynamics (CFD).
The scope of this paper is limited to the envelope design, while respecting the existing design decisions. Hence, the scope for influencing the building’s performance is extremely limited. Important components of the design that influence the performance, such as the atrium and the window to wall ratio, are already decided prior to the design intervention.
Climate change is a global issue that is inevitable. The effects of climate change manifest across the economic, environmental and social dimensions. It is impossible to ‘beat nature’ and stop climate change events from happening entirely. New courses of action must be taken on different scales; the built environment must be adaptively designed to respond to unpredictable climatic changes. Building envelopes are physical layers that separate the unconditioned exterior from the interior environment where people live, work, study and perform everyday activities.
Environmental and climatic changes directly impact people’s daily lives, needs, and performance. Internal environments must be designed to offer the optimum IEQ; this cannot be achieved using static building envelopes. This paper demonstrates that SABEs can respond to climatic changes and offer efficient IEQ for occupants. Smart materials have high performance, responsive and changeable properties. The usage of SABEs creates a better IEQ by providing thermal comfort and daylight availability, and by reducing energy consumption. Climatic changes have to be addressed based on the location and the context of the building; to identify the suitable smart material, adaptive structure and movement design. Different smart materials have various properties and adapt to certain climatic changes; each can be selected based on the required adaptation.
The guidelines are sorted into two scales, internationally and locally, to improve educational buildings located in coastal cities. The following guidelines are for the international scale:
• Analyze climatic zone and understanding climatic challenges.
• Identify suitable smart materials based on adaptation factors, material properties, availability in terms of access and cost.
• Analyze the dynamic pattern of the envelope that can adapt to the addressed climatic changes.
• In the case of improving an existing building, it is important to identify the factors negatively affecting IEQ.
• Analyze the improvement rate, with and without SABEs.
• Priorities thermal, acoustic and visual comfort in classrooms, study areas and offices, respectively.
• Zones which are not regularly populated for long periods of time are important and must be comfortable. However, this should not be at the cost of comfort in more frequently used zones such as classrooms, study rooms and offices.
A set of recommendations are given for educational buildings located in Alexandria, Egypt, the local scale:
• Three types of smart materials that are recommended to be used, which are SMP, SMA and EAP.
• Horizontal shading panels are recommended due to the sun’s path in the southern hemisphere and higher sun angles at the equator.
• Windows must be adequately sized in the south and west façade in case trees, buildings, etc. provide no external shading to prevent thermal discomfort caused by solar heat gain.
• While prioritizing the trade-off between thermal comfort and daylight, thermal comfort must be given higher priority as the environmental impact is significantly higher than correcting for daylight.
Mendeley data: SABE Simulation. http://doi.org/10.17632/b9db42k7pm.144
This project contains the following underlying data:
• annual_daylight_inputs.json (The required inputs for the Honeybee annual daylight simulation).
• Base_Model.hbjson (The Honeybee base repetitive floor model of Al-Alamein simulations).
• Dabaa.wea (EPW weather data file of Al Dabaa, Egypt -the closest available weather data to Al-Alamein- available at https://www.ladybug.tools/epwmap/).
Mendeley data: SABE Simulation. http://doi.org/10.17632/b9db42k7pm.144
This project contains the following extended data:
• iso_01.jpg (Exploded diagram of SABE design).
• SampleRoom_FacadePanel.jpg (A figure shows the SABE adapting to the sun path).
• SampleRoom_NoFacadePanel.jpg (A figure showing the SABE adapting to the sun path -static envelope is hidden).
• summer_01.gif (A gif showing primary movement of proposed SABE movement during summer).
• summer_02.gif (A gif showing primary movement of proposed SABE movement adapting to the sun path during summer - static envelope is hidden).
• winter_03.gif (A gif showing primary and secondary movement of proposed SABE movement during winter).
Data are available under the terms of the Creative Commons Attribution 4.0 International license (CC-BY 4.0).
The authors would like to acknowledge the support received from the AAST administration and staff for providing full access to Al-Alamein campus construction drawings. We would also like to thank Sanjay Somanath for providing technical support.
| Views | Downloads | |
|---|---|---|
| F1000Research | - | - |
|
PubMed Central
Data from PMC are received and updated monthly.
|
- | - |
Is the background of the case’s history and progression described in sufficient detail?
No
Is the work clearly and accurately presented and does it cite the current literature?
No
If applicable, is the statistical analysis and its interpretation appropriate?
Not applicable
Are all the source data underlying the results available to ensure full reproducibility?
Partly
Are the conclusions drawn adequately supported by the results?
No
Is the case presented with sufficient detail to be useful for teaching or other practitioners?
No
Competing Interests: No competing interests were disclosed.
Reviewer Expertise: Thermal comfort, Climate responsive design
Is the background of the case’s history and progression described in sufficient detail?
No
Is the work clearly and accurately presented and does it cite the current literature?
Partly
If applicable, is the statistical analysis and its interpretation appropriate?
Partly
Are all the source data underlying the results available to ensure full reproducibility?
No
Are the conclusions drawn adequately supported by the results?
Partly
Is the case presented with sufficient detail to be useful for teaching or other practitioners?
No
Competing Interests: No competing interests were disclosed.
Reviewer Expertise: Thermal Comfort, Indoor Environmental Quality, Sustainable Architecture, Design-Decision Support, Building Performance Simulation, Passive and Bioclimatic Design
Alongside their report, reviewers assign a status to the article:
| Invited Reviewers | ||
|---|---|---|
| 1 | 2 | |
|
Version 1 01 Jul 22 |
read | read |
Provide sufficient details of any financial or non-financial competing interests to enable users to assess whether your comments might lead a reasonable person to question your impartiality. Consider the following examples, but note that this is not an exhaustive list:
Sign up for content alerts and receive a weekly or monthly email with all newly published articles
Already registered? Sign in
The email address should be the one you originally registered with F1000.
You registered with F1000 via Google, so we cannot reset your password.
To sign in, please click here.
If you still need help with your Google account password, please click here.
You registered with F1000 via Facebook, so we cannot reset your password.
To sign in, please click here.
If you still need help with your Facebook account password, please click here.
If your email address is registered with us, we will email you instructions to reset your password.
If you think you should have received this email but it has not arrived, please check your spam filters and/or contact for further assistance.
Comments on this article Comments (0)