Keywords
Mitochondria, Blood Pressure, Hypertension, Fasting Glucose, Haplogroups, Drug Response, Thiazide Diuretic
This article is included in the Cell & Molecular Biology gateway.
Mitochondria, Blood Pressure, Hypertension, Fasting Glucose, Haplogroups, Drug Response, Thiazide Diuretic
This version is not different from the previous, we just update the article type (from case study to research article) and corresponding author (now Marguerite Irvin).
Hypertension (HTN) is a chronic condition leading to various deleterious health concerns including cardiovascular disease (CVD).1 Reports state African Americans (AAs) have the highest prevalence of HTN (54%) compared to all other American populations (European Americans (46%), Asian Americans (39%), Hispanic Americans (36%), and African-born immigrants (<40%)).2 They also have the lowest prevalence of controlled HTN among hypertensive patients receiving medication.2
These disparities may in part be due to differences in response to first-line antihypertensive (AHT) medications. It has been established that AAs respond better to diuretics and calcium channel blockers as opposed to other classes of AHT pharmaceuticals.3,4 Still, a wide distribution of blood pressure (BP) change associated with diuretic treatment has been observed, demonstrating the need to understand factors associated with treatment responses.5 In particular, genetic factors associated with BP response to thiazide diuretics in AA populations are understudied. Moreover, thiazide diuretics are significantly associated with metabolic side effects, like impaired fasting glucose (FG).5 Pharmacogenomic studies can offer a solution to some of these problems by identifying genetic contributors to both treatment response and adverse effects. Remarkably, genetic risk factors for BP response to thiazide diuretics are scarce overall, especially in the AA population.6
Mitochondria are cellular energy production organelles so important to cell function that they have their own independent genome.7Importantly, mitochondrial DNA (mtDNA) variation can contribute to an imbalance in cellular energy homeostasis and increase vulnerability to oxidative stress, which has been linked to cardiometabolic diseases like HTN.8–11 The mitochondrial genome shows noteworthy diversity, due to a higher mutation rate than the nuclear genome, where most variants induce small changes in mitochondrial function that may contribute to disease.12,13 Relevant to our study, previous reports have found several mitochondrial genetic variants associated with systolic BP, FG, and other cardiometabolic traits.13–15
Another unique aspect of the mitochondrial genome is that, due to maternal inheritance and lack of recombination events, it displays distinct regional variation (potentially due to natural selection pressures) defining distinct lineages associated with the significant global ethnic groups.16–20 Particularly, macrohaplogroup L is specific to sub-Saharan Africa, with the most ancient mtDNA haplogroups being L0 and L1 which form the basal lineages of the human mtDNA tree, followed by L2 and L3.20 Previous studies suggest that specific mtDNA haplogroups, especially those specific to sub-Saharan Africa, may be associated with diseases of metabolism in modern times such as CVD, type 2 diabetes (T2D), and HTN.8,20,21 Further, cybrid studies comparing European-origin haplogroups (H and J) and African-origin haplogroups (L) have shown differences in cell growth, oxygen consumption rates, expression of non-energy-related genes, responses to stressors, and rates of glycolysis.22,23
While mitochondrial dysfunction due to mtDNA variation has been consistently associated with cardiometabolic diseases, few studies have examined how variants are associated with responses to common treatments for these diseases (including AHTs) despite mounting evidence that the mitochondrial genome can play a role in drug response.24 Additionally, most drugs used in cardiology have some degree of mitochondrial toxicity which could be exacerbated by genomic variations.25 For example, the use of thiazide diuretics was found to decrease mitochondrial function by inducing apoptosis.21,26 Also, a recent study observed links between nuclear variants with mitochondrial function and drug response to other AHT classes.27 Given established racial and inter-individual differences in response to thiazide diuretics, we investigated whether mtDNA variants and haplogroups give additional insight into BP and FG response to thiazide diuretics treatment in AAs.
All data used in this study were previously acquired from the Genetics of Hypertension Associated Treatments (GenHAT) study, an ancillary pharmacogenetics study of the Antihypertensive and Lipid-Lowering Treatment to Prevent Heart Attack Trial (ALLHAT).28 A total of 4526 GenHAT self-reported AAs were randomized to chlorthalidone, a thiazide diuretic, and had sufficient DNA for genotyping (genotyping was conducted during this study using samples from the previous studies described above). Ethical use of all data, study and protocol was fully approved by the University of Alabama at Birmingham Institutional Review Board (Approval No. IRB-160415008). Previous consent from each participating patient was previously acquired during previous studies (Arnett et al., 2002).
BP and FG measurements in the ALLHAT study have been described previously.29 For the current study, BP response was defined as the change in systolic BP (SBP) and the change in diastolic BP (DBP) from baseline to six months post-thiazide diuretic treatment initiation in the trial. FG response was defined as the change in FG from baseline to two years of a treatment since initiation. Other clinical data including body mass index and T2D status were measured at baseline. FG was not a primary outcome measured in ALLHAT and was missing for 71.9% of the sample at the two-year visit. In total, 317 were missing data on change in DBP, 320 were missing data on change in SBP, and 3156 were missing data on change in FG.
GenHAT samples were genotyped using the Expanded Illumina Infinium Multi-Ethnic AMR/AFR Beadchip, using the manufacturer’s protocol (Illumina, Inc., San Diego, CA). Genotypes were called using the Illumina GenomeStudio software. In total, 4296 samples were successfully genotyped, including 1559 mtDNA single nucleotide polymorphisms (SNPs). We set both the missing rate for samples and SNPs to 5% (removing 17 samples and 13 SNPs), and we removed 944 SNP duplicates, 261 singletons, four SNPs with potential heteroplasmic issues, and 26 SNPs with no dbSNP formally assigned rsID. We retained 4279 samples and 311 mtDNA SNPs to conduct a single SNP and haplogroup analysis. After these data were merged with the complete clinical data described above, there were 3962 (317 missing), 3959 (320 missing), and 1123 (3156 missing) samples for the analysis of DBP response, SBP response, and FG response with genotypes, respectively.
Haplogroups were obtained for each individual using HaploGrep,30,31 an open-source maternal haplogroup classifier. According to the recommendation from HaploGrep’s developer, we removed a total of 704 samples due to call discrepancy with the classified haplogroup HV, H2, and Z7. After merging this data with the complete clinical data described above, there were 3310, 3308, and 959 samples for the analysis of DBP response, SBP response, and FG response with haplogroups, respectively.
We standardized changes in SBP and DBP outcomes by Z-transformation. FG was transformed using an inverse rank-based transformation. We used linear regression models to examine the association between individual mtDNA haplogroup clades L, M, and N and SBP, DBP, and FG response. Next, we examined the association of haplogroup L subclades with each response (DBP n = 2803; SBP n = 2801; FG n = 786) (L subclades sample count was a subset of the original Haplogroup sample set, stated above (n= 3310)). The L3/L4 groups were combined due to small sample sizes (Figure 1). All models were adjusted for baseline measures (DBP, SBP, or FG), age, and sex. Using the Bonferroni correction, we calculated the level of significance for each outcome (DBP, SNP, and FG response against clades and subclades) to 0.05/ (3 outcomes) = 0.0167. Finally, we conducted a linear regression analysis to examine the association between individual mtDNA variants and SBP, DBP, and FG response under an additive genetic model adjusting for baseline measure (DBP, SBP, or FG), age, sex, and principal components to control for global ancestry (estimated using EIGENSTRATv6.1.4).32 Using the Bonferroni correction, we set the nominal significance to 0.000053 (=0.05/ (311 SNPs*3 outcomes)).
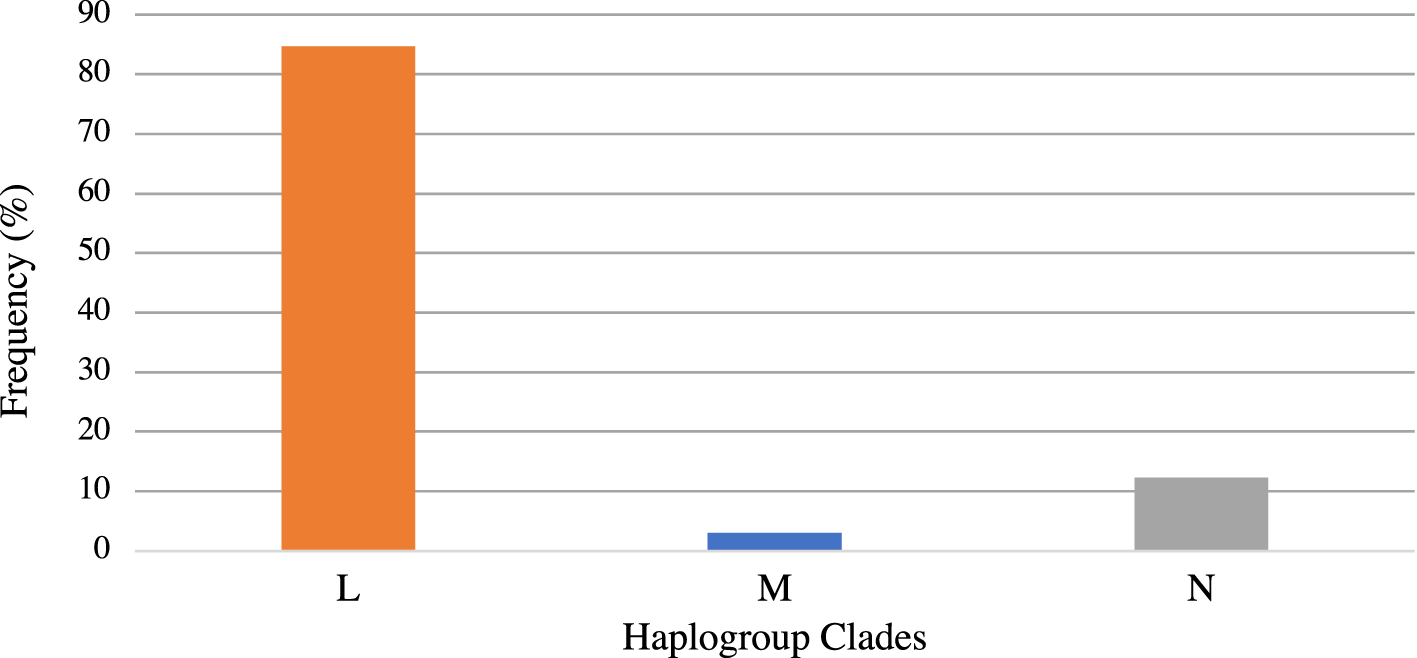
Figure 1 shows the distribution of the mtDNA haplogroup clades L, M, and N in the GenHAT sample with clade L being the most common (84.68%). Table 1 presents the cohort baseline characteristics for the haplogroup analysis. The participants had a history of cigarette smoking (27.63%), ~41% had T2D, and ~14% were diagnosed with stage 3 or greater chronic kidney disease (Table 1). Mean (± standard deviation, SD) baseline SBP was 145.6 mmHg (±15.71 mmHg); DBP was 84.48 mmHg (±10.03 mmHg), and FG was 127.6 mg/dL (±65.93 mg/dL). Mean (±SD) SBP response was -6.51mmHg (±19.13 mmHg); DBP response was -3.01 mmHg (±10.78 mmHg), and FG response was 6.95 mg/dL (±56.83 mg/dL) (Table 1).
There were no significant associations between haplogroup clades (L, M, N) and change in SBP, DBP, or FG (Table 2). When examining the L subclades, we found no significant association of subclades with change in SBP and DBP. However, the 3 subclades (L1, L2, and L3/L4) compared to reference subclade L0 were significantly associated with change in FG (β = -0.405; -0.354; -0.365, P-value < 0.017), respectively (Table 2).
| D FGa | D DBPb | D SBPb | ||||
|---|---|---|---|---|---|---|
| β (SE) | P-value | β (SE) | P-value | β (SE) | P-value | |
| Clades M and N vs. reference Clade L (DBP n = 3310; SBP n = 3308; FG n = 959) | ||||||
| M | 0.226 (0.163) | 0.166 | -0.059 (0.083) | 0.480 | -0.110 (0.087) | 0.207 |
| N | 0.020 (0.088) | 0.822 | -0.072 (0.043) | 0.092 | -0.019 (0.045) | 0.669 |
| Subclades L1, L2, L3/L4 vs. L0 (DBP n = 2803; SBP n = 2801; FG n = 786) | ||||||
| L1 | -0.405 (0.134) | 0.003 | -0.004 (0.064) | 0.951 | 0.071 (0.669) | 0.286 |
| L2 | -0.354 (0.133) | 0.008 | 0.047 (0.062) | 0.448 | 0.107 (0.653) | 0.102 |
| L3/L4 | -0.365 (0.135) | 0.007 | 0.015 (0.064) | 0.816 | 0.064 (0.671) | 0.342 |
No mtDNA SNP was associated with SBP, DBP, or FG response after correction for multiple testing. SNPs with marginal significance are presented in Table 3. In total, we observed one mtDNA SNP that was marginally associated with a change in SBP, six SNPs with a change in DBP, and 11 SNPs with a change in FG with P-value < 0.05.
| ID | Trait | dbSNP ID | BP | MAF | BETA | SE | P | Genes* |
|---|---|---|---|---|---|---|---|---|
| exm2216342BOT-1 | SBP | rs1116906 | 8460 | 0.015 | -0.109 | 0.056 | 0.05204 | ATP8 |
| Seq-rs28358578BOT-2 | DBP | rs28358578 | 2332 | 0.111 | 0.061 | 0.021 | 0.0028 | ND1 |
| exm2216198 | DBP | rs28358570 | 921 | 0.059 | -0.076 | 0.027 | 0.0054 | - |
| Seq-rs28359170BOT-1 | DBP | rs28359170 | 12236 | 0.101 | 0.047 | 0.021 | 0.0297 | ND4 - ND5 |
| Seq-rs28358573BOT-2 | DBP | rs28358573 | 1442 | 0.101 | 0.0465 | 0.021 | 0.0300 | ND1 |
| Seq-rs41352249BOT-2 | DBP | rs41352249 | 6680 | 0.041 | -0.069 | 0.032 | 0.0314 | CO1 |
| Seqrs202123618-TOP-1 | DBP | rs202123618 | 3434 | 0.018 | 0.101 | 0.048 | 0.0339 | ND1 |
| Seq-rs2853502BOT-2 | FG | rs2853502 | 13276 | 0.051 | 0.171 | 0.063 | 0.0096 | ND5 |
| Seq-rs2853487TOP-3 | FG | rs2853487 | 10589 | 0.054 | 0.169 | 0.062 | 0.0106 | ND4L |
| rs373606184 | FG | rs3020601 | 5442 | 0.055 | 0.153 | 0.061 | 0.0145 | ND2 |
| Seqrs200931747-BOT-2 | FG | rs193303033 | 4312 | 0.049 | 0.168 | 0.064 | 0.0151 | ND1 - ND2 |
| Seq-rs2853489TOP-1 | FG | rs2853489 | 1122 | 0.012 | 0.340 | 0.140 | 0.0158 | ND4 |
| exm2216342BOT-1 | FG | rs1116906 | 8460 | 0.015 | 0.304 | 0.121 | 0.0213 | ATP8 |
| Seq-rs28357376BOT-2 | FG | rs28357376 | 15824 | 0.068 | -0.125 | 0.053 | 0.0336 | CYB |
| Seq-rs28445203BOT-2 | FG | rs28445203 | 1123 | 0.016 | 0.246 | .118 | 0.0372 | ND1 - ND2 |
| exm2216469BOT-1 | FG | rs35070048 | 1109 | 0.059 | -0.116 | 0.057 | 0.0428 | CYB |
| exm2216384 | FG | rs28358274 | 10086 | 0.068 | -0.116 | 0.053 | 0.0460 | ND3 |
| Seq-rs2854125BOT-2 | FG | rs201893071 | 1095 | 0.068 | 0.113 | 0.057 | 0.0479 | CYB |
This study examined the association between mtDNA genetic variants and haplogroups and BP and FG response to a thiazide diuretic within a large sample of hypertensive AAs. Results from the single variant analysis did not remain statistically significant after correcting for multiple testing, however the haplogroup analysis suggested FG response may differ within the L subclade. The discoveries obtained here complement previous research showing association of mtDNA variation with cardiometabolic traits and importantly builds on pharmacogenetics research focused on first-line AHT response in AAs.13,33
Consistent with other studies of this population, the majority of GenHAT samples were classified into the mtDNA haplogroup L clade (over 80% of the sample, see Figure 1).34,35 When considering the major clades (L, M, N) in the GenHAT population, we did not observe an association with any of the response outcomes. However, within the L clade, subclades L1, L2, and L3/L4 (versus L0) had an inverse association with change in FG, suggesting a potential protective effect. While few studies have reported on the association of mtDNA haplogroups with FG changes during AHT treatment, some research suggests haplogroups are associated with T2D.33,36 For instance, Sun and colleagues reported women living with HIV possessing haplogroup L2 (versus non-L2 groups of L0/L3/other) had a 49% lower risk of developing T2D, suggesting haplogroup L2 may potentially be a protective factor.35 Other reports of haplogroup association with T2D are mostly in other race groups. The haplogroups J/T and T were found to be associated with an increased risk of diabetes in Europeans.37 The M8a,38 B4, and D439 haplogroups have an association with T2D in East Asians. However, the haplogroup N9a40 has been suggested to confer resistance against T2D in the Japanese and Korean populations and to be a protective factor against metabolic syndrome in Japanese women.41 With multiple studies suggesting haplogroups may be related to T2D within race groups, more research on L subclades and FG levels during AHT treatment is warranted.
In the single variant analysis, we observed SNPs with marginal association to SBP, DBP, and FG response to chlorthalidone. These SNPs were in or near NADH-ubiquinone oxidoreductase chain 1 (ND1), NADH-ubiquinone oxidoreductase chain 2 (ND2), NADH-ubiquinone oxidoreductase chain 4 (ND4), NADH-ubiquinone oxidoreductase chain 5 (ND5), and cytochrome B (CYB). Though few studies report on mtDNA SNPs and response to AHT treatment, researchers continue to discover significant associations between mtDNA variants and cardiometabolic traits across different ancestries (e.g. European,13,14,42 and African13,42). For example, Liu and colleagues reported a strong association between a nonsynonymous mtDNA variant (m.5913G>A in the cytochrome c oxidase subunit 1 of respiratory complex IV) and SBP and FG in a sample of 7000 European Americans from the Framingham Heart Study (minor allele being associated with a > 5 mm Hg and > 15 mg/dL higher SBP and FG level on average, respectively).14 Similarly, Buford and colleagues examined the association between mtDNA variants measured by sequencing and SBP and mean arterial pressure across several ancestries (European (n =1739), African (n = 683), and others (n = 121)).42 They detected a statistically significant association of mtDNA variants with higher SBP (e.g. m.93 A>G in hypervariable segment II (HVII); P-value = 0.0001) and mean arterial pressure (e.g. m.16172T>C in a hypervariable segment I (HVI); P-value = 0.0002), respectively within African-ancestry samples.42 Interestingly, these specific variants were low-frequency in the other race groups and not associated with these traits. Overall, these studies are supportive of a role for mtDNA variants in BP and FG; however, similar associations were not extrapolated to response to AHT treatment in our study.
This study is not without limitations. First, the coverage of mtDNA variants was restricted to GWAS data. Overall, there are no “gold standard” methods for calling mtDNA haplogroup with GWAS data and we used standard methodology adopted by another study for the same GWAS array.43 Ultimately, deeper genomic coverage may enhance SNP and haplogroup detection using available software. Further, FG was missing on a considerable number of samples in our study. This is a limitation of the ALLHAT study since BP and cardiovascular disease outcomes were the main focus. Still, several published studies have made use of the available glucose data in this large, NIH-funded clinical trial.5,44–46 Despite these limitations, this study remains the largest AA pharmacogenomics study to examine mtDNA variants and haplogroups with BP and FG response.
In summary, this study represents the most extensive investigation of the role of the mitochondrial genome in BP and FG response to chlorthalidone (a thiazide diuretic) within AAs. The overwhelming percentage of AAs suffering from HTN reveals the urgency to discover causal determinants of better BP response to treatment. Despite the urgency, there remains a lack of pharmacogenomic studies within hypertensive AAs. Hence, this study provides the inclusive research that is required to aid understanding of AHT treatment response and eventually facilitate better blood pressure control. The discoveries presented in this study support future investigations of mitochondrial genomics in metabolic response to chlorthalidone among AAs.
dbGaP: Genetics of Hypertension Associated Treatment (GenHAT) Study, Genomic Background of Blood Pressure Response to Treatment in African Americans, accession number: phs002716; https://identifiers.org/dbgap:phs002716 (contact: Marguerite R Irvin, [email protected]).
| Views | Downloads | |
|---|---|---|
| F1000Research | - | - |
|
PubMed Central
Data from PMC are received and updated monthly.
|
- | - |
Provide sufficient details of any financial or non-financial competing interests to enable users to assess whether your comments might lead a reasonable person to question your impartiality. Consider the following examples, but note that this is not an exhaustive list:
Sign up for content alerts and receive a weekly or monthly email with all newly published articles
Already registered? Sign in
The email address should be the one you originally registered with F1000.
You registered with F1000 via Google, so we cannot reset your password.
To sign in, please click here.
If you still need help with your Google account password, please click here.
You registered with F1000 via Facebook, so we cannot reset your password.
To sign in, please click here.
If you still need help with your Facebook account password, please click here.
If your email address is registered with us, we will email you instructions to reset your password.
If you think you should have received this email but it has not arrived, please check your spam filters and/or contact for further assistance.
Comments on this article Comments (0)