Keywords
Science education, Literature profiling, Information extraction, Transcriptional profiling
This article is included in the Bioinformatics gateway.
Science education, Literature profiling, Information extraction, Transcriptional profiling
Today biomedical researchers can routinely generate data at the scale of entire systems (genomes, transcriptomes, microbiomes, epigenomes etc …). And they can do so at increasingly higher resolutions (e.g., at the single-cell level). They have in addition access to large collections of omics datasets that are rapidly accumulating in public repositories. These trends are driving the need for more trained computational biologists to enter the field, as well as for raising the level of data science proficiency of mainstream bench or clinical scientists. The latter may be achieved by helping researchers develop skills used for handling and analysing large-scale datasets. But it may also be beneficial for them to develop skills for retrieving, structuring, and interpreting information derived from public data repositories as well as the biomedical literature. To address this need we have developed a training curriculum and self-study guide. The use case our training guide is based upon consists in developing a resource to evaluate the potential utility of a given gene as a blood transcriptional biomarker – which can also help determine the merits of including this gene in a targeted assay. Trainees start by selecting a candidate gene to focus on. Specifically, they will learn: 1) To identify the literature associated with a gene of interest, 2) To extract relevant information from the literature and record it in a structured format, 3) To access public transcriptional profiling data for a given gene and record relevant information in a structured format, 4) To aggregate information derived from the literature and from transcriptional profiling data interactive circle packing plots, 5) To write a narrative based on structured information extracted from the literature and public transcriptional profiling data, and 6) To publish a report in a peer-reviewed journal.
The main steps of the workflow that is described in more detail in this article are: Step 1: Selecting a candidate gene; Step 2: Retrieving background information and writing a generic narrative about the candidate gene; Step 3: Retrieving and profiling the candidate gene literature, exploring association with disease and relevance as a biomarker; Step 4: Identifying in the literature instances where abundance of the candidate gene transcript is reported to change in blood of patients, capturing, structuring and aggregating relevant information; Step 5: Retrieving transcriptional profiling data for the candidate gene, capturing, structuring and aggregating relevant information.
Undertaking this training activity does not require prior bioinformatics training. The curriculum that is described here can serve as a basis for the organization of a training workshop or used as a self-study guide. Although omics profiling data is used as source material the activities do not involve analyzing large scale datasets, as trainees will rather focus on an individual candidate gene. An illustrative use case is provided, that shows steps involved in evaluating the potential relevance of CEACAM6 as a blood transcriptional biomarker. Trainees may follow the same steps selecting any other candidate gene.
Hands-on activities will consist in retrieving information for a single gene. Thus, as a first step trainees will need to select the candidate gene they will be focusing on as they follow the rest of the curriculum.
The theme chosen and on which the CEACAM6 use case is based is ‘blood transcriptional biomarker discovery’. The workflow described below is thus specifically designed to develop a resource that will permit to assess the relevance of a given gene as a blood transcriptional biomarker (but it could easily be adapted for a different theme). Several review articles can be consulted for a primer on blood transcriptomics.1–3 Briefly, it consists in measuring leukocyte transcript abundance in whole blood on a genome-wide scale. Changes may be associated with ongoing immune processes. It is therefore a valuable tool for comprehensively monitoring the immune status of patients, in association, for instance, with disease pathogenesis or response to treatment. Measuring transcriptional changes in bulk blood samples (unfractionated) is especially straightforward and amenable to downstream diagnostic applications (e.g., for sepsis, with the Septicyte Lab and Sepsis Metascore signatures,4,5 or for the monitoring of cardiac transplant recipients with the Allomap signature6). Using RNA sequencing technologies blood transcriptome profiles can be generated routinely and cost-effectively. Altogether this has contributed to the application of blood transcriptomics across virtually all fields of medicine - from measuring changes in transcript abundance associated with pathogenesis among autoimmune, infectious as well as neurologic diseases, to monitoring responses to treatments or lifestyle changes.1 And this is reflected in the large numbers of blood transcriptomic datasets available in public repositories.
Regarding the selection of a candidate, for this given theme the main criterion would be that transcripts for the selected gene are detectable in blood. Different tools or resources can be used to check this. A suggestion would be to access transcriptional profiles via the ‘GXB’ Gene Expression Browser web application.7 This application will be used extensively in the subsequent steps as well. Specifically, the following reference dataset may be employed, for which transcript abundance has been profiled in whole blood and leukocyte populations in healthy subjects and patients with sepsis, multiple sclerosis, Type 1 diabetes or ALS: http://cd2k.gxbsidra.org/dm3/geneBrowser/show/4000098. To check levels of expression of a given gene trainees would simply type its official symbol in the search box at the top left of the screen (if necessary additional details are provided in Step 5, as well as in the main reference for this resource7 and a collection of demonstration videos: https://www.youtube.com/playlist?list=PLtx3tvfIzJ9XkRKUz6ISEJpAhqKyuiCiD).
Other considerations are provided below that cover some of the questions trainees may have regarding the selection of a candidate:
- The candidate gene may be selected based on prior knowledge/interest from the trainee or could simply be chosen randomly.
- It may also purposedly be chosen among a pre-defined gene set, being a signature, a module or diagnostic panel that has already been previously published - it is optional but for instance a group of trainees could then work independently on different members of this panel/signature).
- The candidate gene does not have to be reported and known in the literature as a biomarker. Accessing transcript abundance profiles will permit to determine whether it is changed in pathological conditions in absence of reports from the literature.
- A gene can be selected even if it was the object of an earlier report published by another trainee. Different trainees may bring different and possibly complementary perspectives (the earlier report would just need to be cited and acknowledged).
- Some genes have no or very limited associated literature. This can be determined early on, while working on step 3. If that is the case the trainee may consider choosing another candidate, since it would limit obviously the development of skills involved in literature profiling. However, it would still be suitable to select such transcript, and maybe spend more time with the profiling of available transcriptional data instead (Step 5).
Thus, in this first step, trainees pick a gene to focus on and. As detailed below, they will next retrieve general background information for the candidate gene and profile its associated literature at a high level, to support the writing of an introduction section. They will then extract relevant information from the literature as well as transcriptome data repositories that will permit to assess its relevance as a transcriptional biomarker. Capturing this information in a structured format and representing it graphically throughout these different steps will support downstream interpretation and manuscript preparation.
Illustrative use case: the transcript selected for our illustrative use case is CEACAM6 (https://www.ncbi.nlm.nih.gov/gene/4680). It is comprised in a blood transcriptional signature that is associated with neutrophil activation (Module M10.4 from the fixed BloodGen3 blood transcriptional module repertoire.8 The goal is therefore to gather information that would permit to assess its potential as a blood transcriptional biomarker in various disease settings. Trainees may choose, for instance, to select other genes comprised in module M10.4, or in any of the 382 modules that form the BloodGen3 repertoire.
Hands-on training activities are meant to lead to the preparation of a report and ideally of a manuscript that would be submitted to a peer-reviewed journal for publication. The introduction section of this report/manuscript would first provide some general background about the candidate gene. This is what this second step will focus on.
2a: Finding general background information: First, summaries for the gene can be obtained from reference databases such as NCBI Entrez Gene [https://www.ncbi.nlm.nih.gov/gene/], OMIM [https://www.omim.org/], and Uniprot [https://www.uniprot.org/]. Second, it can also be useful to identify recent publications for the gene in question and capture the paragraphs in the introduction sections that provide an up-to-date summary about the gene along with relevant references. For this, a PubMed query searching the official gene name or symbol in titles of articles can be run (e.g., for our use case: CEACAM6 [ti] OR “CEA Cell Adhesion Molecule 6” [ti]; with [ti] being a field restrictor that permits to limit the search to the title of the articles).
2b: Aggregating information: Next, gene summaries and introductory paragraphs will be captured and aggregated. Throughout this curriculum the Prezi web application will be used to aggregate information gathered about the selected candidate gene. The interactive presentations thus generated will serve as a resource, for readers who wish to assess the potential relevance of the candidate gene as a biomarker, and for the trainees who will access this information to support the writing of the manuscript. It will also permit to visualize information and could be used as a basis for preparing figures for the manuscript.
Practically, regarding aggregating the gene summaries from the sources mentioned above:
- A Prezi account needs to be created unless the trainee already has one. A basic account can be setup for free: https://prezi.com/pricing/basic/. Briefly, Prezi is a web application designed for creating interactive presentations. A notable feature is that it permits to dynamically zoom in and out presentation elements (called topics) and thus establish hierarchies. These functionalities permit in turn to create “circle packing plots”, which will be used throughout this curriculum for aggregating different types of information.
- A presentation or circle packing plot can easily be created “from scratch” by adding and populating circles (topics) and organizing them in a hierarchy. An example is provided here, which may be copied and used as a template: https://prezi.com/view/pQ7TKEC6tgY3cuik9ckt/ (Figure 1).
- The circle that will be created to aggregate background information about the candidate gene is labelled ‘Step 2: Gathering Background Information’.
- The circles are populated in this case simply by uploading or copy/pasting high resolution screenshots showing gene summaries from multiple sources (reference databases, introduction sections, reviews etc …).
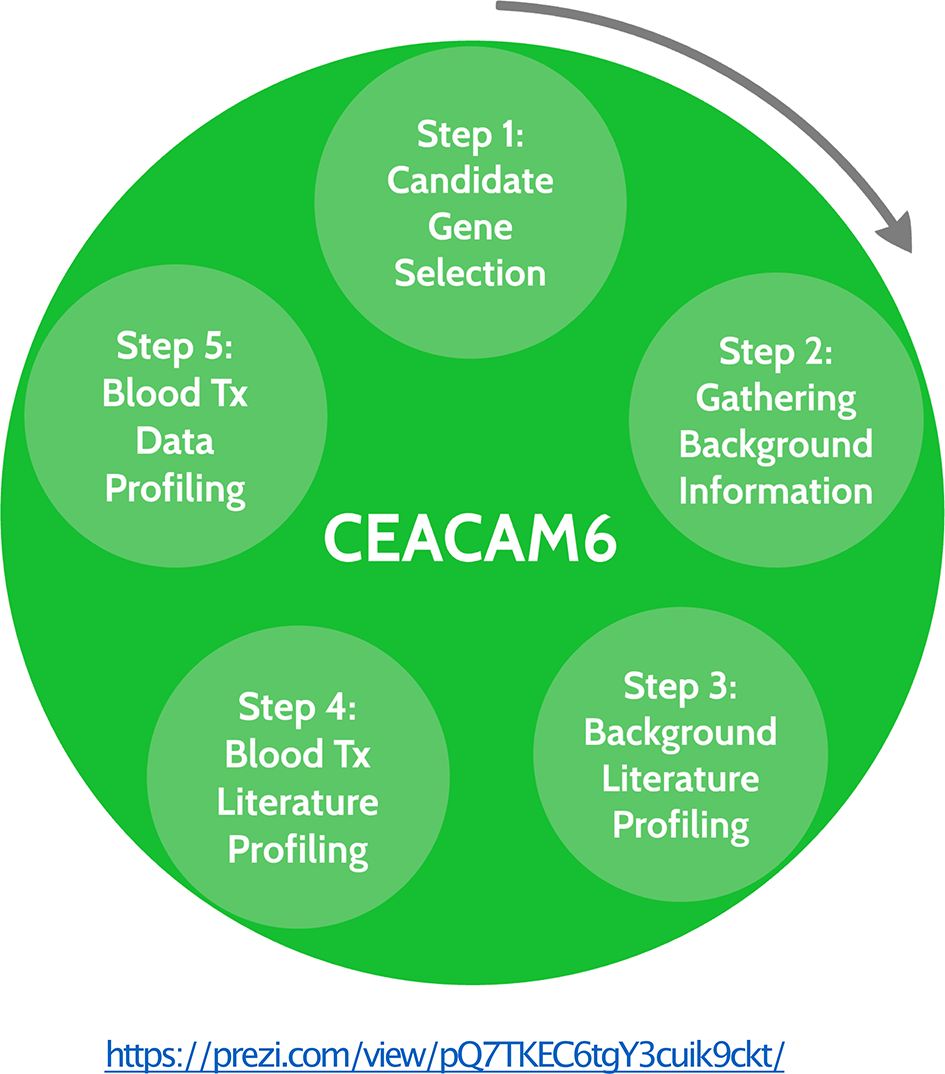
For a given candidate gene an interactive circle packing plot is created using the Prezi web application. It permits to aggregate structured information extracted from the literature as well as transcriptome profiling datasets. The plot generated for the CEACAM6 use case can be accessed at this url: https://prezi.com/view/pQ7TKEC6tgY3cuik9ckt/. This presentation can also be copied by trainees and used as a template.
2c: Writing up a short narrative: The trainees will next write a short narrative (~ half a page) using relevant references and drawing from the information identified and aggregated in 2a and 2b.
In the context of our chosen theme (blood transcriptional biomarkers), the manuscript would also examine associations of the candidate gene with diseases, cell types and processes – which are some of the main factors driving changes in transcript abundance in blood (with pathogenesis being associated with either regulation events [e.g., response to interferons during a viral infection] or relative changes in abundance of leukocyte populations (e.g., expansion of the number of antibody producing cells in response to vaccination9).
To generate this narrative, trainees will rely on literature profiling. Profiling will be performed first at a high level, identifying the main diseases, cell types, or biological processes the candidate gene has been associated with. Secondly, going more in depth it will permit to explore whether the candidate gene is already used as a biomarker, or potentially being considered as one - whether at the gene, transcriptional, or protein level, and in blood as well as other tissues and sample types.
Practically, the literature profiling workflow that will be employed here has been detailed in a separate study guide.10 Thus, only abbreviated instructions will be provided here:
3a: Retrieving the relevant literature: first the literature associated with the candidate gene must be retrieved from PubMed. For this, trainees will design a PubMed query incorporating official gene symbol and name as well as all known aliases for the gene in question. It will be necessary to examine results returned by the query and, if needed, perform some troubleshooting to minimize false positive and false negative results. For this and subsequent steps, detailed instructions can be found in the literature profiling study guide published earlier.10
CEACAM6 use case: the PubMed query designed for CEACAM6 is shown below. Notably, the arguments “AND (Carcinoembryonic OR CEACAM6 OR CD66c)” have been added to minimize false positive results returned by the query terms “NCA”, “Normal Cross-Reacting Antigen” and ("Non-Specific Crossreacting Antigen". Search is restricted to titles and abstracts (using the field restrictor [tiab]. Another valid field restrictor being [tw], for “text word”).
CEACAM6 [tiab] OR “CEA Cell Adhesion Molecule 6” [tiab] OR CD66c [tiab] OR (NCA [tiab] AND (Carcinoembryonic OR CEACAM6 OR CD66c)) OR “Carcinoembryonic Antigen-Related Cell Adhesion Molecule 6” [tiab] OR “Carcinoembryonic Antigen Related Cell Adhesion Molecule 6” [tiab] OR “Carcinoembryonic Antigen-Related Cell Adhesion Molecule 6” [tiab] OR ("Normal Cross-Reacting Antigen" [tiab] AND (Carcinoembryonic OR CEACAM6 OR CD66c)) OR ("Non-Specific Crossreacting Antigen" [tiab] AND (Carcinoembryonic OR CEACAM6 OR CD66c)) OR (CEAL [tiab] AND (Carcinoembryonic OR CEACAM6 OR CD66c)) NOT review [pt]
3b: Extracting keywords from titles: a systematic approach is employed to extract information that will be used to further develop the introduction section of the manuscript/report. For this, themes are selected a priori, such as ‘diseases’, ‘cell types’, ‘biological processes’, ‘tissues’, and ‘biomolecules’. Relevant subjects in the context of blood transcriptomics research could for instance be ‘diseases’ and ‘cell types’. Next, trainees will scan the titles of articles in which the gene symbol, name or aliases are found for keywords related to entities relevant to a selected theme. Thus if ‘diseases’ is selected as a theme, keywords such as ‘breast cancer’ or ‘breast carcinoma’ would be recorded, when found in titles of articles also containing the symbol, name, or alias for the candidate gene. These different keywords would be recognized as belonging to a single disease entity, which in this case would be ‘breast cancer’. Scanning titles of the entire collection of articles associated with the candidate gene should yield an ensemble of entities across several themes that will be used next in 3c. A similar process would be repeated using ‘cell types’ as a theme. And so on.
Practically, the PubMed query designed in 3a will be used here but restricting the search to titles (using the delimiter [ti] instead of [tw] or [tiab]). Focusing on a chosen theme trainees can scan the titles of the articles returned by this search and record any relevant keywords in a spreadsheet
A few useful tips:
- To save time, a given keyword can be recorded only the first time it is encountered.
- Trainees can choose to scan titles focusing on only a given theme or can do so for multiple themes simultaneously but recording the keywords separately.
- When a very large number of publications are associated with the candidate gene, even after restricting the search to titles, trainees can decide to cap the number of articles to be scanned (e.g., to the 500 or 200 most recent publications; they would just need to indicate this in the report).
CEACAM6 use case: diseases and cell types were the two themes selected for this illustrative use case. The keywords that have been extracted are listed in Extended data File 1.19
And once again, more details and another use-case focusing on ISG15 are provided in the study guide that is dedicated to this topic.10
3c: Generating literature profiles: Next, it can be useful to identify the entities (diseases, cell types etc …) that are the most prevalent in the literature associated with the candidate gene.
Practically, the query designed in 3a is used here again, restricting searches to titles and abstracts ([tiab]) and adding as an argument the Boolean “AND” followed by the keywords associated with a given entity (e.g. AND (“breast Carcinoma [tiab] OR “breast cancer” [tiab]). The number of articles returned is recorded before moving on to the next entity. The output should be a list of entities ranked by the number of PubMed articles returned.
CEACAM6 use case: The cell type and disease entities associated with CEACAM6 are listed in a separate file along with their prevalence in the CEACAM6 literature (Extended data File 2).20
3d: Extracting and structuring information relating to actual or potential utility of the candidate gene as a biomarker.
Biomarker discovery serves as the context for this training workflow. It is thus indicated to take the process described thus far one step further by focusing on a subset of the literature about the candidate gene and some of the diseases it is most often associated with. In the corresponding articles trainees will look for material that mention potential or actual use of the candidate gene as a biomarker – being at the gene, transcript, and protein level and in any type of biological samples. And to facilitate the writing of this section the relevant information will be sought and recorded in a structured format.
Practically:
- a choice can be made to focus on the diseases that show the highest prevalence in the literature associated with the candidate gene (for instance based on a cut-off for the number of articles).
- The queries employed in the previous step to determine the frequency of articles for a given disease entity can be used as a starting point. Results will be narrowed down by adding another Boolean argument AND to search among this literature articles containing in titles or abstracts the words: (biomarker [tiab] OR biomarkers [tiab] OR diagnostic [tiab] OR diagnosis [tiab] OR prognostic [tiab] OR prognosis [tiab]).
- Trainees will next review each article returned by the query and determine its relevance (i.e., describe the use or potential utility of the candidate gene as a biomarker in the disease in question).
- If the article is deemed relevant trainees will look for and capture specific information in a spreadsheet format. A template is provided, that will be used in this step as well as in steps 4 and 5 (Extended data File 3).25 The information captured includes the analyte type, sample type, organism species, comparator group as well as information regarding the type of test conducted, and results. This information is not always found in the title and abstract and, in some cases, trainees may need to access the full text of the article to extract some of the information (if it is available to them).
- The process is repeated for each of the main disease entities associated with the candidate gene.
The information captured in the spreadsheet will later be used as a basis for writing the rest of the narrative for this section (step 3f below). Specifically, it will be covering general background knowledge about the candidate gene use as a biomarker.
CEACAM6 use case: (Extended data File 4).21
3e: Aggregating information and generating graphical representations
To support downstream data interpretation and permit the generation of graphical representations, the information gathered in 3d will next be aggregated in the candidate gene’s master interactive circle packing plot (this will be the case throughout the workflow established for this curriculum).
Practically, the interactive Prezi presentation created earlier will be used again here. A new circle is created (labelled ‘Step 3: Background literature profiling’) and at the first level down populated with circles corresponding with the different themes (diseases, cell types, etc …). At the second level down, within each theme, circles are added for each entity identified in 3c, with the size and colour of each circle corresponding to the extent of the literature that is associated with it (Figure 2). Links to PubMed query results, as well as literature highlights can be found in turn within each of the entities circles (third level). Literature highlights include notable articles that address most directly the association between the candidate gene and the entity in question. And finally, for entities that are most prevalent in the literature associated with the candidate gene, a fourth level down is added within relevant entities to cover the literature identified in 3d that describes the use or potential use of the candidate gene as a biomarker.
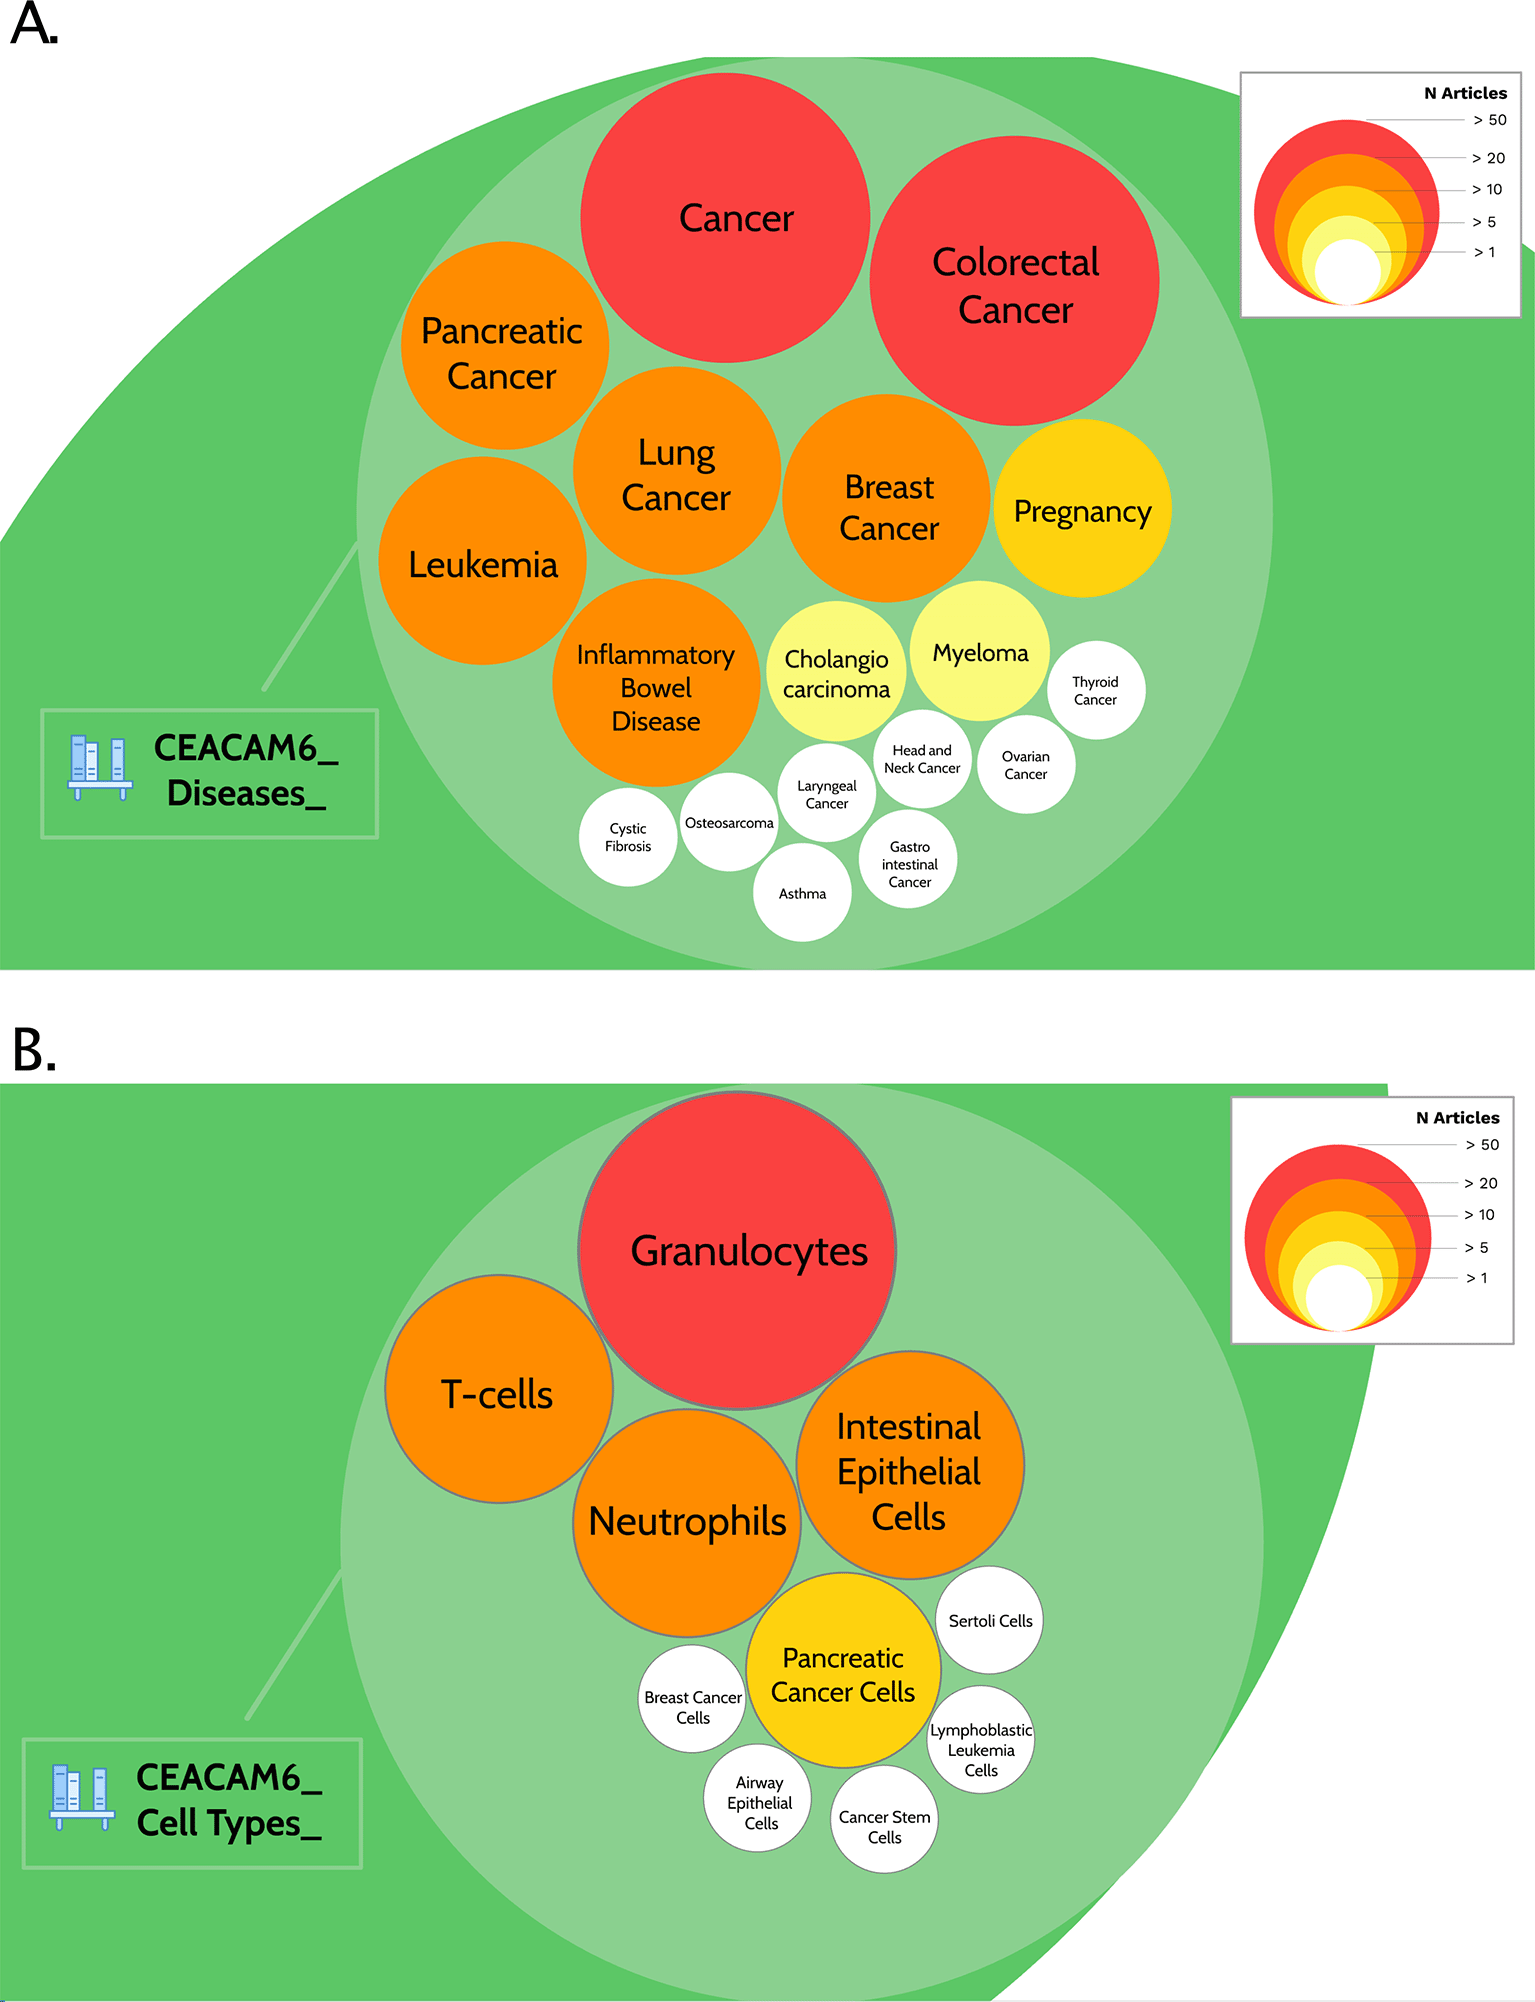
Content of the CEACAM6 circle packing plot here is show, for step 3, which consists in generating background literature profiles. In this case, the prevalence of articles among the literature associated with CEACAM6 for disease entities (A) or cell type entities (B) are represented by circles of different sizes and colours, corresponding to different number of articles. It is possible to access underlying information by zooming into each of the circles. The Prezi presentation can be accessed at this url: https://prezi.com/view/pQ7TKEC6tgY3cuik9ckt/
CEACAM6 Use case: The hierarchy of circle packing plots described above can be explored by navigating the circle corresponding to Step 3 in the CEACAM6 circle packing plot: ‘Step 3: Background literature profiling’. And representations of prevalence of disease and cell type entities in the CEACAM6 within the circle are shown in Figure 2.
3f: Writing a narrative
Step 3 should conclude with the writing of a narrative: 1) identifying the main disease, cell type or biological processes entities associated with the candidate gene’s literature, and 2) exploring in more depth for the main disease entities the actual or potential clinical relevance of the candidate gene as a biomarker – at the gene, transcript, or protein level, in blood as well as other tissues or biological samples.
Practically, trainees will rely for writing this narrative on the supporting material developed earlier, including 1) from 3c: the literature profiles that permitted the identification of the dominant entities across the different themes; 2) from 3e: literature highlights associated with these entities, that were added to circle packing plots and may be cited in the text; 3) from 3d: the spreadsheet in which relevant information extracted from articles was recorded in a structured format. Indeed, this information can, for instance, be used as a first step to form “standard” sentences, to be summarized and polished in a second step (for more details and templates see10:).
Researchers could base their decision to include a candidate gene in a blood transcriptional diagnostic panel on several criteria. Finding literature that reports abundance of transcripts for these genes to be changed in relevant pathologies, and to be of potential clinical utility as a biomarker, could be one of them. Therefore, this step will focus on parsing this information from the literature, recording it in a structured format and aggregating it. There are notable differences with the profiling carried out earlier in step 3d. Indeed, the search will this time be conducted in the full text of the articles (rather than being restricted to titles and abstract) and it will focus on changes of transcript abundance in blood (not considering changes at the gene or protein level, or in other tissues or sample types).
4a: Literature search: In step 3 literature profiling was conducted using PubMed to identify disease from the titles of the articles associated with the candidate gene. Here Google Scholar is used instead as it permits to conduct searches in the full text of the article (i.e., the keywords may be found in the title and abstract, but also in the result section, figure legends, or tables, for instance). Several search strategies can be devised. In our use case, taking the official gene symbol along with the terms “blood” and “transcriptomics” yielded a rather large body of literature, including many relevant entries. As in literature queries designed in earlier steps, the use of aliases could also be considered, but in published transcriptome profiling studies, which this search would preferentially target, use of the official symbol would be most likely.
CEACAM6 Use Case: For instance, for CEACAM6 the query “CEACAM6 blood transcriptomics” (without quotation marks) returned over 884 “hits”. Adding the alias CD66C returns a small number of hits (37) since this query would retrieve records containing both CEACAM6 AND CD66C. Running separately the query “CD66C blood transcriptomics” would thus be more appropriate (124 hits). Notably the query “CEACAM6 blood transcriptome” returned 728 results with extensive overlap with the results obtained above.
4b: Parsing search records: In the next step, trainees go through the search results and determine which records are relevant. That means confirming for each record1: that the symbol of the candidate gene is found in the text of the article,2 that abundance of the corresponding transcript was measured in blood of human subjects, and3 that the record is a peer-reviewed research article (conference abstracts, pre-prints or review articles are excluded). If it is the case, then the entry can be saved (for instance copying the link to the full text, or PubMed ID in a spreadsheet) and the next record examined in a similar fashion. Or trainees may prefer to move directly to the next step and extract the relevant information in a structured format (4c). Records for which one of the above criteria is not met are disregarded.
4c: Recording the information in a structured format: Relevant information is extracted from the valid records identified in the previous step (4b) and recorded in a spreadsheet. The same spreadsheet template from step 3d is used here (Extended data File 3).25
CEACAM6 Use case: For illustrative purposes, a partially populated template is available for CEACAM6 (Extended data File 5).21
4d: Aggregating the information: Next, circles are added to the circle packing plot to continue with the information aggregation process, and to generate graphical representations of the information. The approach is the same as the one employed in Step 3. This time a circled labelled ‘Step 4: Blood Tx literature profiling’ is added to the presentation.
CEACAM6 Use Case: An example can be found in the CEACAM6 interactive circle packing plot (partially populated for illustrative purposes): https://prezi.com/view/pQ7TKEC6tgY3cuik9ckt/
4e. Writing a narrative: A narrative is generated based on the information that is captured and structured in the spreadsheet in step 4c and aggregated in step 4d. As described in step 3f and in,10 one approach could consist in generating standard sentences which serve as a starting point for developing a coherent narrative capturing all the essential information.
The decision to include a candidate gene in a biomarker panel can also be informed by available transcriptional profiling data. This step will consist in gathering data from public blood transcriptome datasets. Focusing on the candidate gene, information will be recorded in a spreadsheet using the format adopted in the previous steps. Additional datasets could be employed to determine restriction of the expression of the candidate gene in blood leukocyte populations and its regulation in vitro in response to immune stimuli.
5a: Accessing and retrieving transcriptional profiling data: Large volumes of transcriptome profiling data are held in several large public repositories. The more established and largest of them being NCBI’s Gene Expression Omnibus (https://www.ncbi.nlm.nih.gov/geo/), EMBL-EBI’s ArrayExpress (https://www.ebi.ac.uk/arrayexpress/), and the Genome Sequence Archive (https://ngdc.cncb.ac.cn/gsa/). While this data is publicly available, it is not always easily accessible. Indeed, aligned read files have been deposited for some but not all studies. When it is not provided the raw sequencing files for the entire dataset need to be downloaded and processed (alignment and normalization). This represents a lot of work to obtain the transcript abundance profile of only one gene. Data browsing web applications can then prove especially useful as they make it straightforward for users to access the transcript abundance profiles for a candidate gene in a few clicks. For instance, GXB [Gene eXpression Browser] data browsing applications have been deployed that cover different subjects matters. These can be used in the context of the present training activities and are listed in Table 1. Each GXB instance focuses on a specific theme. The number of datasets covered (in the hundreds) is rather limited compared to what is available in public repositories. But since most of these collections touch upon themes that are immunologically relevant these resources are suitable for use in the context of this training activity. The profile of a candidate gene can be accessed via GXB as follows:
- 5a.1: Opening the desired GXB web instance using the corresponding URL listed in Table 1 (the CD2K instance [http://cd2k.gxbsidra.org/dm3/geneBrowser/list] holds blood transcriptome profiling data for reference patient cohorts and could be a good starting point).
- 5a.2: Accessing profiles for a given dataset listed on the home page of the instance: clicking on the corresponding record (it is also possible to sort, filter or search the records; a detailed description of GXB functionalities can be found here7:).
- 5a.3: Displaying the transcript abundance profile for a given gene. It is possible to look up the candidate gene by entering its official symbol in the search box at the top left and visualise the transcript abundance profile as a bar plot or box plot. A short video demonstration is provided as a supplement: Extended data File 6.22
- 5a.4: Downloading source data for a given gene. Clicking the button with the down arrow marked “CSV” starts the download of a comma-delimited file containing the expression profiling data for the candidate gene along with sample information. A video demonstration can be found here: Extended data File 7.23
| Topic | # Profiles | PubMed IDs | URLs |
|---|---|---|---|
| Inborn errors of immunity | 1026 | 31559014 | http://pid.gxbsidra.org/dm3/geneBrowser/list |
| IgE-mediated atopy | 1860 | 31290545 | http://ige.gxbsidra.org/dm3/geneBrowser/list |
| Viral respiratory infection | 6648 | 31231515 | http://vri1.gxbsidra.org/dm3/geneBrowser/list |
| Breast cancer | 2142 | 29527288 | http://breastcancer.gxbsidra.org/dm3/geneBrowser/list |
| Polycystic ovary syndrome | 85 | 28413616 | http://ivf.gxbsidra.org/dm3/landing.gsp |
| Neonatal hematopoiesis | 2129 | 27347375 | http://developmentalimmunology.gxbsidra.org/dm3/geneBrowser/list |
| Monocytes | 4516 | 27158452 | http://monocyte.gxbsidra.org/dm3/landing.gsp |
| Placenta differentiation | 759 | 27303626 | http://placentalendocrinology.gxbsidra.org/dm3/landing.gsp |
| HIV | 2717 | 27134731 | http://hiv.gxbsidra.org/dm3/geneBrowser/list |
| Sepsis | 5719 | 34663591 | http://sepsis.gxbsidra.org/dm3/geneBrowser/list |
| “CD2K” | 7585 | Unpublished | http://cd2k.gxbsidra.org/dm3/geneBrowser/list |
| Neutrophils | 1139 | Unpublished | http://neutrophil.gxbsidra.org/dm3/geneBrowser/list |
CEACAM6 Use case:
Notes:
- Instructions provided here are specifically for the retrieval or transcriptional profiling data from GXB. But trainees should feel free to employ alternate tools, approaches, or resources.
- To address some of the shortcomings of public of RNAseq data repositories, Lachmann et al. have developed the ARCHS4 portal.11 They make available through this web resource a large collection of GEO datasets that they have downloaded and processed using a uniform pipeline.
- Other popular transcriptional profiling data browsers include BioGPS (http://biogps.org/#goto=welcome),12 ImmPort (https://www.immport.org/shared/home),13 and the Immunological Genome Project browser (https://www.immgen.org/).14
5b: Determining significance: To correctly interpret the results, it is important to determine next whether transcript abundance levels retrieved in the previous step are different between study and experimental groups. For instance, in the context of patient studies abundance levels between cases and controls would be compared. In other studies where investigators profiled isolated leukocyte populations, the transcript abundance levels between the different populations would be compared instead to determine if the gene is preferentially expressed. Various tools can be used to run statistics. It can, for instance, simply be done using functions in MS Excel (see use case).
CEACAM6 use case: for illustrative purposes t-tests were performed in Excel starting from the.csv files downloaded in the previous step (and saved as.xlsx). This was done for each of the 16 disease cohorts available in the CD2K GXB instance (Extended data File 8).24
Notes:
- To assess restriction of a candidate gene across cell population using a reference dataset available in GXB (http://cd2k.gxbsidra.org/dm3/geneBrowser/show/4000098) additional normalization steps may be performed (e.g., normalizing counts to the median across all conditions and running statistics to compare normalized counts for a given cell type compared to all other cell types).
- For another dataset, where changes in transcript abundance were measured in whole blood in vitro in response to a wide range of immune stimuli, the number of replicates is too small to run statistics and fold changes are represented instead (with a difference expression cut-off [Stim – Non-Stim Control > 50] (http://cd2k.gxbsidra.org/dm3/geneBrowser/show/4000202).
5c: Recording the information in a structured format: As was the case earlier, the relevant information is recorded in a spreadsheet (sample type, method, species, comparison groups etc …). This information will serve as basis for drafting the result section (Step 5e).
The template employed for recording information in Steps 3&4 is used here again (Extended data File 3).25
CEACAM6 use case: a file is shared which includes entries for multiple datasets (not exhaustive). (Extended data File 9).26
5d: Aggregating the information: Next, information recorded in 5b, regarding differential expression of the candidate gene across multiple reference datasets is compiled in the candidate gene’s master circle packing plot. A circle is created that is labelled ‘Step 5: Blood Tx data profiling’. The information is represented visually, this time with colours corresponding two fold change in transcript abundance relative to controls, for genes showing significant differences.
Practically, each circle corresponds to a given study or experimental group for which a comparison has been performed. They are arranged in a radial pattern within a circle which itself corresponds to a given dataset. A GXB link is inserted in the next level down for each group along with a screenshot. Users can access the interactive version of the figure via the link (it should be a mini-URL generated from the GXB that will capture the display setting in use at the time it is generated: from the ‘Tools’ drop-down menu on the top right select ‘Copy Link’).
CEACAM6 use case: The master circle packing plot for CEACAM6 includes a circle for Step 5 that is partially populated for illustrative purposes (https://prezi.com/view/pQ7TKEC6tgY3cuik9ckt/).
Notes:
- The GXB plots are not ‘publication-grade’. As an exercise trainees could choose to generate high quality plots using Python, R or Plotly, for instance (Figure 3). The latter was used to generate plots for the CEACAM6 use-case (https://chart-studio.plotly.com/create/#/). It would also be a good opportunity to practice generating figure legends using the information captured in the spreadsheet populated in Step 5c.
- In addition to extracting abundance profiles from blood transcriptome datasets across various diseases it may also be useful to determine restriction of expression of the candidate gene in different cell populations, for instance in this dataset: http://cd2k.gxbsidra.org/dm3/geneBrowser/show/4000098 (and see also Figure 4). Patterns of induction in whole blood exposed in vitro to with a wide of immune stimuli could be examined as well, for instance in this dataset: http://cd2k.gxbsidra.org/dm3/geneBrowser/show/4000202.
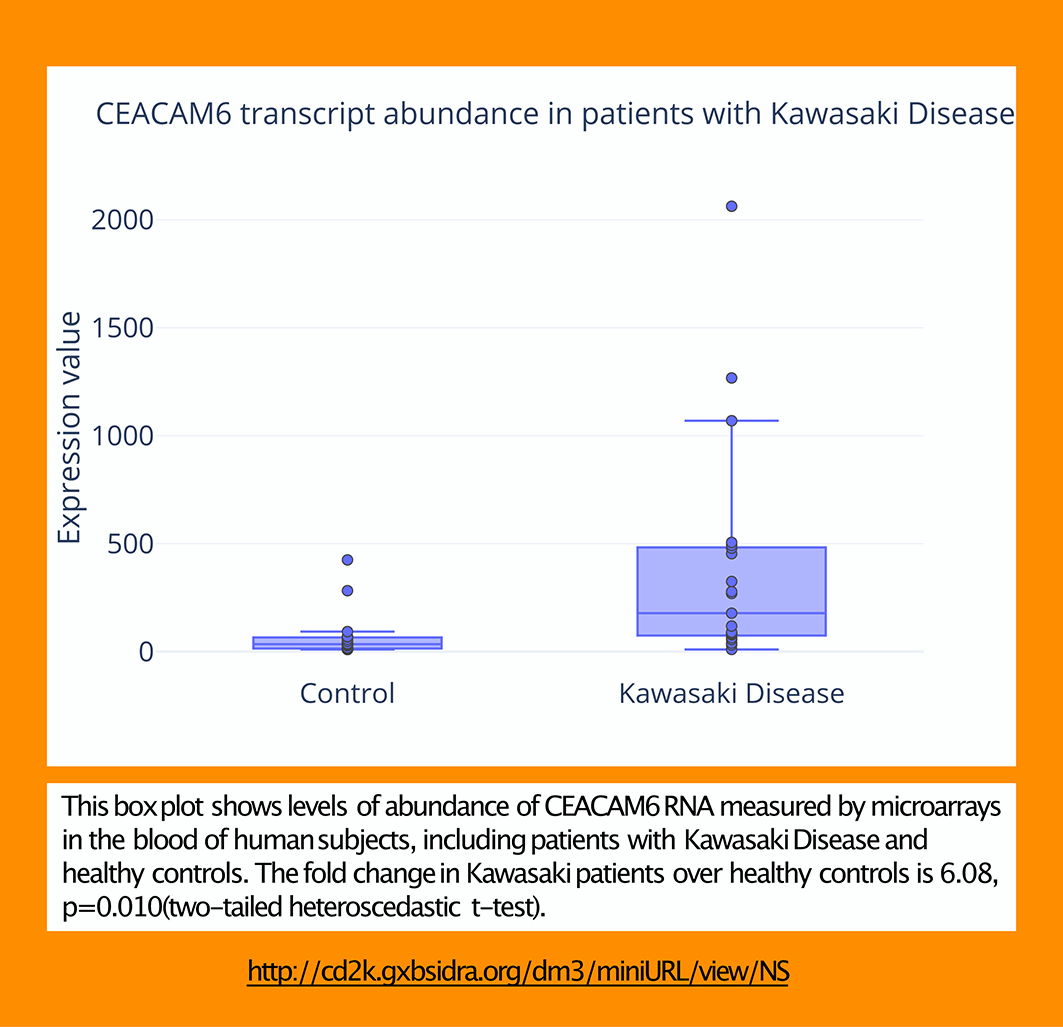
An optional step consists in generating ‘publication grade’ plots using tools such as MS Excel or Plotly (as is the case here: https://chart-studio.plotly.com/create/#/, https://plotly.com/~dchaussabel/148/). The legend is generated using structured information captured in the spreadsheet used in Step 5.
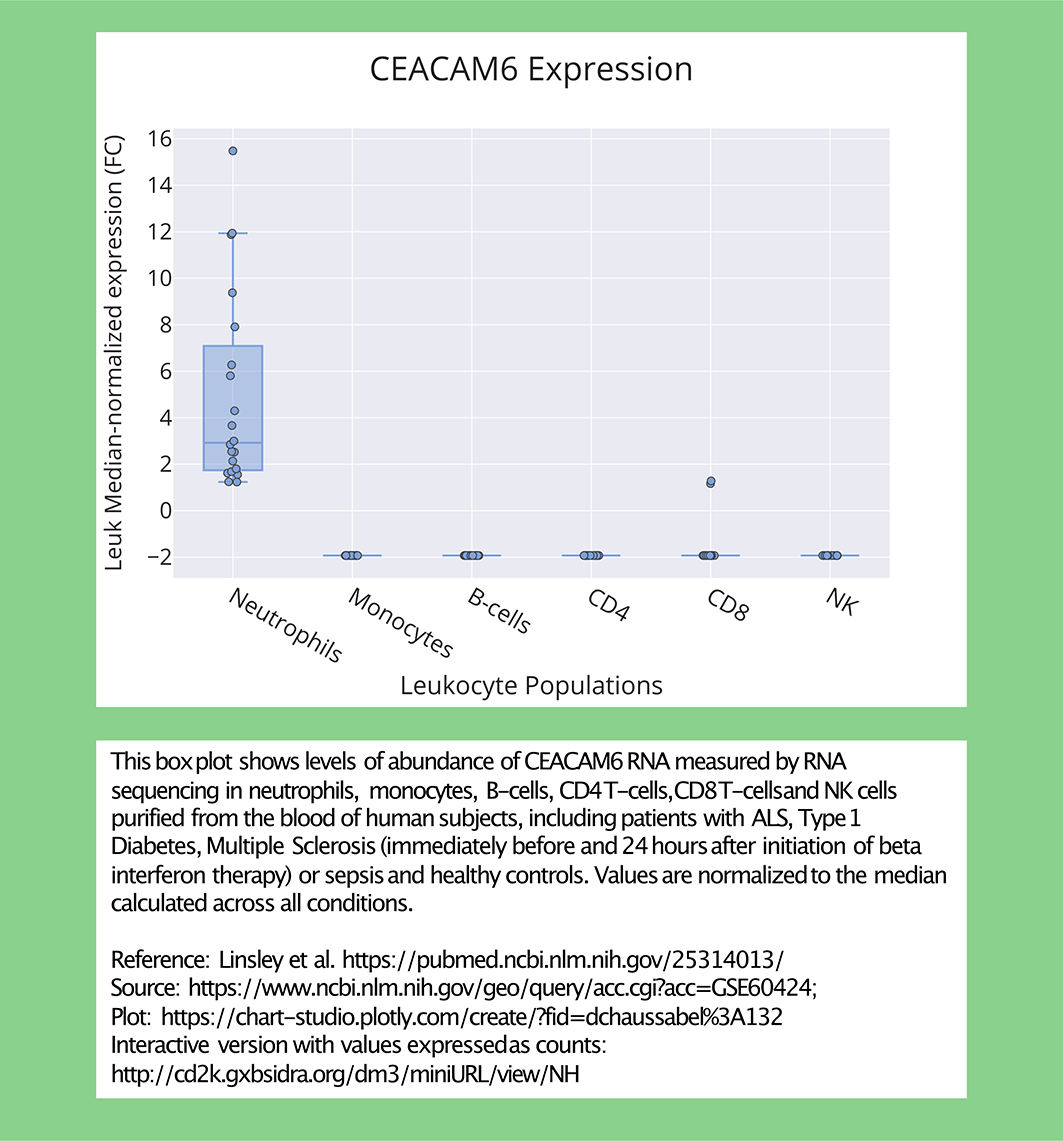
An optional step consists in generating ‘publication grade’ plots using tools such as MS Excel or Plotly (as is the case here: https://chart-studio.plotly.com/create/#/, https://plotly.com/~dchaussabel/132/). The data have been normalized to the median calculated for all samples in this dataset.
5e: Writing up a summary: Finally, the information that has been thus retrieved, interpreted, and compiled is to be summarized in a few paragraphs. The spreadsheet that was populated in Step 5c and graphical representations generated in Step 5d can serve as a resource for this exercise. It would also be appropriate at this stage to write a section summarizing the main findings and discussing perspectives gained from both literature and transcript profiling data regarding the suitability of the candidate gene as a biomarker, and in which disease settings it might be most relevant.
This final step will permit the dissemination to the rest of the scientific community of the information and perspectives gained through this training activity. It is also to provide trainees who are in early stages of their career with an opportunity to familiarize themselves with the peer-review process.
6a: Determining authorship: Authorship is determined based on intellectual contribution (for details, see15,16:). If the work was carried out independently by a single individual, as could be the case in context of the training activities presented here, then this person could be the sole author listed on the manuscript. Often a mentor will be contributing intellectually as well and would be listed as a co-author. If other individuals will make significant intellectual contributions to the work, then it is good practice to have an initial discussion to find out what are the expectations of each team member are in terms of authorship and the tasks that each will be performing. Additional discussions can take place as the work progresses and when circumstances require it. Individuals who contribute to the work but not at a level that is sufficient to warrant authorship can be named in the acknowledgement section (with their express consent).
6a: Drafting the manuscript: The workflow presented here supports the stepwise development of text that can be used as building blocks for the preparation of a manuscript. Trainees can leverage information extracted from the literature and public transcriptional profiling data. They can also use graphical representations and plots to generate figures for the manuscript. The interactive circle packing plot and spreadsheets can be made available as supplemental resources with the publication of the paper. It can be useful, even for experienced writers, to enrol the help of a copyeditor to critically read and edit the manuscript prior to journal submission.
6b: Selecting a journal and submitting the manuscript: The next step would consist in submitting the manuscript to a peer-reviewed journal. A journal is selected based on its scope, the type of article it publishes, and often taking also into account its impact factor (a measure of how frequently papers it publishes are cited). The manuscripts generated based on the workflow described in this article may be somewhat unusual. They could be submitted as a review, yet also involves retrieving, analysing and interpreting transcriptome profiling data. For those who have relatively little experience, and since this is foremost a training exercise, submitting the manuscript to F1000Research could be considered. The main advantage being the open and thus often friendlier peer-review process. But trainees should feel free to try and submit manuscripts to other journals. It is generally advisable however to steer away from so-called predatory journals, that tend to put collecting article publication charges ahead of the quality and integrity of the peer-review process.17
6c: Going through the peer-review process: After receiving the manuscript and performing initial quality checks, the journal editors may decide to reject the manuscript or to send it out for peer-review. In the first case the response will be communicated in a matter of days and the next step is to simply submit the manuscript to another journal. If the manuscript is sent out for peer-review it may take a couple of weeks for reviewers to send their critiques back to the editor who will then decide whether or not to continue and request that the authors revise their manuscript and address the reviewer comments, or to reject the manuscript (more rarely the paper may be accepted right away). If an opportunity is given for the authors to revise their submission, the new version along with a point-by-point rebuttal and a letter to the editor will be prepared and submitted. The reviewers will then typically be given the opportunity to examine the response to their critique. If they are satisfied that they have been properly addressed, they may endorse the publication of the work (although the final determination will be made by the editor). It is not uncommon for manuscripts to undergo a second round of revisions to address follow on comments from the reviewers. Notably if going down the route to submitting the manuscript for publication in F1000Research the workflow will be slightly different, as this journal will publish papers first before open peer-review. The work will only be indexed in databases such as PubMed once it has been endorsed by a sufficient number of reviewers.
6d: Proofing and publication: Once a paper is formally accepted it will go through typesetting (formatted by the journal according to its specific style/layout). It will then be sent to the corresponding author for proofing. It will be the last opportunity given to the authors to make changes to the manuscript (usually only minor ones at this stage) and to ensure that all the information that is presented is accurate. Past this stage any modification will likely require publication of an erratum (in most journals, more recent publishers such as F1000Research support versioning even post-acceptance). If the necessary corrections significantly undermine the conclusions of the paper, it may be subsequently retracted.
As mentioned earlier, the training curriculum described here may be undertaken in either self-study or workshop ‘modes’.
Those following the workflow as independent trainees can do so at their own pace and would need little more than a computer with a decent internet connection. Since the material is still new and untested, they should feel free to contact the author with questions in case clarifications are needed (it will help with the development of a more robust version of the present training guide).
For those who might wish to use this material as a basis for running training workshops multiple formats can be considered. One scenario would be running at least the first part of the workshop in person and on site, where all participants would be able to dedicate their full attention to the training activities and interact freely with the instructor(s). The instructor could, for instance, demonstrate the steps using an illustrative use case, providing participants with templates and corresponding outputs (literature queries, spreadsheet, circle packing plots). Each participant could choose to replicate the steps using the same candidate gene or a candidate gene of their choosing. It would probably not be possible to complete the assignments over the course of one or even two days. Thus, support could be provided by the instructors for trainees who wish to pursue the work after the conclusion of the workshop. Additional in person working sessions could be organized over the course of several weeks. Support could also be provided remotely via different means of communications, such as email, video conferencing or chat (in the latter case, an application such as Slack, for instance, works well). Participants for such workshops could be recruited via various means. Circulating emails highlighting some of the activities, key learning objectives and published use cases can be an effective approach. Instructors may also have the opportunity to present the curriculum and use cases to an audience in an introductory session (~30-45 mins). No bioinformatics training would be required of participants and it should be possible to tailor the training activities for participants at the undergraduate, graduate level and beyond. The training would likely be best suited for bench scientists, but bioinformaticians or computational scientists who are interested in developing deep biological expertise on a given subject matter (e.g. a given candidate gene) might also benefit.
Several limitations to the training curriculum that is presented here should be noted. First, the workflow involves several manual curation steps, which in some cases might have been avoided by using other tools or resources, such as gene ontologies. The choice to rely instead on manual curation is deliberate, as the process itself gives trainees an opportunity to familiarize themselves with their candidate gene’s literature. This is one more step towards gaining subject-matter expertise, which will be needed for writing the manuscript later. The literature profiling skills being developed could also later be used by trainees in different contexts. Second, although large scale profiling data is employed as a source of training material, the curriculum focuses on retrieval and interpretation of information associated to a single gene. The curriculum therefore does not teach trainees approaches employed for the analysis of high dimensional data. Third, the curriculum remains at this stage untested. Some illustrative examples are provided, and the publication of a proof-of-concept paper will follow. But it will also be necessary for the optimization of this curriculum to obtain feedback from trainees – that can be addressed to the author along with any clarifying questions. Changes would be incorporated in subsequent versions of this article.
Biomedical research has become data-rich. Investigators are able to generate molecular profiling data routinely and have access to vast collections of public datasets. The first module of our “Collective Omics Data” training curriculum (COD1) described here focuses on information retrieval from public sources, being the literature or transcriptome profiling datasets. Trainees also learn how to structure and aggregate this information to support downstream interpretation and manuscript preparation. It is expected that upon completing the curriculum trainees should be able to leverage ‘biomedical big data’ more effectively in their research. It could also serve as a foundation for further development of data science skills, including data management and data analytics – which have been the object of two other modules in our Collective Omics to Data training program (COD2 & COD3).18
Figshare: COD1 Study Guide V1 - Extended Data File 1 - CEACAM6_Step 3b.xlsx. https://doi.org/10.6084/m9.figshare.19998068.19
The project contains the following underlying data:
• 2022 May27 ED File 1 CEACAM6_Step3b.xlsx. (Extended data File 1: a spreadsheet in the MS Excel format listing keywords extracted from titles of articles associated with CEACAM6 for two different themes: “cell types” and “diseases or states”).
Data are available under the terms of the Creative Commons Attribution 4.0 International license (CC-BY 4.0).
Figshare: COD1 Study Guide V1 - Extended Data File 2 - CEACAM6_Step 3c.xlsx. https://doi.org/10.6084/m9.figshare.19998092.20
The project contains the following underlying data:
• 2022 May27 ED File 2 CEACAM6_Step3c.xlsx. (Spreadsheet in the MS Excel format listing cell type and disease entities and their prevalence in the literature associated with CEACAM6)
Data are available under the terms of the Creative Commons Attribution 4.0 International license (CC-BY 4.0).
Figshare: COD1 Study Guide V1 - Extended Data File 4 - CEACAM6_Step3d.xlsx. https://doi.org/10.6084/m9.figshare.20000546.22
The project contains the following underlying data:
• 2022 May29 ED File 4 CEACAM6_Step3d.xlsx. (Extended data File 4: a spreadsheet in the MS Excel format used to capture information from the CEACAM6 literature regarding its actual or potential use as a biomarker in disease entities associated with this gene that were identified in Step 3).
Data are available under the terms of the Creative Commons Attribution 4.0 International license (CC-BY 4.0).
Figshare. COD1 Study Guide V1 - Extended Data File 6. https://doi.org/10.6084/m9.figshare.20000561.24
This project contains the following underlying data:
• (Extended data File 6: a video in the.mov format demonstrating the lookup of the expression profile a CEACAM6 in a given transcriptome dataset using the GXB data browsing application).
Data are available under the terms of the Creative Commons Attribution 4.0 International license (CC-BY 4.0).
Figshare: COD1 Study Guide V1 - Extended Data File 7 - CEACAM6_GXB CSV Download.mov. https://doi.org/10.6084/m9.figshare.20000570.25
This project contains the following underlying data:
• 2022 May29 ED File 7 CEACAM6_GXB CSV Download.mov. (Extended data File 7: a video in the.mov format demonstrating the download of CEACAM6 expression profiling data using the GXB data browsing application).
Data are available under the terms of the Creative Commons Attribution 4.0 International license (CC-BY 4.0).
Figshare. COD1 Study Guide V1 - Extended Data File 8 - CEACAM6_Step5b.xlsx. https://doi.org/10.6084/m9.figshare.20000576.26
This project contains the following underlying data:
• 2022 May29 ED File 8 CEACAM6_Step5b.xlsx. (Extended data File 8: a spreadsheet in the MS Excel format used to capture CEACAM6 transcriptional profiles from multiple datasets (one dataset per tab) and compute significance of differences in abundance observed between cases and controls).
Data are available under the terms of the Creative Commons Attribution 4.0 International license (CC-BY 4.0).
Figshare: COD1 Study Guide V1 - Extended Data File 3 - Information Capture Form_Generic.xlsx. https://doi.org/10.6084/m9.figshare.19998221.21
The project contains the following extended data:
• 2022 May27 ED File 3 - Information Capture Form_Generic.xlsx. (Extended data File 3: a spreadsheet in the MS Excel format that is used as a template in steps 3, 4 and 5 to capture relevant information from the literature and from transcriptional profiling data analysis results)
Data are available under the terms of the Creative Commons Attribution 4.0 International license (CC-BY 4.0).
Figshare: COD1 Study Guide V1 - Extended Data File 5-2022 May29 ED File 5 CEACAM6_Step4c.xlsx
https://doi.org/10.6084/m9.figshare.20000555.23
The project contains the following extended data:
• 2022 May29 ED File 5 CEACAM6_Step4c.xlsx: a spreadsheet in the MS Excel format used to capture information from the CEACAM6 literature regarding its actual or potential use as a blood transcriptional biomarker. It is provided here for illustrative purposes, the information captured is not comprehensive)
Data are available under the terms of the Creative Commons Attribution 4.0 International license (CC-BY 4.0).
Figshare: COD1 Study Guide V1 - Extended Data File 9 - CEACAM6_Step5c.xlsx. https://doi.org/10.6084/m9.figshare.20000579.27
This project contains the following extended data:
• 2022 May29 ED File 9 CEACAM6_Step5c.xlsx. (Extended data File 9: a spreadsheet in the MS Excel format used to capture relevant information regarding differences in CEACAM6 transcriptional abundance observed in multiple datasets. It is provided here for illustrative purposes, the information captured is not comprehensive).
Data are available under the terms of the Creative Commons Attribution 4.0 International license (CC-BY 4.0).
| Views | Downloads | |
|---|---|---|
| F1000Research | - | - |
|
PubMed Central
Data from PMC are received and updated monthly.
|
- | - |
Provide sufficient details of any financial or non-financial competing interests to enable users to assess whether your comments might lead a reasonable person to question your impartiality. Consider the following examples, but note that this is not an exhaustive list:
Sign up for content alerts and receive a weekly or monthly email with all newly published articles
Already registered? Sign in
The email address should be the one you originally registered with F1000.
You registered with F1000 via Google, so we cannot reset your password.
To sign in, please click here.
If you still need help with your Google account password, please click here.
You registered with F1000 via Facebook, so we cannot reset your password.
To sign in, please click here.
If you still need help with your Facebook account password, please click here.
If your email address is registered with us, we will email you instructions to reset your password.
If you think you should have received this email but it has not arrived, please check your spam filters and/or contact for further assistance.
Comments on this article Comments (0)