Keywords
Machine vision, deep learning, labeling, classification, software
This article is included in the Artificial Intelligence and Machine Learning gateway.
This article is included in the Plant Science gateway.
This article is included in the Python collection.
Machine vision, deep learning, labeling, classification, software
Image recognition is a critical part of machine vision. It identifies objects in images, such as specific types of tumor cells or leaves infected by a specific pathogen. Due to the complexity of solving such problems, deep learning (DL) is leveraged to achieve the required results. The challenge of DL is the requirement of a large number of training images before the learning task.1 Because training data is not always available at the beginning, and the new data arrives in the format of sequential stream.2 Furthermore, labeling a large number of images is labor-intensive.3 To reduce the time consumption of laborious human labeling, it is ideal to incrementally label images to train a DL system and let the system label new images.4,5 After human corrections, the new labels can enhance the system further until the required results are achieved.6,7 We developed an open-source Python package named ROOSTER, to fit such a need. ROOSTER not only has a friendly graphic user interface to label images or their sub-images but also accepts any pre-trained models in the format of PyTorch for classification. We demonstrated the usage of ROOSTER in developing a machine vision system to detect wheat stripe rust using images from smartphones and drones.
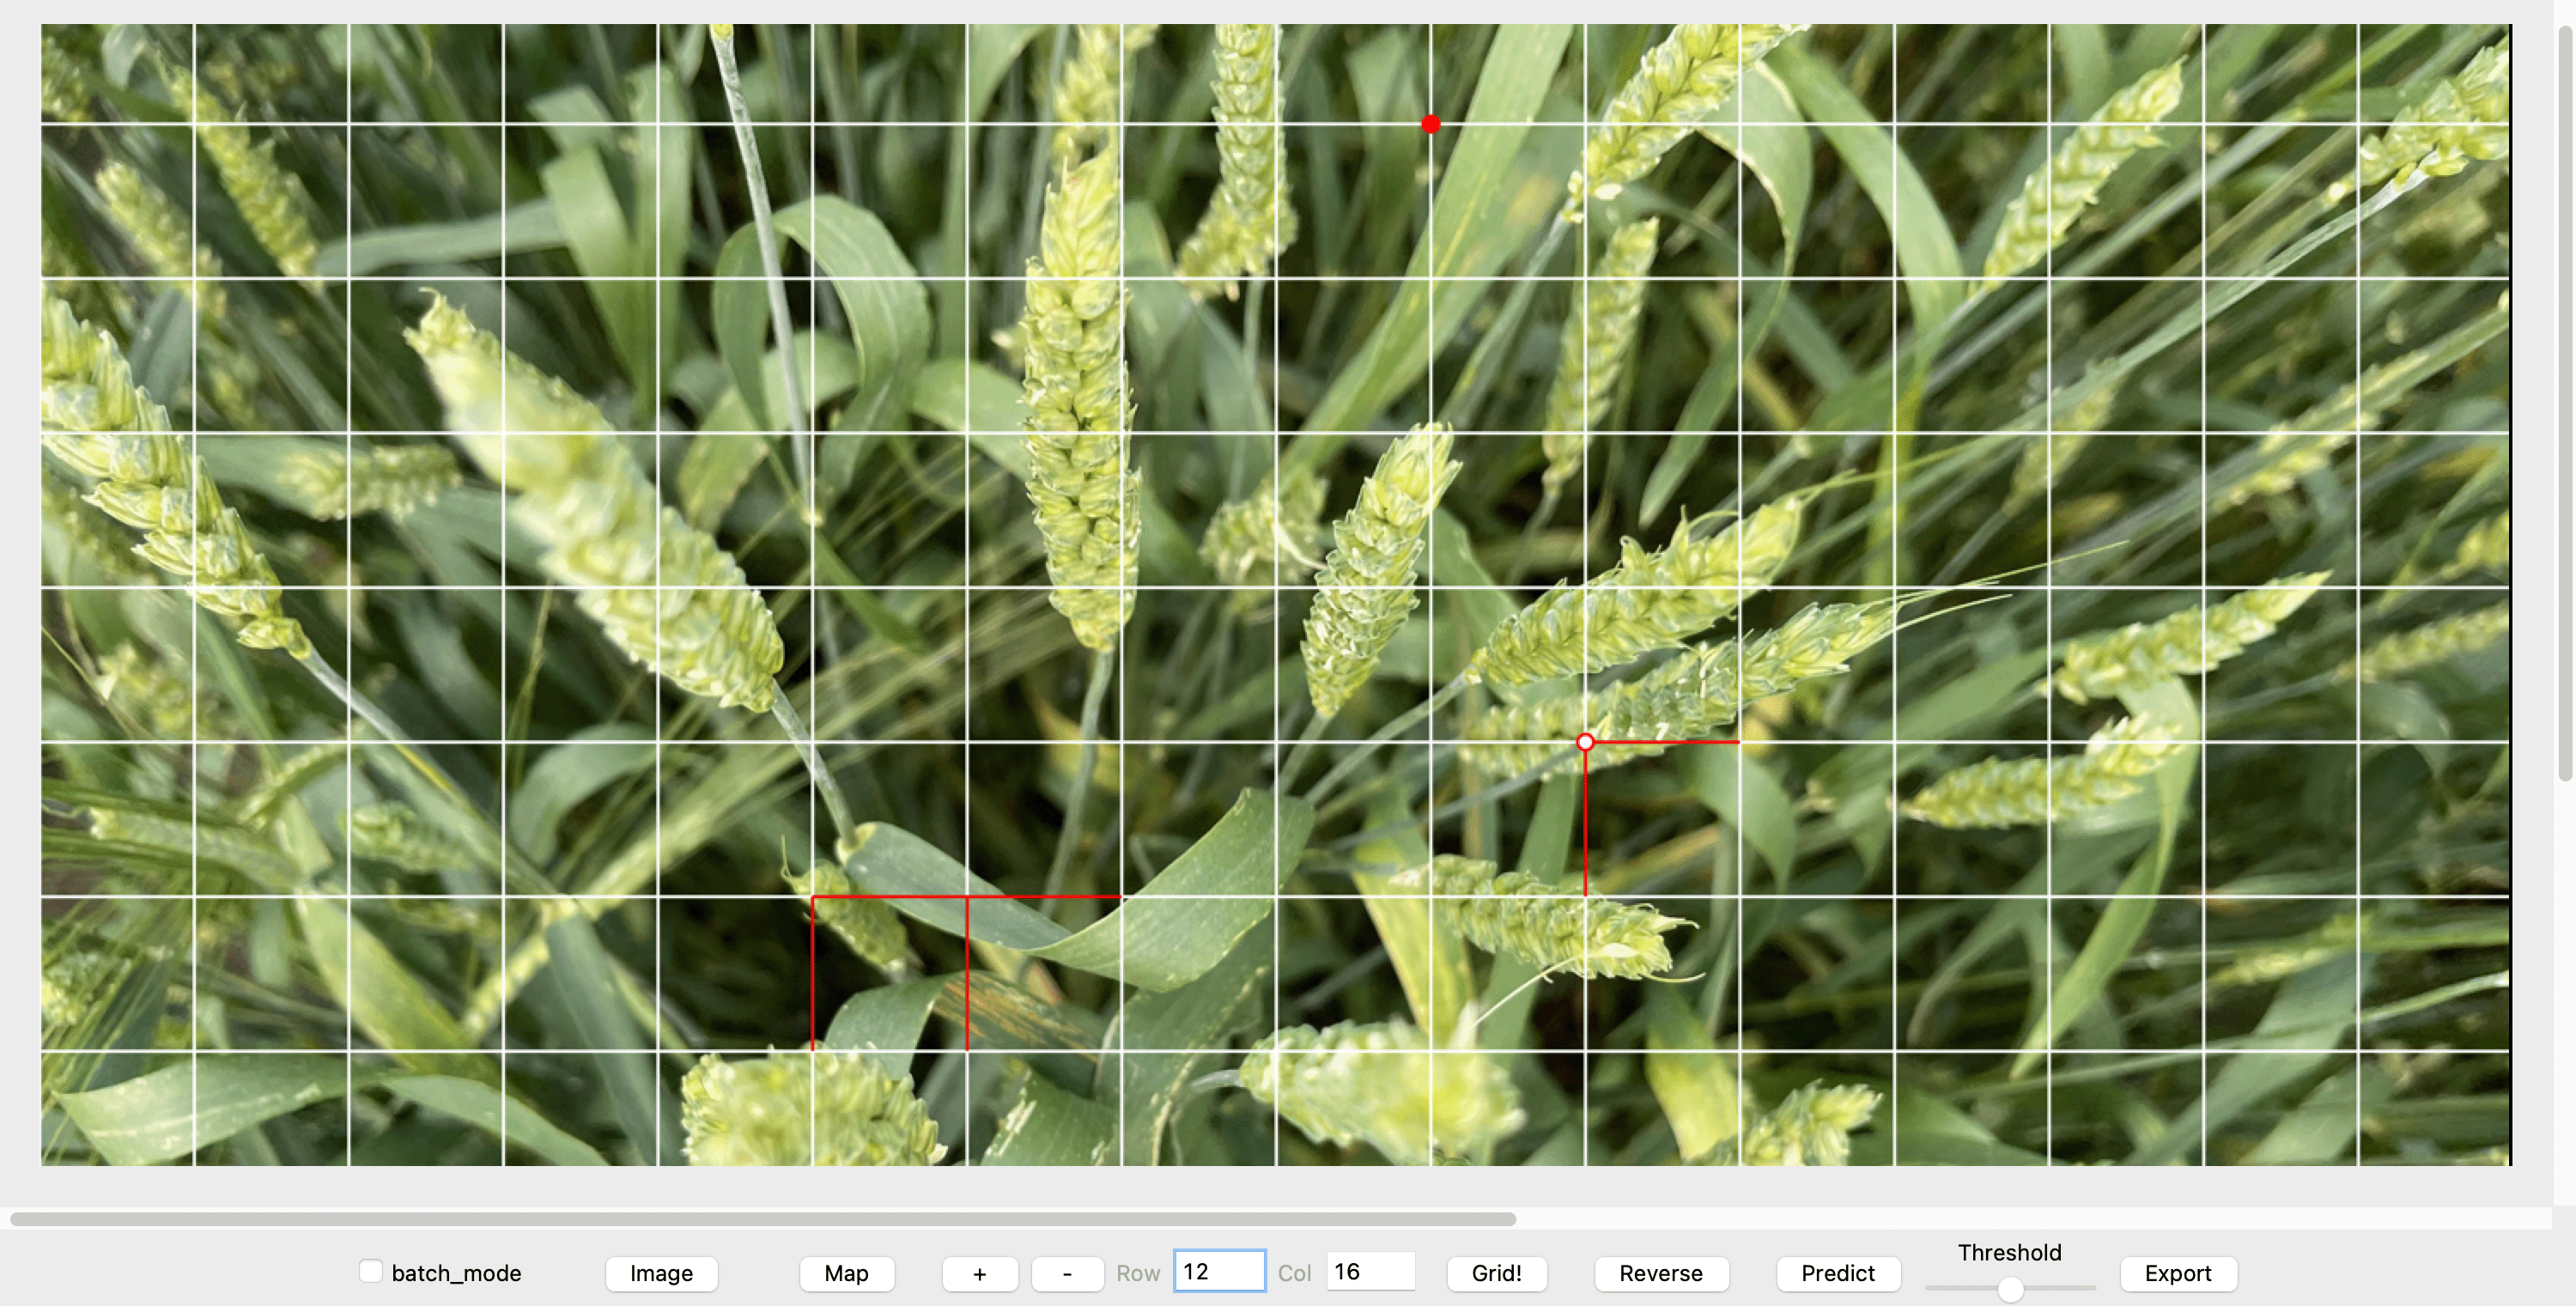
The interface of ROOSTER contains a control panel on the bottom and a display panel on the top. An image is imported by clicking the Image button. The number of rows and columns can define tiles. The grids can be hidden or displayed by clicking the Grid button. The image and grids can be zoomed in (+), zoomed out (-), or moved by clicking and dragging. When numbers of rows and columns are defined, the statuses of tiles are set to control by default, indicated by white lines on the top left corners. With a double-click on a tile, its status can be switched between the default status and the alternative status indicated by red lines in the top left corner (see Figure 1). The statuses of all tiles can be reversed by clicking the Reverse button.

The case image was for wheat stripe rust which can be found in Underlying data.11
ROOSTER can load ResNet-18 based neural networks model to make predictions. Prediction is applied to all tiles by loading a pre-trained model or a model trained with part of user-owned images. For example, RustNet is a ResNet-18 based neural network that can be used for wheat stripe rust detection.8 It was pre-trained with wheat stripe rust images from different situations, which can be loaded into ROOSTER to make predictions. Visualization of prediction on a tile is based on its current status. The disagreement between the prediction and the current status is indicated by a dot on the top left of the tile. The dot is in red if the current status is in the default status and white otherwise (Figure 1). ROOSTER outputs include a PNG file for an overview of labeling, images of cropped tiles, and an Excel file (Map) to indicate the statuses of individual tiles. The output Map file can also be used as the input to define the status of an image. This function allows users to save label results and resume labeling later.
ROOSTER can process images in two modes: batch mode and single image mode. When the batch mode is checked, clicking Image button defines the image folder. Otherwise, the Image button clicking chooses a single image. Under single image mode, an option is available to use the Map button to apply a pre-classification result (an Excel form) to the current image, including the numbers of rows and columns and statuses of all tiles. If no excel file is attached, users need to define the total number of tiles by specifying the number of rows and columns and click the Grid button to draw the grids. Users can switch the status between the default and the alternative for each tile. Prediction can be performed for either multiple images with the batch mode or the single image by clicking the Predict button. In either case, a window will pop out for users to attach a classification model, e.g., RustNet.pth. The labels can be saved by clicking the Export button. The exported result can be imported through the Map button to continue the customization of labels.
ROOSTER is developed with Python 3.6 for 64-bit processors on Mac OS, Linux, and Windows with a minimal 16 GB memory (the code is available in Software availability12). When numbers of rows and columns are defined, ROOSTER can load ResNet-18-based models to predict tiles before human labeling is involved. Human laborers can correct labels by double-clicking the tile. The disagreement between the prediction model and human labeling would be shown with a two-color dot in the top left corner. With ROOSTER, users can start with labeling part of images and train the initial version of the prediction model. The initial version of the model can be reloaded to predict the rest of images in the ROOSTER and retrain the model with the updated dataset, which could increase the labeling efficiency and gradually improve the model accuracy.
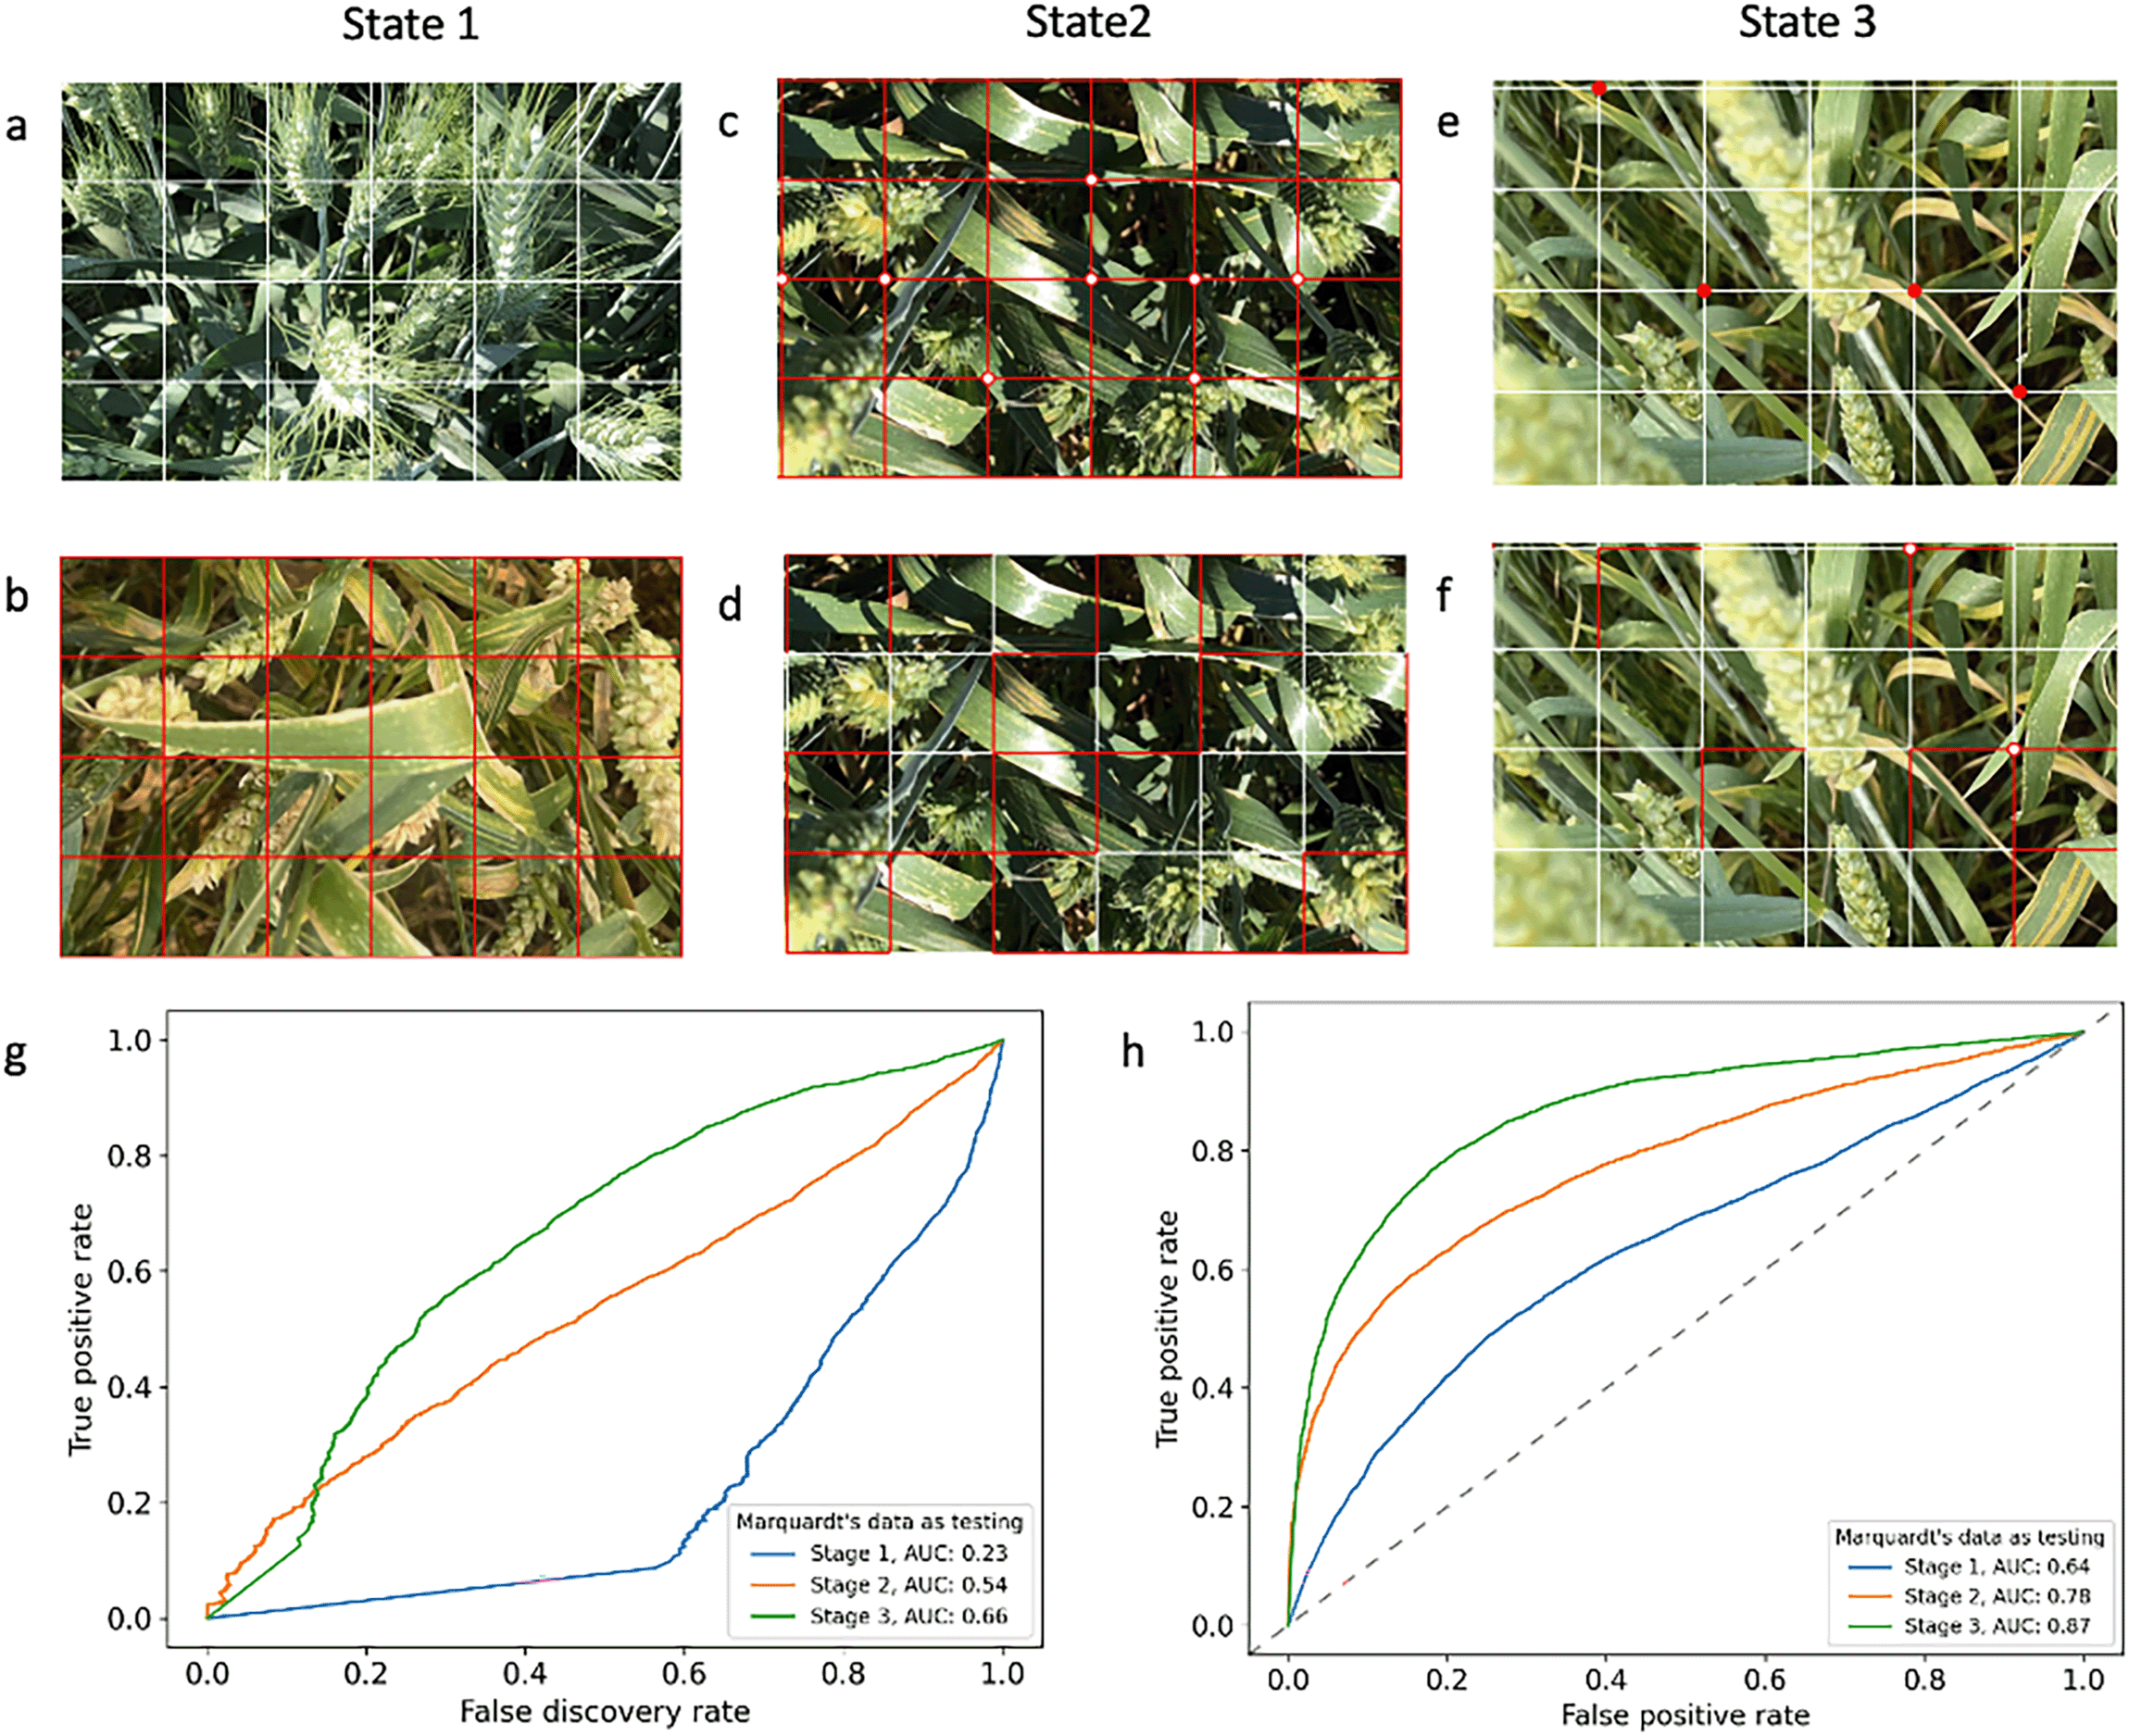
We used ROOSTER to automatically label 200 images of plants containing no infection as the default status and 200 images of plants with all leaves infected as the alternative status (Stage 1 in Figure 2). These images are available in Underlying data.11 We used them for this initial training stage of RustNet, which was modified with a pre-trained ResNet-18.9 The testing on a published independent set of images (5,818 diseased tiles and 14,542 non-diseased tiles) that were previously labeled manually (see Underlying data10) suggested the two types of abundantly available images are beneficial to establishing essential predictability. The area under the receiver operating characteristic curve of true positive rate against false discovery rate is 0.23 compared to 0 for the random guess. Similarly, the area under the receiver operating characteristic curve of true positive rate against false positive rate is 0.64 compared to 0.5 for the random guess.

A large number of images11 that were automatically labeled in control status (uninfected in a) and case status (all leaves infected by wheat stripe rust in b) were used to initialize the RestNet18 (Stage 1). Images with all leaves infected were initially labeled with case status at Stage 2 and predicted by the model trained from Stage 1 (c) to navigate humans to correct labels (d). Images with plants partially infected were initially labeled as control status (e) and predicted by the model from Stage 2 to navigate humans to correct labels (f). The performances at different stages were examined by 20,360 published tile images labeled manually (5,818 diseased and 14,542 non-diseased) in an independent study (see Underlying data10). Two receiver operating characteristic (ROC) curves with false discovery rate (g) and false positive rate (h) were used to compare performances. Random guess has AUC (area under curve) of 0 for ROC of false discovery rate (g) and 0.5 for ROC of false positive rate (the diagonal dash line in h). See Underlying data11 for the raw data associated with the use case.
The labels of the images with all leaves infected in Stage 1 contained errors as some tiles do not contain leaves. We made the prediction on 20 new images8 with all leaves infected, and manually corrected the prediction errors. The manual corrections with prediction navigation are much easier than labeling the raw images. The training (Stage 2) with the 20 new images dramatically boosted prediction accuracy (0.54 and 0.78 compared to 0.23 and 0.64 at Stage 1 for ROC of false discovery rate and false positive rate, respectively). Similarly, we made the prediction on 61 images with partial leaves infected, manually corrected the prediction errors, and added to the training data in Stage 2 to form Stage 3 training. The prediction accuracy was further improved (0.66 and 0.87 compared to 0.54 and 0.78 at Stage 2 for ROC of false discovery rate and false positive rate, respectively).
ROOSTER combines functions including automatic labeling, label prediction, and manual labeling in a user-friendly GUI (graphical user interface) to label and classifies images using any outsourced models in the format of PyTorch. The navigation of integrating prediction with labeling benefits human adjustment to iteratively improve predictability to use interactive deep learning to develop machine vision systems.
The independent data used to test ROOSTER was sourced from Schirrmann et al., 10 see here: https://doi.org/10.3389/fpls.2021.469689). Please contact the corresponding author of this article (mschirrmann@atb-potsdam.de) to request access to the test data if interested.
Zenodo: ROOSTER underlying dataset. https://doi.org/10.5281/zenodo.7530460. 11
This project contains the following underlying data:
- RawImages.zip (400 input training images used to develop the model, and captured by the authors of this article).
- UseCase.zip (use case output files).
Data are available under the terms of the Creative Commons Attribution 4.0 International license (CC-BY 4.0).
Software available from: https://zzlab.net/ROOSTER .
Source code available from: https://github.com/12HuYang/ROOSTER.
Archived source code at time of publication: https://doi.org/10.5281/zenodo.7320405. 12
License: MIT
| Views | Downloads | |
|---|---|---|
| F1000Research | - | - |
|
PubMed Central
Data from PMC are received and updated monthly.
|
- | - |
Is the rationale for developing the new software tool clearly explained?
Yes
Is the description of the software tool technically sound?
Yes
Are sufficient details of the code, methods and analysis (if applicable) provided to allow replication of the software development and its use by others?
Partly
Is sufficient information provided to allow interpretation of the expected output datasets and any results generated using the tool?
Partly
Are the conclusions about the tool and its performance adequately supported by the findings presented in the article?
Yes
Competing Interests: No competing interests were disclosed.
Reviewer Expertise: Precision Agriculture, Remote Sensing
Alongside their report, reviewers assign a status to the article:
| Invited Reviewers | |
|---|---|
| 1 | |
|
Version 1 06 Feb 23 |
read |
Provide sufficient details of any financial or non-financial competing interests to enable users to assess whether your comments might lead a reasonable person to question your impartiality. Consider the following examples, but note that this is not an exhaustive list:
Sign up for content alerts and receive a weekly or monthly email with all newly published articles
Already registered? Sign in
The email address should be the one you originally registered with F1000.
You registered with F1000 via Google, so we cannot reset your password.
To sign in, please click here.
If you still need help with your Google account password, please click here.
You registered with F1000 via Facebook, so we cannot reset your password.
To sign in, please click here.
If you still need help with your Facebook account password, please click here.
If your email address is registered with us, we will email you instructions to reset your password.
If you think you should have received this email but it has not arrived, please check your spam filters and/or contact for further assistance.
Comments on this article Comments (0)