Keywords
Pancreatic Cancer, Pancreatic cancer incidence, Pancreatic Incidence-based mortality, SEER database, Pancreatic cancer risk factors
This article is included in the Oncology gateway.
Pancreatic Cancer, Pancreatic cancer incidence, Pancreatic Incidence-based mortality, SEER database, Pancreatic cancer risk factors
Pancreatic cancer (PC) is one of the deadliest malignancies accounting for the third leading cause of cancer deaths in the United States in both male and females1–3 and seventh leading cause of cancer deaths worldwide.3 The American Cancer Society’s estimates about 62,210 people (32,970 men and 29,240 women) will be diagnosed with pancreatic cancer and about 49,830 people (25,970 men and 23,860 women) will die of pancreatic cancer in the United States by 2022.1 Pancreatic cancer accounts for about 3% of all cancers in the US and about 7% of all cancer deaths. It is one of the most fatal malignancies evidenced by a five-year survival rate of 11%.4 In terms of sex and race, pancreatic cancer rates have been reported to be higher in among male and black population.
Pancreatic cancer can be sub-grouped based on the histology. About 95% of malignant neoplasms of the pancreas originate from the exocrine elements with ductal adenocarcinoma accounting for about 85% of all pancreatic neoplasms.5 Neuroendocrine tumors such as insulinoma, gastrinoma, glucagonoma, somatostatinoma, and non-functional islet cells tumors are less common histological types of pancreatic cancer.5 Approximately 60 to 70 percent of exocrine pancreatic cancers are localized to the head of the pancreas, while 20 to 25 percent are in the body/tail and the remainder involve the whole organ.6
Studies have identified modifiable risk factors have been associated with Pancreatic cancer such as Overweight, Obesity, Tobacco use, Cigarette smoking and diabetes especially pancreatic adenocarcinoma7,8,9 with limited data on risk factors associated with other pancreatic cancers.10
Typically, patients are initially symptom-free until tumor progression when they present with non-specific symptoms such as fatigue, abdominal pain, jaundice, and weight loss.11 Diagnosis most cases are incidental in nature with nonspecific imaging studies. Most times, diagnosis is missed because patients have an early-stage disease.12 Treatment entails surgery, chemotherapy and radiotherapy depending on the staging and extent of disease, with most cases treatment focused on symptom relief and improving survival as there are no definitive treatments for advanced disease.11,12
The lack of screening tests and high fatality makes pancreatic cancer a tremendous public health burden for the United States.12 Based on the high fatality and absence screening tests, a need for further research focusing on interventions directed at disease prevention, treatment, and patient outcomes.
A trend analysis of incidence and mortality rate of pancreatic cancer is focused on highlighting the burden of pancreatic cancer and emphasize the importance of formulating preventive strategies geared at reducing pancreatic cancer incidence and mortality. Our study focused on obtained data from National Cancer Institute (NCI) from the Surveillance, Epidemiology, and End Results (SEER) database13 and highlights the incidence and incidence-based mortality trends from 2000-2019.
The SEER program of the NCI has been involved in collecting data on cancer epidemiology.13 Several studies have analyzed and assessed trends in pancreatic cancer rates.14,15 However, most reports have varied in conclusions with recent data. Most of these reports used SEER database as their only database. Our study further focused on stratifying pancreatic cancer incidence rates and incidence mortality-based rates based on age, sex, race and state.
We used SEER*stat software 8.4.0.116 to obtain data of pancreatic cancer cases diagnosed from 2000 to 2019 from SEER eighteen registries. “Incidence - SEER Research Plus Data, 17 Registries, Nov 2021 Sub (2000-2019). The SEER 17 data is based on 26.5% of the U.S. population based on 2010 census. The study included patients diagnosed with pancreatic cancer from 2000 to 2019; We used International Classification of Disease (ICD)-0-2 and ICD-0-3 for coding for pancreatic cancer.17,18 We excluded cases whose diagnosis relied only on autopsy or death certificates. We focused on the following variables: sex, race, age and stage at diagnosis, site of the tumor within the pancreas and geographical location.
The rates are available by expanded race/ethnicity of cases diagnosed, including white, black, Asian/Pacific Islander, and American Indian/Alaskan Native and Hispanic ethnicity. SEER 17 also includes adjustments for areas impacted by hurricanes Katrina and Rita. It contains a record for each of 8,131,919 tumors. The registries included in SEER 17 are Alaska Natives, San Francisco Oakland SMSA, Connecticut, Hawaii, Iowa, New Mexico, Seattle (Puget Sound), Utah, Atlanta, (Metropolitan, San Jose-Monterey, Los Angeles, Rural Georgia, California excluding San Francisco, San Jose Monterey, Los Angeles, Kentucky, Louisiana, New Jersey, Greater Georgia.
We calculated two main outcomes: incidence and incidence-based mortality rates. All rates were adjusted to the 2000 US Standard population and expressed by 100, 000 person-years. These rates were calculated from 2000 to 2019 according to demographic and tumor characteristics. Incidence-based mortality rates were calculated as the number of pancreatic cancer deaths among cases diagnosed over person-time at risk among people in the SEER areas. We then calculated the Annual percentage changes (APC) of incidence and incidence-based mortality rates over the study period according to the baseline demographic and tumor characteristics.
We used SEER*stat software 8.4.0.1 to calculate the incidence and incidence-based mortality rates. We also used the NCI’s Joinpoint Regression Program, version 4.9.1.019,20 to calculate the APCs. The Joinpoint Regression software uses t-tests to determine if APCs were statistically significant from zero; a difference was noted to be statistically significant when P < 0.05. The software analyzed rates over time and detected significant changes in the APCs, then selected the best model with the minimum number of joinpoints. All statistical tests were two-sided.
We obtained data of 206,968 cases with pancreatic cancer during 2000 – 2019 period. (Table 1). Majority of these patients were white (148,321 subjects [80.87%]), Male (92,438 ejects 50.40%]), older than 60 (152,764 subjects [83.29%]) and had metastatic disease at diagnosis (86,578 subjects [41.83%]). In terms of geographic location, California state had the highest subjects of 75,532 (41.18%).
| Characteristics | Incidence of Pancreatic cancer | |
|---|---|---|
| Cases, No (%)a | Rate (95% Cl)b | |
| Overall | 206,968 (100) | 12.3 (12.3 – 12.4) |
| Sex | ||
| Male | 104,364 (50.43) | 14 (13.9-14.1) |
| Female | 102,604 (49.57) | 10.9 (10.9 – 11) |
| Race | ||
| White | 166,650 (80.52) | 12.3 (12.2 – 12.3) |
| Black | 23,050 (11.14) | 15.4 (15.2 – 15.6) |
| Asian or Pacific Islander | 15,467 (7.47) | 9.9 (9.8 – 10.1) |
| American Indian/Alaska native | 1,261 (0.61) | 7.7 (7.3 – 8.2) |
| Unknownc | 540 (0.26) | |
| Age at diagnosis | ||
| <60 years | 42,405 (20.49) | 2.9 (2.8 – 2.9) |
| >60 years | 164,563 (79.51) | 60.2 (59.9 – 60.5) |
| Stated | ||
| Alaska | 243 (0.11) | 16.2 (14.1-18.5) |
| California | 85,604 (41.36) | 11.7 (11.6 – 11.8) |
| Connecticut | 11,355 (5.49) | 13.4 (13.1-13.6) |
| Georgia | 22,339 (10.79) | 12.4 (12.2 – 12.6) |
| Hawaii | 4,212 (2.04) | 13.1 (12.7-13.5) |
| Iowa | 9,235 (4.46) | 12.5 (12.2-12.7) |
| Kentucky | 12,014 (5.81) | 12.5 (12.2-12.7) |
| Louisiana | 13,062 (6.31) | 13.7 (13.4-13.9) |
| New Jersey | 27,295 (13.19) | 13.6 (13.5 – 13.8) |
| New Mexico | 4,894 (2.37) | 10.9 (10.6 – 11.3) |
| Utah | 4,565 (2.21) | 10.7 (10.4 – 11.0) |
| Washington | 12,150 (5.87) | 12.7 (12.4 – 12.9) |
| Stage at diagnosis | ||
| Localized | 19,922 (9.63) | 1.2 (1.2-1.2) |
| Regional | 49,254 (23.80) | 2.9 (2.9-2.9) |
| Distant | 86,578 (41.83) | 5.1 (5.1-5.2) |
| Unstaged | 19,461 (9.40) | 1.2 (1.2-1.2) |
| Blank(s)e | 31,753 (15.34) | 1.9 (1.9 – 1.9) |
b Rates were calculated as the number of cases per 100,000 person-years and age-adjusted to the 2000 US standard population
c Rates for patients with unknown race could not be calculated, as ‘race’ is a population variable and must be known to calculate rates
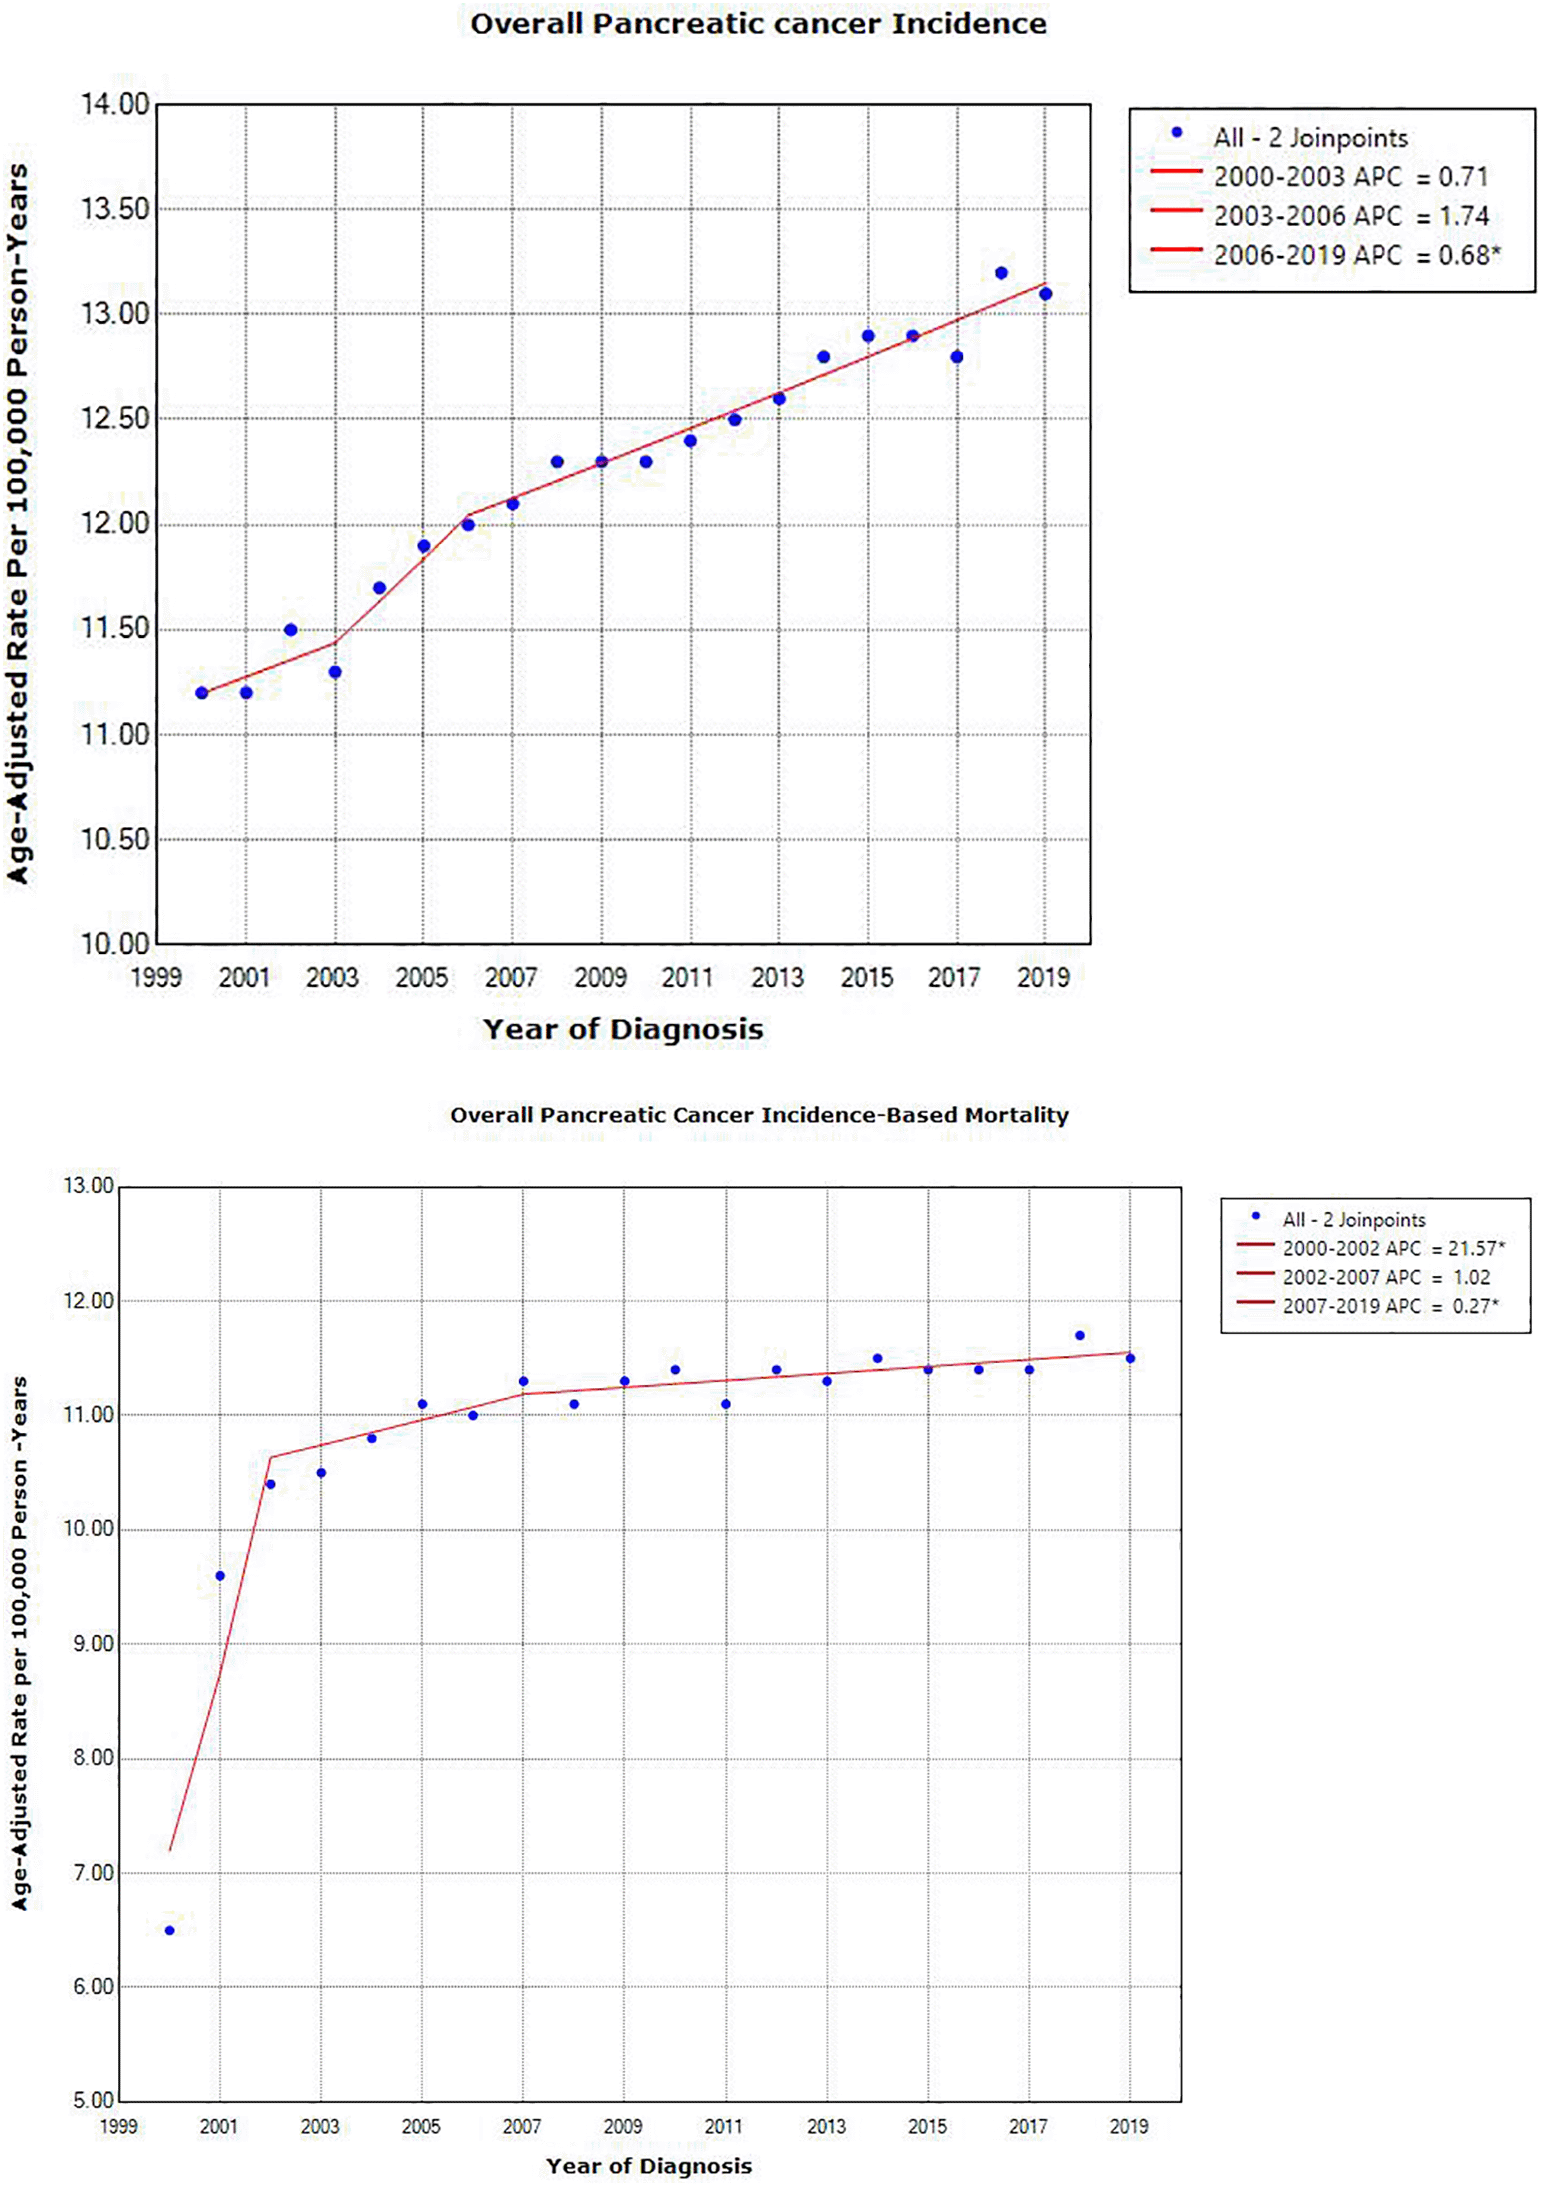
We also reviewed data of 183,406 cases of patients who died from pancreatic cancer based on incidence-based mortality analysis from 2000 – 2019 period (Table 2). Most of the patients were male (92,438 subjects [50.40%]), White (148,321 subjects [80.87%]), older than 60 (152,764 subjects [83.29%]) and had a metastatic disease (87,142 subjects [40.91%]). Figure 1 shows the incidence and incidence-based mortality trends for Pancreatic Cancer from 2000-2019.
| Characteristics | Incidence of Pancreatic cancer | |
|---|---|---|
| Cases, No (%) a | Rate (95% Cl) b | |
| Overall | 183,406(100) | 11 (10.9 – 11) |
| Sex | ||
| Male | 92,438 (50.40) | 12.6 (12.5-12.7) |
| Female | 90,968 (49.60) | 9.6 (9.6 – 9.7) |
| Race | ||
| White | 148,321 (80.87) | 10.9 (10.9 – 11) |
| Black | 20,554 (11.21) | 14.1 (13.9 – 14.3) |
| Asian or Pacific Islander | 13,104 (7.14) | 8.6 (8.4 – 8.7) |
| American Indian/Alaska native | 1,132 (0.62) | 7.2 (6.8 – 7.7) |
| Unknownc | 295 (0.16) | |
| Age at diagnosis | ||
| <60 years | 30,642 (16.71) | 2 (2 – 2.1) |
| >60 years | 152,764 (83.29) | 56.1 (55.8 – 56.4) |
| Stated | ||
| Alaska | 222 (0.12) | 15.1 (13.1-17.3) |
| California | 75,532 (41.18) | 10.4 (10.3 – 10.5) |
| Connecticut | 10,039 (5.47) | 11.7 (11.5-12) |
| Georgia | 19,899 (10.85) | 11.2 (11.1 – 11.4) |
| Hawaii | 3,758 (2.04) | 11.6 (11.2-11.9) |
| Iowa | 8,315 (4.53) | 11.1 (10.9-11.3) |
| Kentucky | 10,855 (5.91) | 11.3 (11.1-11.5) |
| Louisiana | 11,860 (6.47) | 12.5 (12.3-12.7) |
| New Jersey | 23,875 (13.02) | 11.9 (11.7 – 12.1) |
| New Mexico | 4,397 (2.40) | 9.9 (9.6 – 10.2) |
| Utah | 4,040 (2.20) | 9.6 (9.3 – 9.9) |
| Washington | 10,614 (5.79) | 11.2 (11 – 11.4) |
| Stage at diagnosis | ||
| Localized | 13,511 (6.38) | 0.8 (0.8-0.8) |
| Regional | 45,178 (21.91) | 2.7 (2.7-2.7) |
| Distant | 87,142 (40.91) | 5.2 (5.1-5.2) |
| Unstaged | 21,934 (10.76) | 1.3 (1.3-1.3) |
| Blank(s)e | 15,641 (20.04) | 2.2 (2.2 – 2.2) |
b Rates were calculated as the number of cases per 100,000 person-years and age-adjusted to the 2000 US standard population
c Rates for patients with unknown race could not be calculated, as ‘race’ is a population variable and must be known to calculate rates
*Indicates that the Annual percentage Change (APC) is significantly different from zero at the alpha =0.05 level.
The overall pancreatic incidence during the study period was 12.3 per 100,000 person-years (95% confidence interval [Cl], 12.3, 12.4). Incidence of pancreatic cancer was highest in males (14; 95% Cl, 13.9,14.1), black subjects (15.4 95% Cl,15.2, 15.6), and people older than 60 years (60.2; 95% Cl, 59.9, 60.5). In terms of geographical location, the incidence was highest in Alaska (16.2; 95% Cl, 14.1, 18.5), and lowest in Utah (10.7; 95% Cl, 10.4, 11.0) compared to other states. Based on the stage at diagnosis, distant stage had the highest incidence (5.1; 95% Cl, 5.1, 5.2). (Table 1)
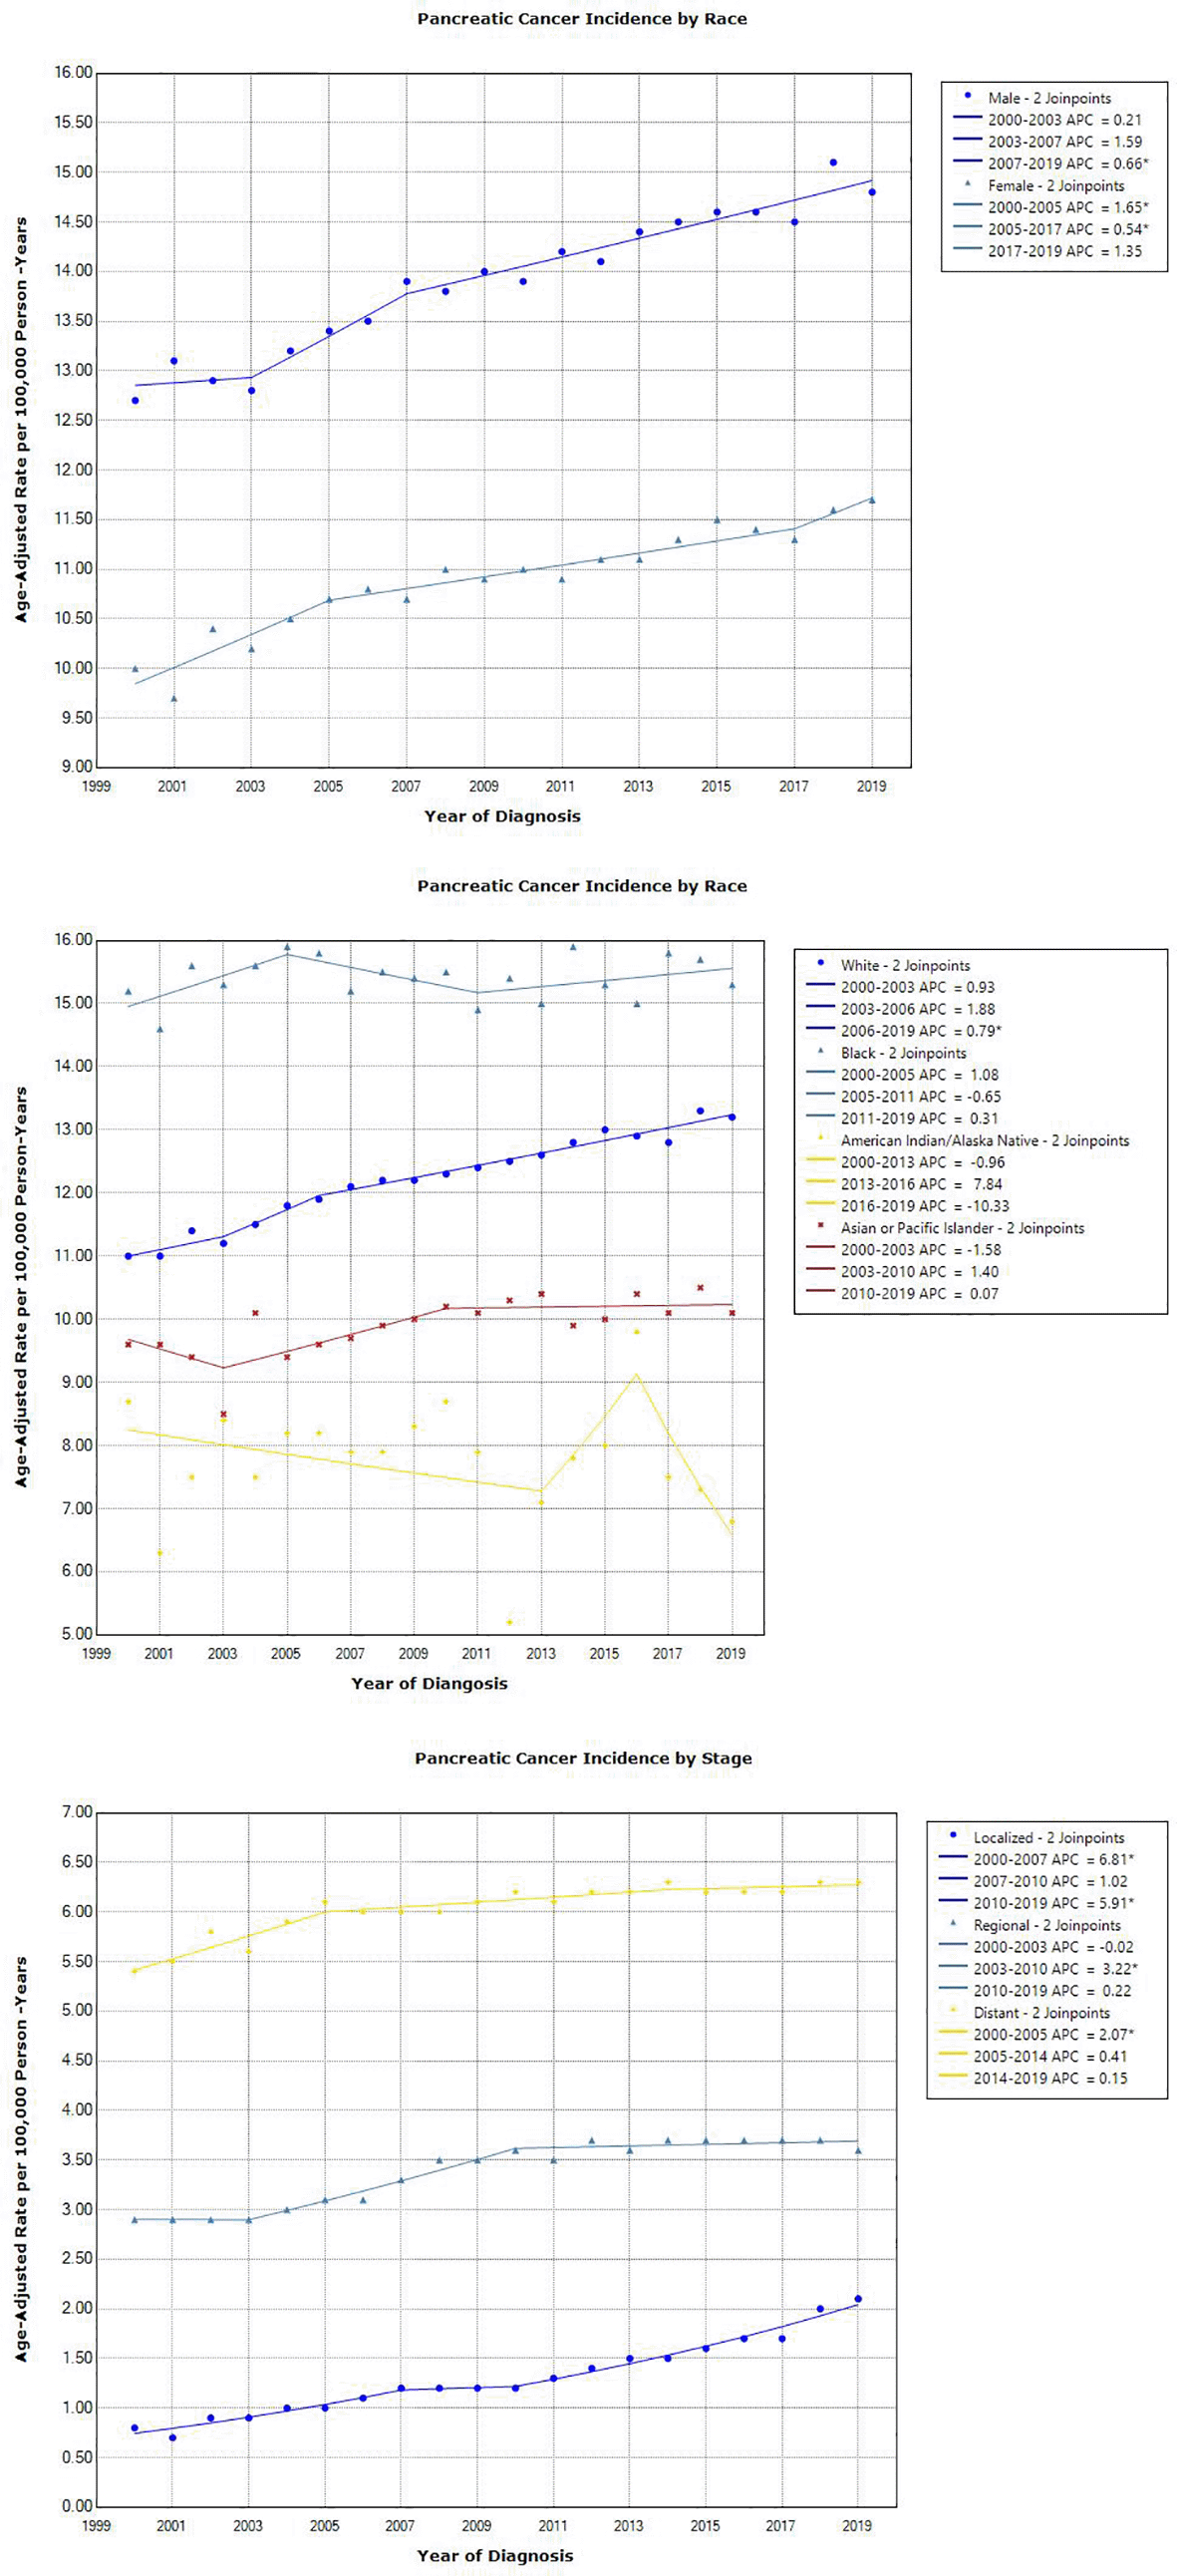
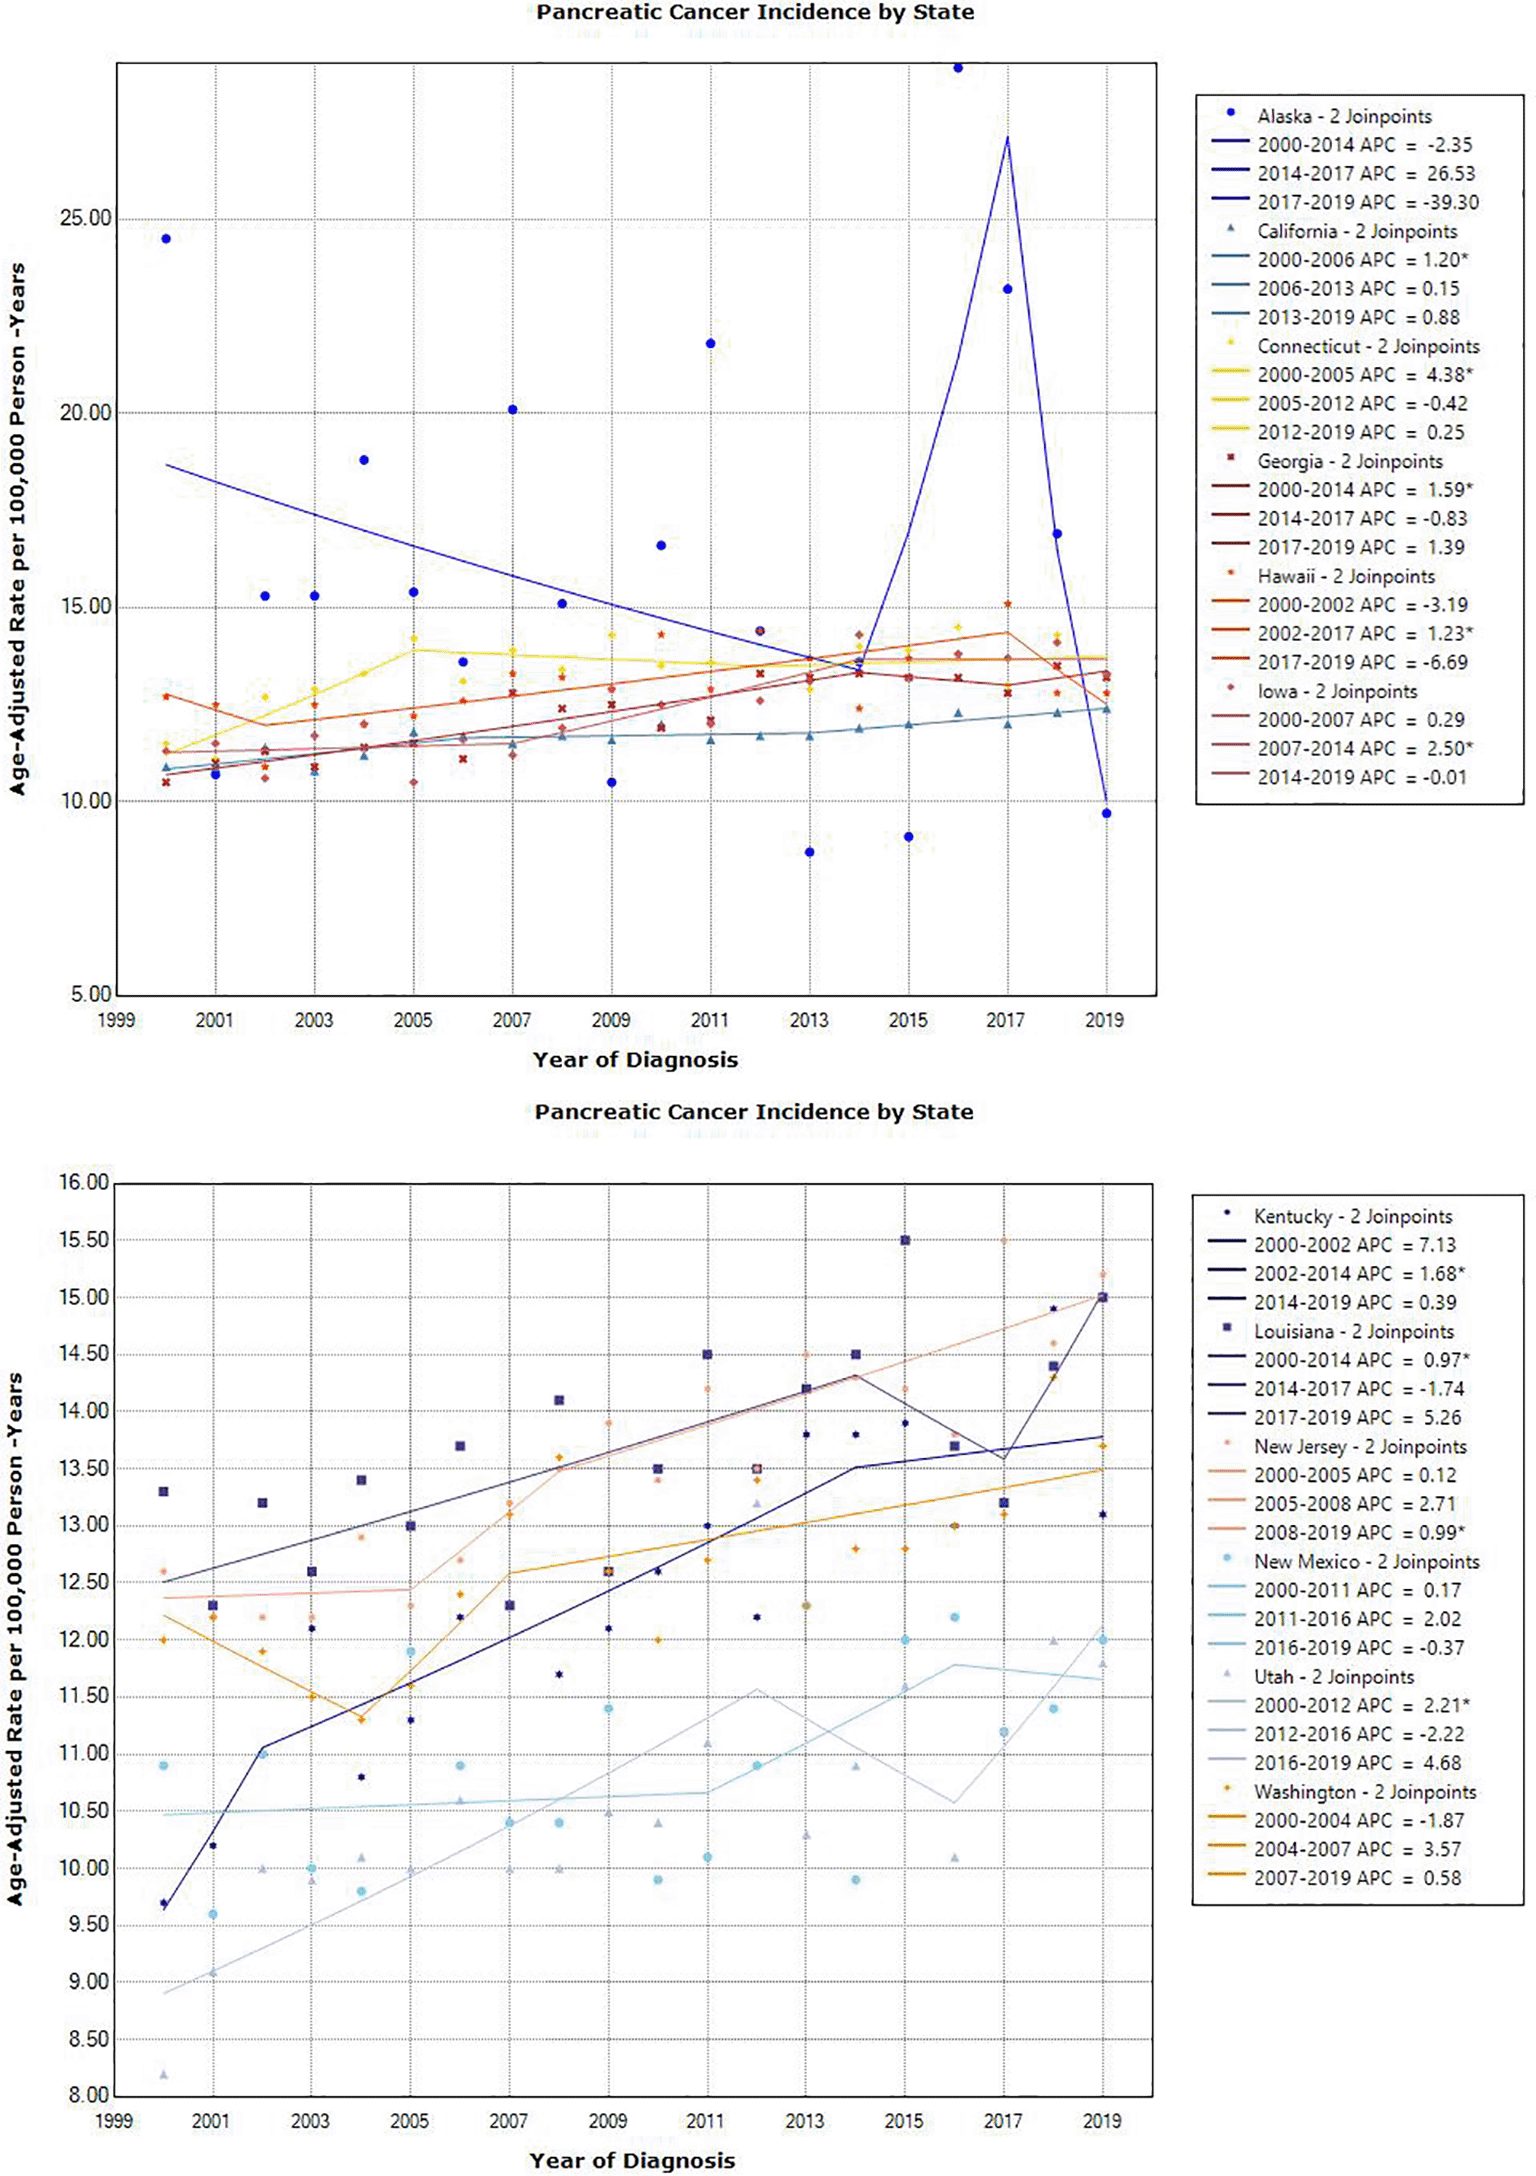
Over the study period, pancreatic incidence rates increased at 0.85% per year (95% Cl, 0.76, 0.92; P < .001). Rates did increase but were not significant during periods 2000-2003; APC, 0.71% (95% Cl, -0.56, 2.0 P = 0.248) and 2003-2006; APC, 1.74% (95% Cl, -0.71, 4.26, P= 0.149, but significantly increased by 0.68% (95% Cl, 0.56, 0.80; P < 0.001) per year during 2006 – 2019. The overall incidence rates increased significantly for all sex, race, age at diagnosis and stage at diagnosis except for Black subjects (APC of 0.04%; 95% Cl, -0.14, 0.22; P = 0.649), and American Indian/Alaska native subjects (APC of -0.22 %; 95% Cl, -1.33, 0.89; P= 0.679). Furthermore, there was an overall significant increase in incidence rates across all states except for Alaska. (file 3) Table 3 describes the pancreatic cancer incidence trends from 2000 – 2019 by sex, race, stage and age at diagnosis. Table 5 pancreatic cancer incidence trends from 2000 – 2019 by geographical location. Figure 2 shows the incidence trends based on sex, race and stage; Figure 3 shows the incidence trends based on state.
*Indicates that the Annual percentage Change (APC) is significantly different from zero at the alpha =0.05 level.
*Indicates that the Annual percentage Change (APC) is significantly different from zero at the alpha =0.05 level.
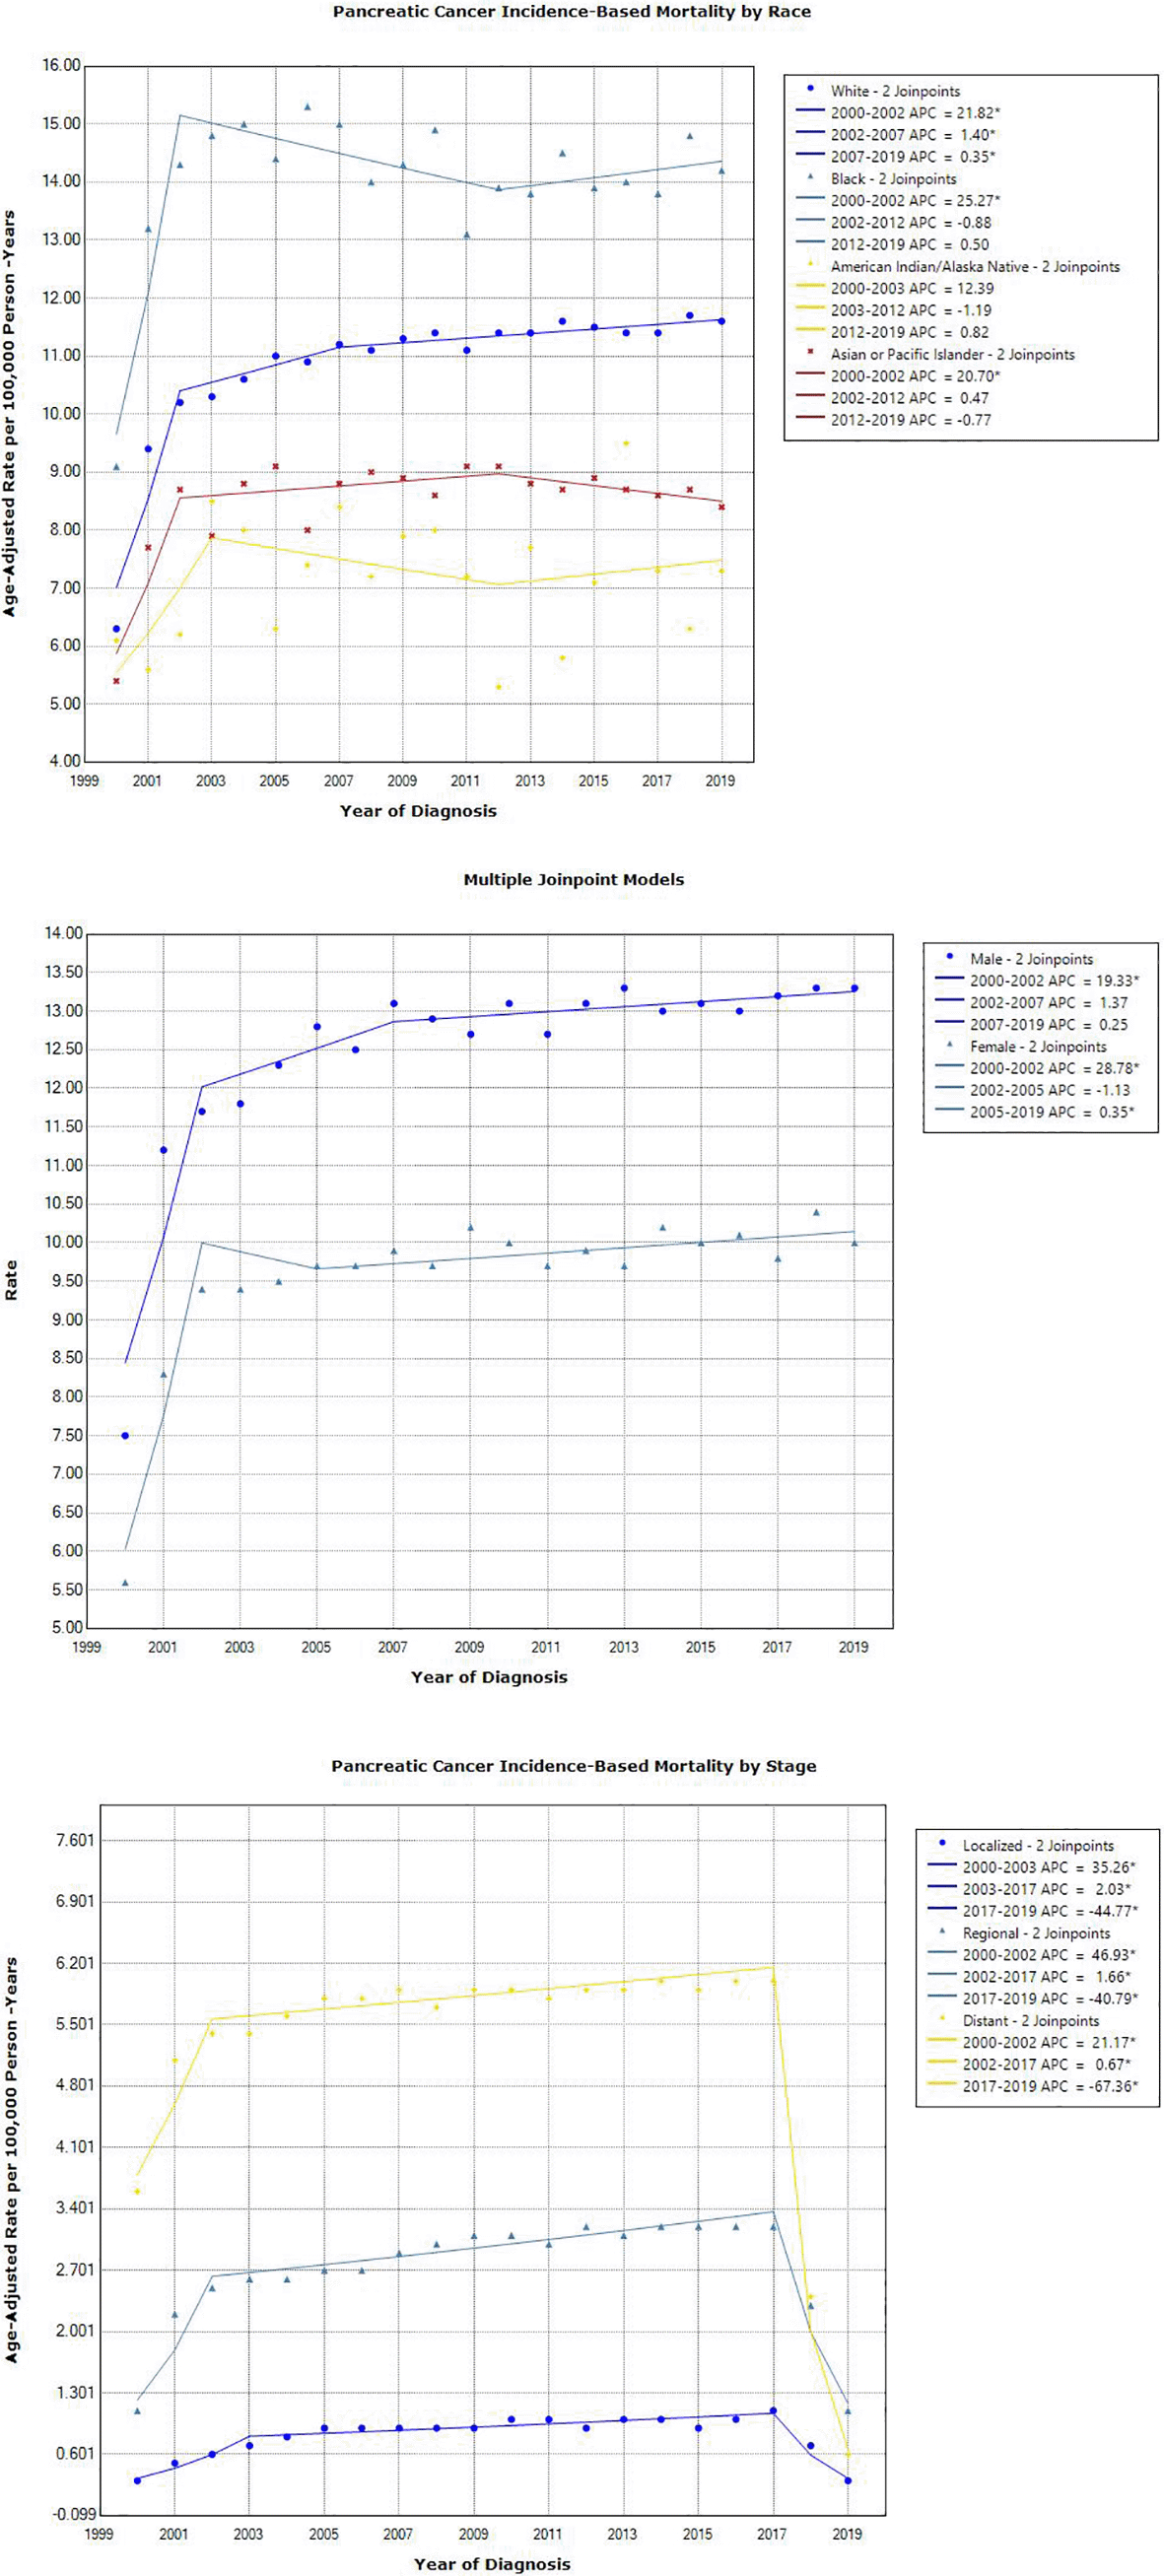
The overall pancreatic incidence-based mortality during the study period was 11 per 100,000 person-years (95% Cl, 10.9,11). Incidence-based mortality of pancreatic cancer was highest in males (12.6; 95% Cl, 12.5,12.7), black subjects (14.1; 95% Cl, 13.9, 14.3), and people older than 60 years (56.1; 95% Cl, 55.8,56.4). In terms of geographical location, incidence-based mortality was highest in Alaska (15.1; 95% Cl, 13.1,17.3), and lowest in Utah (9.6; 95% Cl, 9.3,9.9) compared to other states. Based on the stage at diagnosis, distant staging (5.2; 95% Cl, 5.1, 5.2) had the highest incidence-based mortality compared to stage sub-groups. (Table 2).
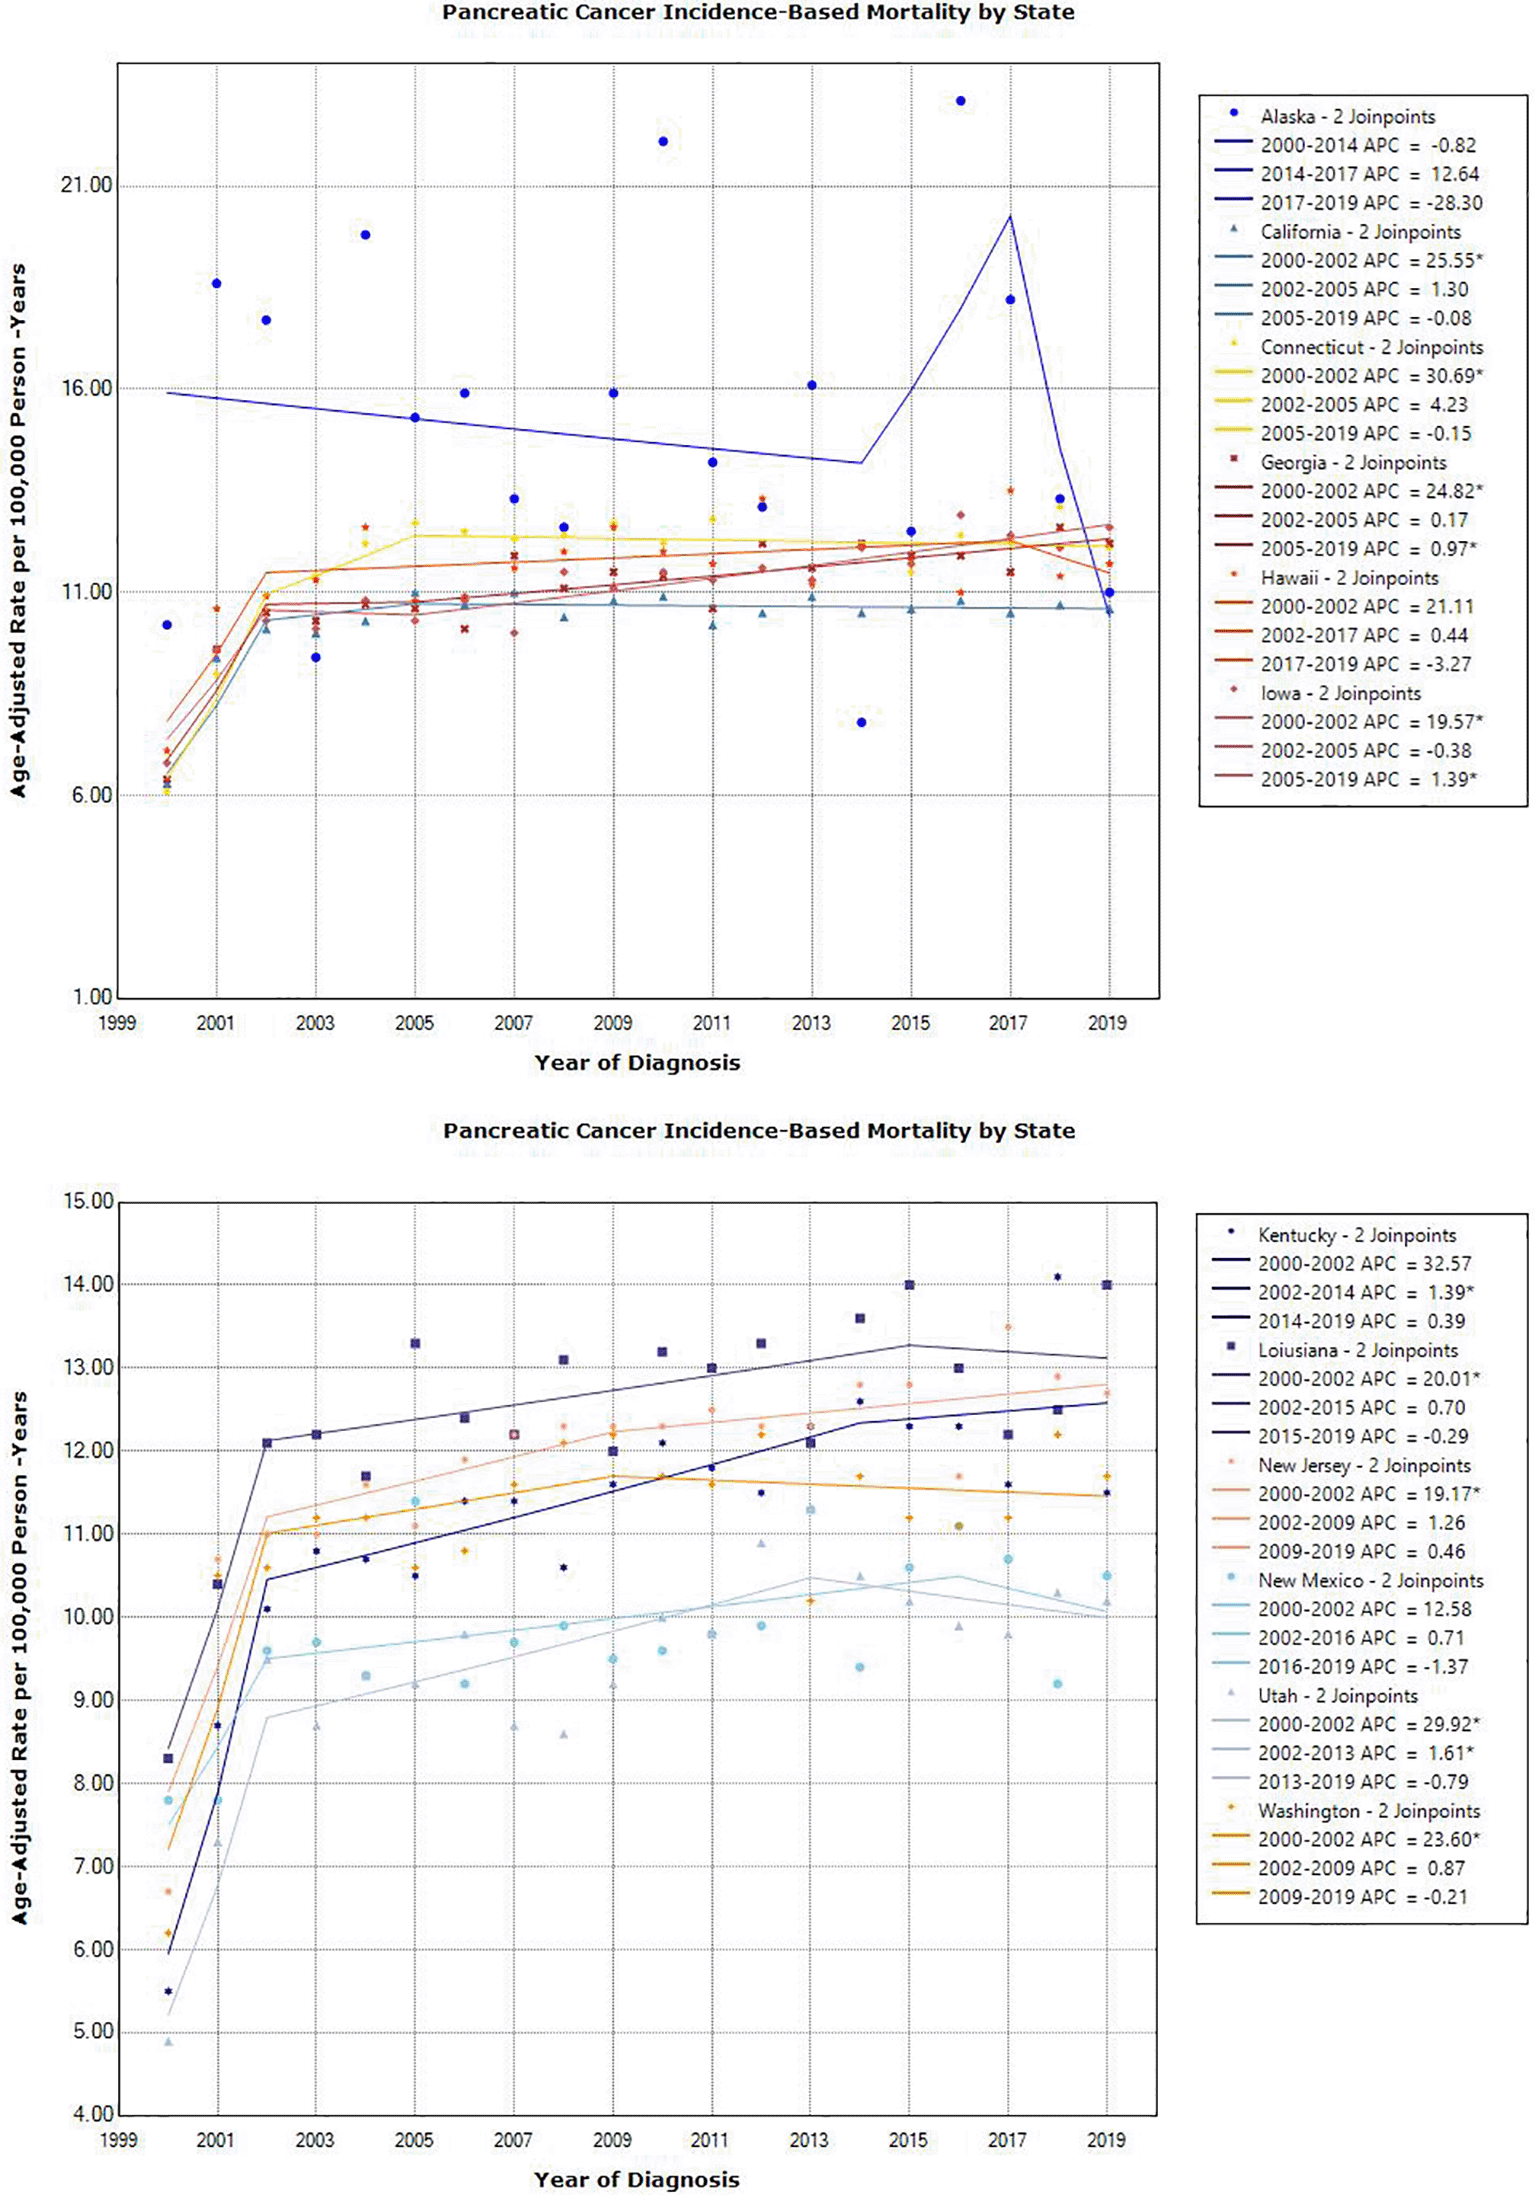
Over the study period, pancreatic incidence-based mortality rates increased at 0.91% per year (95% Cl, 0.32, 1.50; P = .005). There was a significant steep increase from 2000 – 2002 period; APC, 21.57% (95% Cl, 15.88, 27.88 P <0.001), followed by a gradual increase in 2002-2007; APC, 1.02 % (95% Cl, -0.12, 2.17, P= 0.075) which was not significant; However, 2007 – 2019 period increased by 0.27% per year which was significant (95% Cl, 0.07, 0.47; P = 0.013). The overall incidence-based mortality rates increased significantly only in the male subjects APC, 0.95% (95% Cl, 0.36, 1.54; P = 0.003), female subjects APC 1.18 (95% Cl, 0.47, 1.89; P = 0.002) and white subjects APC 1.05% (95% Cl, 0.45, 1.66; P = 0.002) and age at diagnosis. Even though there was an increase in the other subgroups, the increase was not significant. Furthermore, there was an overall significant increase in incidence-based mortality rates across all states except for Alaska, Hawaii and Washington. Table 4 describes the pancreatic cancer incidence-based mortality trends from 2000 – 2019 by sex, race, age at diagnosis and stage. Table 6 pancreatic cancer incidence-based mortality trends from 2000 – 2019 by geographical location.
Figure 4 shows the incidence-based mortality trends based on sex, race and stage at diagnosis; Figure 5 shows the incidence-based mortality trends based on state.
*Indicates that the Annual percentage Change (APC) is significantly different from zero at the alpha =0.05 level.
*Indicates that the Annual percentage Change (APC) is significantly different from zero at the alpha =0.05 level.
Our study highlighted on the trends of incidence and mortality rates of pancreatic cancer in the United States using a single comprehensive registry system from 2000 to 2019. Incidence rates of pancreatic carcinomas consistently increased over time from 2000 to 2019 but differed by gender, race, staging and geographical location. Pancreatic cancer incidence rates increased in all sex, race, stage and age at diagnosis except for Blacks and American Indian/Alaskan Native individuals, although rates of pancreatic cancer consistently were higher overall among the Black population. Such increases in rates of pancreatic cancer have also been observed internationally.21,22 Based on location, the incidence rates increased in most states except for Alaska and Hawaii; Alaska had the overall highest rates of pancreatic cancer incidence per state. Several studies have also reported increases in rates based on location as well.
The Pancreatic incidence-based mortality rates increased consistently in only males, females and white population; while with the other subgroups their incidence-based mortality rates remained relatively the same. Incidence-based mortality of pancreatic cancer was highest in males, black population and in Alaska. Regarding location, the incidence-based mortality rates increased across all states except for Alaska, Hawaii and Washington.
There are have been reported risk factors such as Obesity, Overweight, Tobacco smoking, Diabetes and Chronic pancreatitis that have been associated with Pancreatic Cancer.7,8,9,10 Tobacco smoking is a one of the established risk factors of Pancreatic Cancer.23,24 Several studies have showed a causal relationship with tobacco smoking especially with the number of cigarettes smoked with a study showing risk of pancreatic cancer decreasing by about 40% in two years after smoking cessation.
Vanessa L Gordon-Dseagu et al15 reported a decrease in incidence of pancreatic cancer from 1974 through 1990’s partly due to the drop in the rate of cigarette smoking in the mid-1960s. There has been a notable decline in smoking rates among all age groups, gender and racial/ethnic groups in recent decades but regardless of this decline; pancreatic cancer incidence has been rising steadily. This increase incidence of pancreatic cancers may be related to an increasing prevalence of obesity and overweight. The rate of prevalence of obesity and overweight continues to increase in the United states.25Studies have attributed steady increase in pancreatic cancer incidence to prevalence of obesity and overweight.9
Based on a recent study25, prevalence rates of overweight/obesity have been highest among Male and Black populations; these rates reflect higher pancreatic cancer incidence rates in among these groups. Furthermore, Asian populations have lower pancreatic cancer rates and this may be due to their the low prevalence of obesity and overweight compared with other racial groups.
Diabetes Mellitus has been reported to be associated with pancreatic cancer.8,27–29 It has been reported that abnormalities in glucose metabolism, insulin resistance and deficiency have been associated with pancreatic cancer. A recent meta-analysis reported a higher relative risk for pancreatic cancer associated with diabetes compared to the non-diabetics.26 These studies are further supported with the increase in prevalence rates of diabetes. The prevalence of diabetes was higher in Male population compared to female population as well as Black population compared other racial groups.25 This could be a contributory factor associated with the increase trends of pancreatic cancer incidence.
Overall, the incidence and mortality rates of pancreatic cancer increased consistently from 2000-2019. Our observations are consistent with similar studies done during different time periods. There was a study that focused on pancreatic adenocarcinoma from 1973 to 2014, reporting similar results with our study. Our study focused on all pancreatic cancers from 2000 to 2019. As noted from previous study, there was an overall increase in the incidence and incidence-based mortality rates of pancreatic cancers during the study group.
One of the strengths of our study was use of large population-based database, with SEER 21 covering approximately 26.5% of the US population. This allowed us the opportunity to analyze the recent pancreatic cancer rates. Our study had several limitations due to limited available date from SEERs. Because of the limitations with SEERs database, we were unable to compare factors associated with pancreatic cancer such as lifestyle habits or co-morbidities which prevented us from identifying a direct association between such factors and the incidence and mortality of pancreatic cancer.
Pancreatic cancer incidence and mortality rates have been increasing in recent decades in the USA. We analyzed incidence and mortality rates by sex, race, age, staging, and geographic location. The increasing incidence trends may be attributed to an increase in known risk factors such as smoking, obesity, and diabetes; Health professionals and health policymakers should make a conscious effort in reducing these factors by creating initiatives and efforts at curbing these factors such as awareness, advocating for healthy lifestyles. The increasing mortality trends can be correlated to multiple factors such as late detection and diagnosis. Improvements in early detection, diagnosis and management may reduce the mortality rate over time.
Additional file 1, shows the incidence rates in each individual year from 2000 to 2019.
Additional file 2 shows pancreatic cancer incidence-based mortality rates in each individual year from 2000 to 2019.
Abidoye O: Conceptualization, Investigation, Methodology, Project Administration, Resources, Software, Supervision, Validation, Visualization, Writing – Original Draft Preparation, Writing – Review & Editing; Cho Y: Supervision, Writing – Original Draft Preparation, Writing – Review & Editing; Bhushan S: Writing – Original Draft Preparation; Adewunmi C: Validation; Choudhury H: Validation
| Views | Downloads | |
|---|---|---|
| F1000Research | - | - |
|
PubMed Central
Data from PMC are received and updated monthly.
|
- | - |
Provide sufficient details of any financial or non-financial competing interests to enable users to assess whether your comments might lead a reasonable person to question your impartiality. Consider the following examples, but note that this is not an exhaustive list:
Sign up for content alerts and receive a weekly or monthly email with all newly published articles
Already registered? Sign in
The email address should be the one you originally registered with F1000.
You registered with F1000 via Google, so we cannot reset your password.
To sign in, please click here.
If you still need help with your Google account password, please click here.
You registered with F1000 via Facebook, so we cannot reset your password.
To sign in, please click here.
If you still need help with your Facebook account password, please click here.
If your email address is registered with us, we will email you instructions to reset your password.
If you think you should have received this email but it has not arrived, please check your spam filters and/or contact for further assistance.
Comments on this article Comments (0)