Keywords
mitochondrial genome, nuclear genome, SNP, Agaricomycetes, mushrooms, intraspecific divergence
This article is included in the Genomics and Genetics gateway.
This article is included in the From genes to genomes: Investigating the population species boundary in non-model Fungi collection.
mitochondrial genome, nuclear genome, SNP, Agaricomycetes, mushrooms, intraspecific divergence
The Agaricomycete is the largest Class of fungi within the Division Basidiomycota. More than 100 families, 1,147 genera, and about 21,000 species have been reported in this Class, including many that form mushrooms, the macroscopic fruiting bodies of sexually reproducing fungi.1 Agaricomycete fungi are commonly found around our environments and play important ecological, economic, and medical roles.2 However, our understanding of most Agaricomycetes is still limited and many Agaricomycete mushrooms which seem familiar to us have not been described or were not described until very recently. For example, a local popular golden chanterelle harbored in Newfoundland Island, Canada has been frequently consumed since at least the 1960s, but it was not described until 2017 as a native new species broadly distributed throughout eastern North America.3 On the other side of the globe, several common chanterelle species in China were described only recently4,5
The increasing identification of new mushroom species has been driven by several factors, including more extensive sampling, better methods for identifying biological differences among specimens, and the changing concepts of fungal species.6–8 Indeed, both the species concepts and species delimitation criteria have been evolving, driven largely by the development of molecular markers, analytic tools and scientific approaches.3–5,9 In the biological literature, over 30 species concepts have been proposed and they can be grouped into eight main types for fungi, namely biological species, evolutionary species, phylogenetic species, morphological species, genotypic species, physiological species, ecological species, and genomic species.1–8,10–12 Dating back to the 18th century, Linnaeus began to name mushrooms based on macro-morphological features just like plants and animals, which developed into the most classic morphological species concept in higher fungi, with the taxonomic history for mushroom-forming fungi largely paralleled those of plants and animals.13 Subsequently, the biological species, ecological species, and phylogenetic species concepts were applied to the taxonomy of mushrooms.9,12,14–17 For example, the biological species concept has been used to determine the species limits based on their ability to mate and produce viable fertile offspring for the commercial button mushroom Agaricus bisporus and the honey mushroom Armillaria mellea.14,15 However, over the last 20 years, the phylogenetic species concept has become increasingly popular among mycologists for species identification, including recognizing a range of cryptic species within originally-defined individual species/species complexes.16–20 For example, the world-wide consumed porcini mushrooms (Boletus sensu stricto) share common characteristics such as “stuffed pores”, white context, reticulated stipe surface and the absence of color change after injury.21 However, it is not easy to accurately recognize individual species within the genus through morphological analyses alone. In addition, species within the genus can’t be cultured, thus limiting the application of the biological species concept. Even E.M. Fries, well-known as the “Linnaeus of fungal taxonomy” could not help sighing, “Nullum genus quam Boletorum magnis me molestavit (no genus has given me more trouble than that of the boleti)”.22 In contrast, molecular phylogenetic studies based on DNA sequences revealed its abundant genetic diversity and elucidated the relationships among Boletus edulis and its allies, including identifying several new taxa that subsequently revealed differences in macro- and micro- morphological features, ultrastructure, chemical composition, and ecological niche.21,23 While the combined features have helped resolve the species boundaries, overlapping values and conflicting signals were commonly found among many of the species for most features. Indeed, there is no universally agreed similarity cutoff for any feature for any fungal group. Consequently, there have been many new species reported in the literature for both Boletus and other fungi, with some of the species defined based on relatively few nucleotide differences.16,21
A recently proposed genome sequence-based fungal species concept can potentially unify and standardize the fungal taxonomy framework.24 However, at present, little is known about the distributions of whole-genome sequence divergence within and between closely related species.25 The rapid development in genomics technology and in associated data depository and analyses platforms such as Genome Taxonomy Database (GTDB) have accelerated the development of bacterial and archaeal taxonomy, leading to a standardized bacterial taxonomy based on genome phylogeny.26 Though less abundant than those in Bacteria, the number of sequenced fungal genomes is increasing rapidly.27–29 The presence of such resources allows us to evaluate the amount of whole-genome sequence divergence within fungal species that were defined based on different species concepts and different species delimitation criteria.
Specifically, in this study, we aimed to identify the patterns of genome-wide single nucleotide polymorphisms (SNPs) within species based on publicly available genomes in the fungal Class Agaricomycetes. A SNP is a variation at a single nucleotide position between homologous genes of different organisms.30 At the population level, SNPs are the most common form of genetic variation. SNPs have been used as markers for quantitative trait loci mapping, strain identification, and phylogenetic lineage separation.31–33 Here, we explored the genome-wide SNPs for both the nuclear and the mitochondrial genomes, as well as the ratios between the nuclear and mitochondrial genomes between strains within each species of Agaricomycetes where whole-genome sequence data from two strains are available.
The assembled nuclear and mitochondrial (mt) genome data of Agaricomycetes were downloaded from the National Center of Biology Information (NCBI) and the Joint Genome Institute (JGI) genome database deposited up to August 31, 2022. For each analyzed genome, the sequencing technology used, assembled genome size, sequencing read coverage depth, number of scaffolds and/or contigs, N50 (the minimum scaffold/contig length needed to cover 50 of the genome, L50 (the number of contigs required to reach N50), the mitogenome size and the related references were all retrieved when available. The species containing sequences from at least two nuclear genomes and/or two mitochondrial genomes were selected for our analyses.
The genome-wide SNP analyses within individual species were determined by the alignment-based program MUMmer 3.23,34 with longer assemblies (larger genome and better assembled genomes/fewer scaffolds) in each pairwise comparison serving as the reference for each analyzed species. Our alignments used the following specific commands: “-mum -p” parameter for aligning each pair of assembled genomes and identifying overlapping regions between two profiles (maxgap = 500, mincluster = 100), followed by “delta-filter -1” processing to filter out repeated comparisons, then “show-snps -CHITrl” to detect base substitutions. Insertions and deletions (InDels) in those overlapping regions were excluded from SNP frequency calculations. The series of commands were completed through two remote servers from Compute Canada. For each pair of genomes, their SNP frequency was calculated as the total number of observed SNPs between them over the reported smaller genome size of the genome pair. Density plots were generated from R package ggplot235 to show the distribution of the calculated SNP frequencies for all pairwise comparisons. The plots were exported to and modified manually by Adobe Photoshop CS6.
Statistical significance for the observed differences in SNP frequencies was determined using the non-parametric test for paired data. Specifically, SNP frequencies derived from the nuclear and mitochondrial genome comparisons were exported to the online data analysis platform SPSSPRO (Scientific Platform Serving for Statistics Professional). Spearman’s non-parametric rank correlation procedure was used to detect the potential correlation between the paired nuclear and mitochondrial datasets. Only p values below 0.05 were considered statistically significant. The Spearman R values were used to infer the strength of the correlations (0–0.2, very weak; 0.2–0.4, weak; 0.4–0.6, moderate; 0.6–0.8, strong; 0.8–1.0, very strong). Furthermore, the Shapiro-Wilk test was used to check whether the SNP frequency data conformed to a normal distribution. A T-test was conducted to determine the statistical significance of the difference between two datasets if both datasets conformed to a normal distribution. Alternatively, the Wilcoxon signed-rank test was used if the SNP frequency distribution did not conform to a normal distribution.36
For species where genome sequences from multiple (more than three) strains were available, we analyzed the relationships between inter-strain SNP frequencies and their geographic distances if the strains spanned at least two continents. The quantitative relationship between the inter-strain SNP frequencies within species and their geographic distances was investigated through the online data analysis platform SPSSPRO based on Spearman’s non-parametric rank correlation procedure.
Among the Agaricomycetes, 112 species from 72 genera contained whole genome-sequenced and assembled nuclear and/or mitochondrial genomes from at least two strains within each of the species. In total, 398 nuclear genomes and 106 mt genomes from these 112 species were downloaded and their genome-wide SNP frequencies were analyzed (Underlying data: Supplementary Table 1, sheet 1).37 When available, the whole-genome SNP frequencies were calculated between all pairs of nuclear genomes and all pairs of mitochondrial genomes separately within each of the 112 species. Of the 112 species, 22 species contained at least two strains each with assembled whole genome sequences from both the nuclear and mitochondrial genomes. The genome information of the 72 strains in these 22 species is listed separately in the Underlying data: Supplementary Table 1, sheet 2.37 For these 22 species, the relative divergences of their nuclear and mitochondrial genomes among strains within each species were determined and compared. The original GenBank accession numbers of the compared genomes are presented as underlying data.37
The nuclear genome SNP frequencies varied greatly among strain pairs from within the same species (Table 1). The highest inter-strain SNP frequency based on the nuclear genome data (7.69) was found within Rhizoctonia solani (between strains AG1-1C AG-1 IB O8/2), followed by Schizophyllum commune (7.35, between strains 14-112S77 Loenen D) and Hericium coralloides (6.93, between strains FP-101451 tvtc0002). The lowest inter-strain nuclear genome SNP frequency was found between two samples of Heterobasidion irregulare (between strains SAMEA6501289 SAMEA6501290) where no SNP was found between their nuclear genomes. In addition, only one SNP was detected between two strains within Hypsizygus marmoreus (between strains HM62 NN12) (Table 1).
Within the listed 72 genera, the nuclear and/or mitochondrial genome sequences are available from two or more strains within at least one species of each of these 72 genera.
Similar to those observed from the nuclear genome comparisons, the mitochondrial genome SNP frequencies varied greatly among strain pairs from within the same species (Table 1). The top three highest mitochondrial genome SNP frequencies within species were found in Hericium coralloides (4.41, between strains FP-101451 tvtc0002), Schizophyllum commune (2.83, between strains 225.1 5334) and Suillus brevipes (2.79, between strains FC45 Sb2). However, there was no SNP within four of the 31 species where multiple mitochondrial genomes were available, namely Armillaria borealis (between strains AB13-TR4-IP16 47425), Schizophyllum commune (between strains ZB1 X44, among strains 227.1, 227.2 and UNK), Trametes coccinea (between strains CIRM-BRFM 310 158605), and Taiwanofungus camphoratus (between strains W1 W2, M8 W2, V5 V7).
We compared the inter-strain SNP frequencies between the nuclear and mitochondrial genomes within 22 Agaricomycete species. Only strains with both the nuclear and mitochondrial genome sequence information were included in this comparison. Our analyses revealed that overall, the nuclear genome SNP frequency was higher than the mitochondrial genome SNP frequency in the intraspecific comparisons (Table 1 and Figure 1).
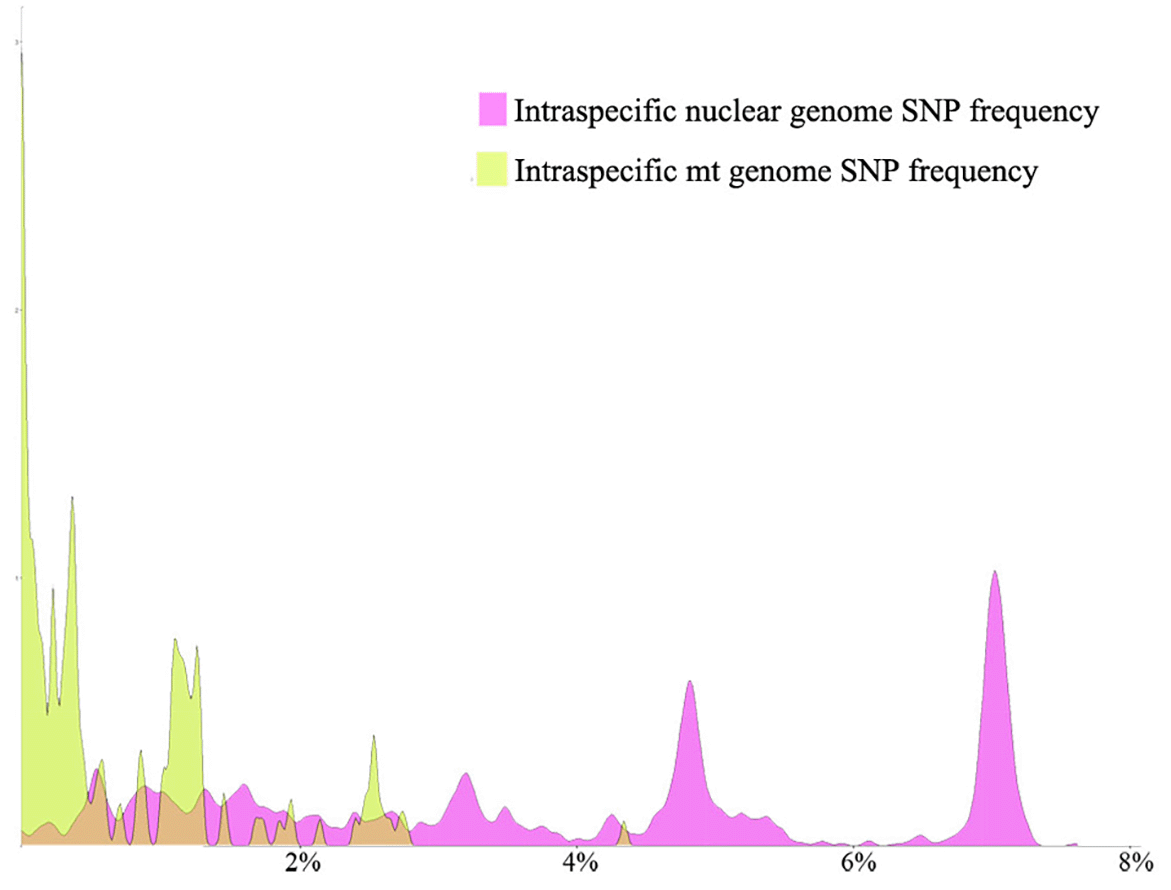
The SNP frequencies for both the nuclear and mitochondrial genomes rejected the hypothesis of normal distribution. Thus, the non-parametric Wilcoxon signed-rank test was conducted to identify whether the difference between the paired data was statistically significant. Specifically, we included 147 paired SNP frequencies in this comparison. The result indicated a significant difference between the nuclear and mitochondrial genome SNP frequencies, with the nuclear genome showing an average of more than 300 greater SNP frequency than the mitochondrial genome SNPs (p < 0.01; 2.86 vs 0.59 on average) (Figure 1).
From the 147 strain pairs within the 22 species with both nuclear genome and mitochondrial genome SNP frequency data, we found a weak but statistically significant positive correlation between nuclear genome and mitochondrial genome SNP frequencies (R = 0.391, p < 0.01).
Among these strains and species, the average inter-strain nuclear genome SNP frequency within species was 2.86 and the standard deviation was 1.62. By comparison, the average inter-strain mitochondrial genome SNP frequency was 0.59 and the standard deviation was 0.65. The coefficient of variation (standard deviation/mean) for the two datasets were 0.57 and 1.11, respectively. Thus, overall, the nuclear genome SNP frequency within species had a relatively tighter distribution than that of the mitochondrial genome. The distribution and relationship of the two group datasets are shown in Figure 2a.
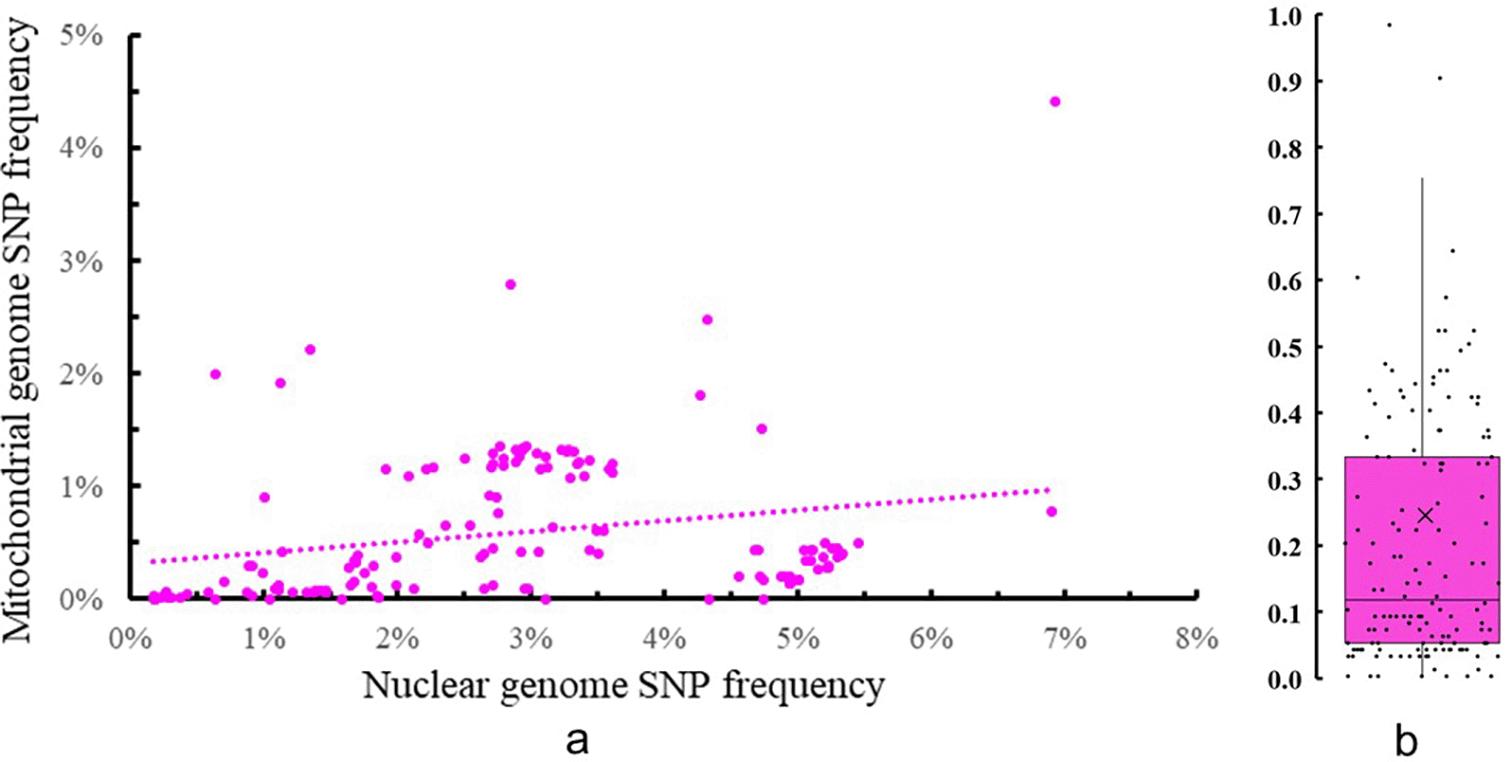
Based on the paired inter-strain nuclear vs mitochondrial SNP frequency comparisons in the 22 divergent species, the mitochondrial genome showed less difference than the nuclear genome in 144 of the 147 paired comparisons that covered 20 of the 22 species. For the remaining three paired comparisons representing two species, the mitochondrial genome showed more difference than the nuclear genome. Among the 22 species, the average ratio of mitochondrial genome SNP frequency and nuclear genome frequency was 0.24 with the standard deviation 0.35, the coefficient of variation for the dataset was 1.47 (Figure 2b). Detailed data, including the intraspecific SNP frequencies from all the paired genomes and their ratios, are shown in the Underlying data: Supplementary Table 1, sheet 3.37 A clear majority (95) of the values are below 0.6 and only three values were more than one (which are not shown in Figure 2b). The highest ratio (3.14) was found between strains RHP3577 ss4 and RV95-379 of Lentinula lateritia, a close relative of the Shiitake mushroom. This pair of strains had a nuclear genome SNP frequency of 0.63 while the mitochondrial genome SNP frequency was1.99. The lowest value of the inter-genome SNP frequency ratio was 0.00, found in several pairs of strains where their mitochondrial genomes were identical to each other.
For the intraspecific nuclear genome SNP frequency analyses, there were 42 species with each containing at least three nuclear genome sequences in NCBI/JGI. Among these, we found eight broadly distributed species with nuclear genome sequences from at least four strains and whose geographical site data were available. Among the eight species, the following six showed statistically significant positive correlation between geographical distance and inter-strain SNP frequency: namely Agaricus bisporus, Boletus edulis, Pleurotus eryngii, Pyrrhoderma noxium, Schizophyllum commune and Serpula lacrymans. The relationships between geographical distances and nuclear genome SNP frequencies within each of these six species are shown in Figure 3 with the original data used for the figure listed in the Underlying data: Supplementary Table 1, sheet 4.37 The two species that showed no significant correlation between nuclear genome SNP frequency and geographic distance were Laetiporus sulphureus and Pleurotus ostreatus.
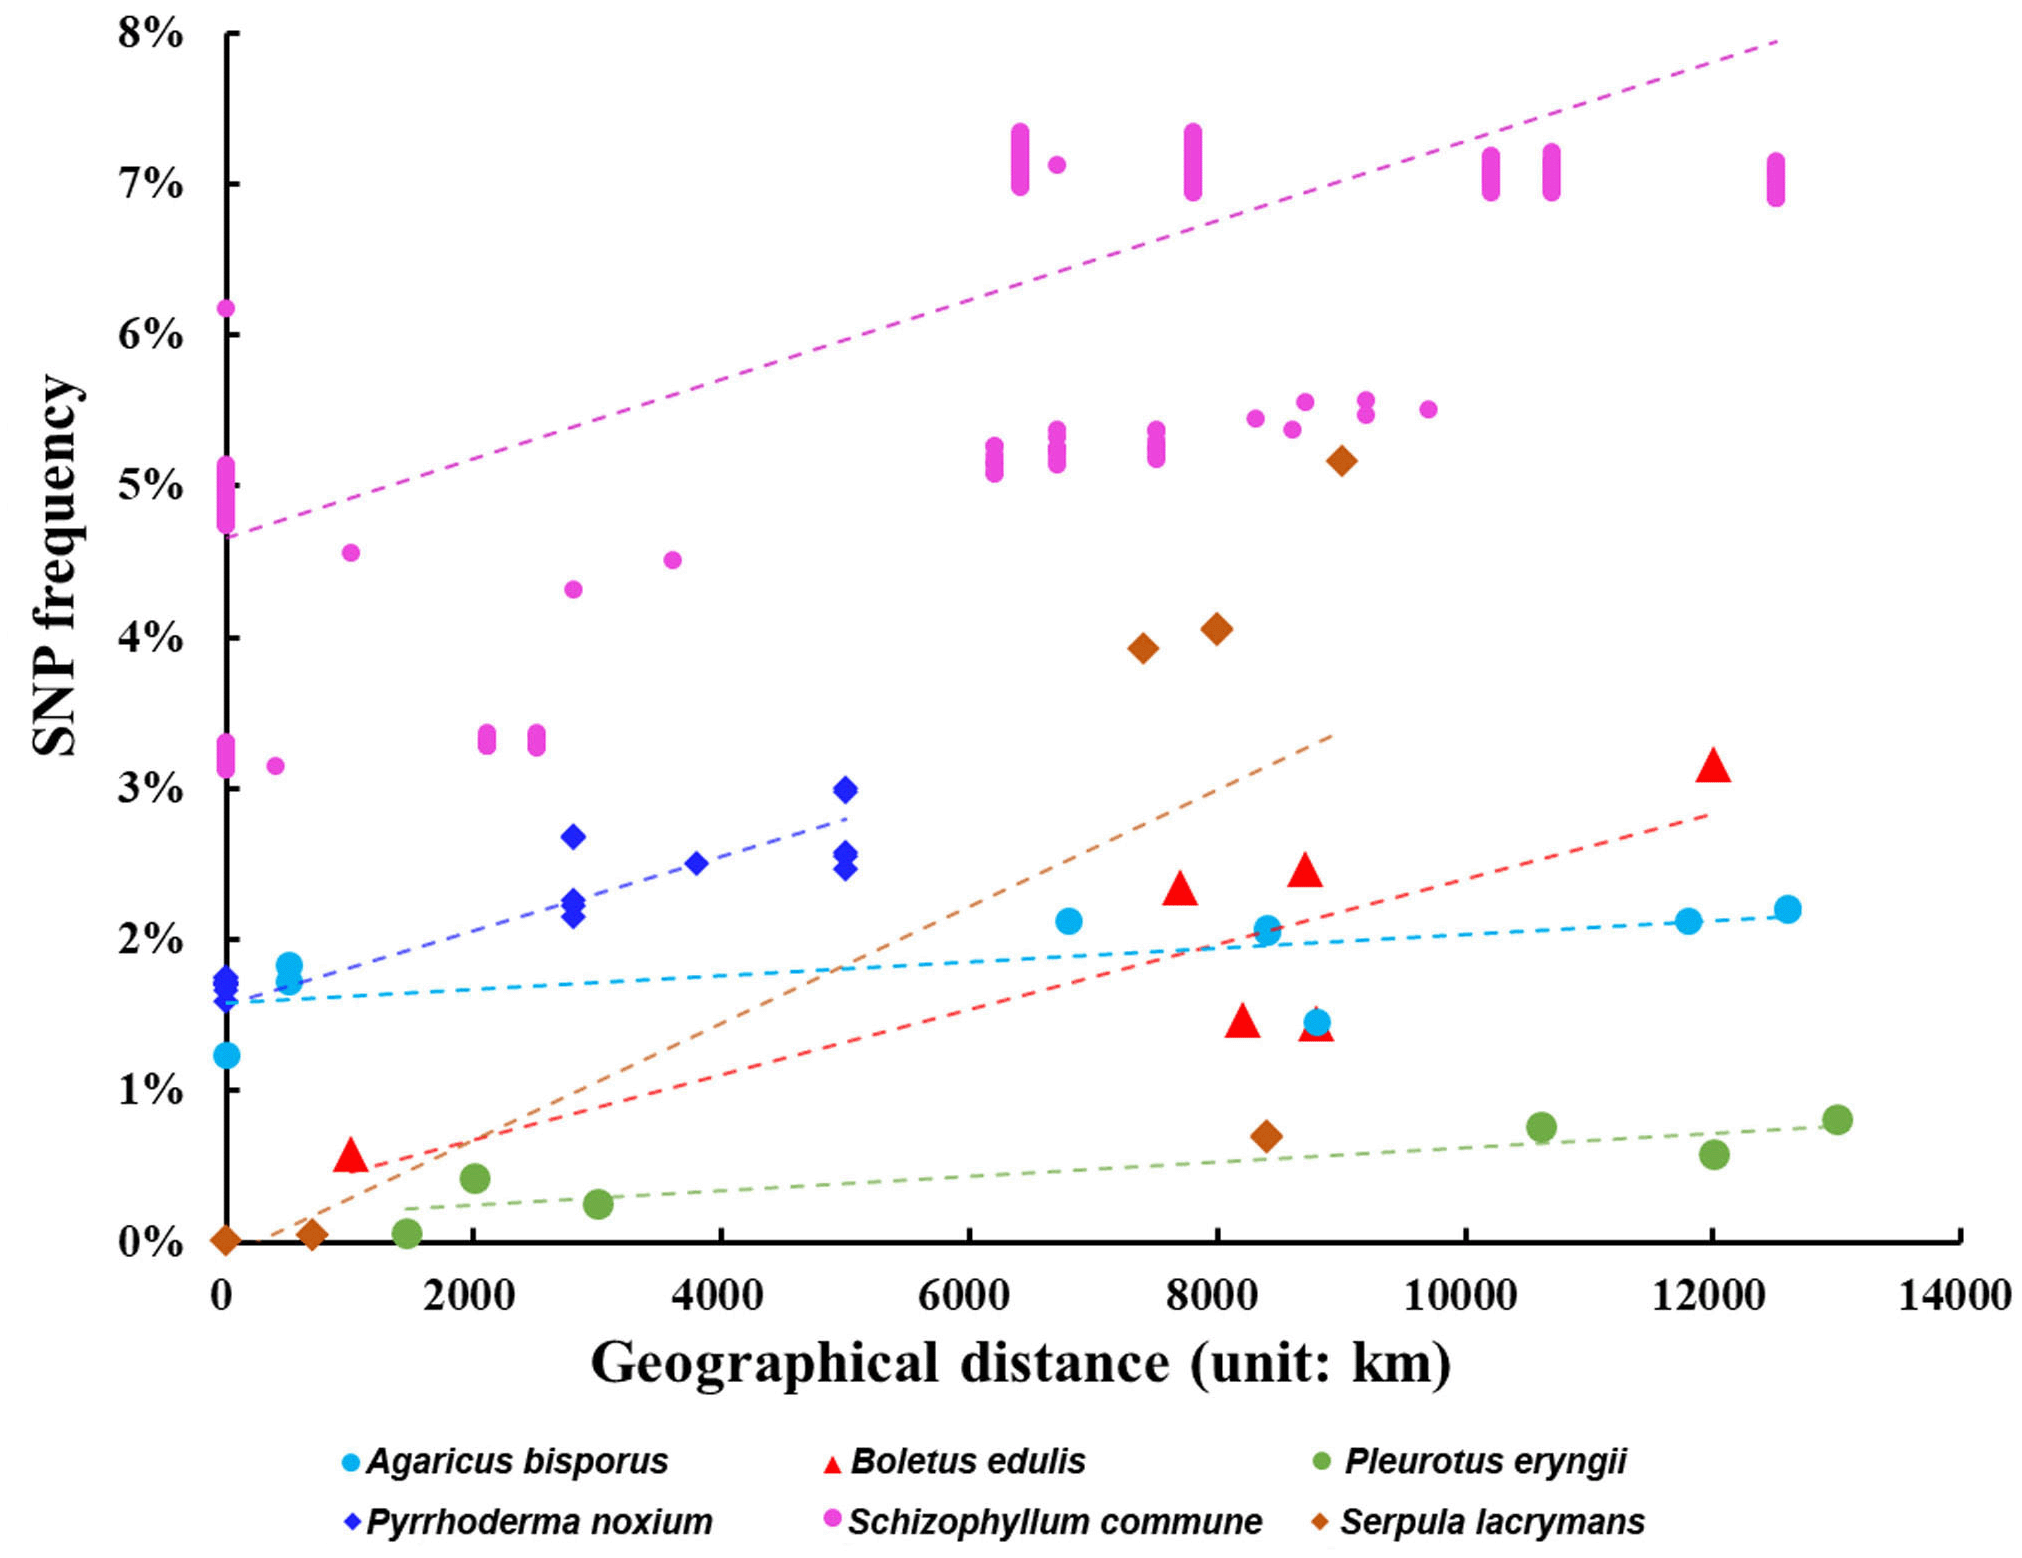
Each species is represented by a different color as shown at the bottom of the figure.
In this study, we investigated the inter-strain genomic SNP frequencies within species in Agaricomycetes and revealed broad variations in their genome sequence divergence between strains for both the nuclear and the mitochondrial genomes. Overall, we found a positive correlation between the nuclear and mitochondrial genome SNP frequencies within these analyzed taxa, and with the nuclear genome SNP frequencies being about four times of that in the mitochondrial genomes. In addition, positive correlations between geographical distance and SNP frequencies were found in six of the eight species where strains from multiple continents were sequenced. Below we discuss the implications of these results with regard to genome evolution and taxonomy in Agaricomycetes.
The positive correlation between geographical distance and SNP frequencies in six of eight species are indicative of the effect of long-distance geographical separation on sequence divergence within species. Indeed, geographic separation is known to play a significant role in genome divergence and speciation in many mushroom-forming fungi.16–18,38 Interestingly, within the eight individual species where strains from multiple continents were sequenced and compared, two failed to show a strong positive correlation between geographic distance and SNP frequencies. Both species are widely distributed and consumed: the chicken mushroom Laetiporus sulphureus has both edible and medicinal values, and the oyster mushroom Pleurotus ostreatus is broadly cultivated throughout the world. Thus, their lack of correlation between geographic distance and genome-wide SNP frequencies is not surprising given the widespread collection, cultivation, consumption, and trade of germplasm of the two species among geographic regions, contributing to recent gene flow and reduced differences among geographic populations.2 Gene flow due to anthropogenic influences have been reported in multiple fungal species, including Agaricus bisporus and Amanita exitialis.39–42 For A. bisporus, even though it’s a widely cultivated and globally consumed mushroom and gene flow has been reported, the sequenced strains were chosen to represent the indigenous germplasms within each region for comparative studies.43–46 Such a strain selection bias contributed to the positive correlation between nuclear genome SNPs and geographic distances in A. bisporus.
Mitochondrial genes and genomes have been used extensively for phylogeographic and phylogenetic studies in a variety of eukaryotes, including fungi. Indeed, due to the small genome size and multicopy nature of the mitochondrial genomes, it’s typically much easier to obtain gene sequences from the mitochondrial genome and to assemble full mitochondrial genomes than those of the nuclear genomes. Within several Agaricomycete species such as the commercial button mushroom A. bisporus and the pine mushroomTricholoma matsutake,47,48 the mitochondrial genomes have also shown evidence of geographic differentiation. Interestingly, within 20 of the 22 analyzed species, the paired nuclear and mitochondrial genome SNP frequencies revealed overall significantly greater SNP frequencies in the nuclear genome than in the mitochondrial genome. Such a pattern is consistent with earlier observations in selected fungi49 but different from those observed in animals where mitochondria typically evolve significantly faster than nuclear genomes.50
The broad variations in both nuclear and mitochondrial genome sequence divergence observed here are consistent with what was described in an earlier review showing a range of nuclear and mitochondrial genome divergence rates in fungi.49 However, for most inter-strain comparisons within most species, the ratios of mitochondrial genomes SNP frequency over the nuclear genome SNP frequency within species were low, with a mean of 0.24 across the 22 species. This ratio is very close to the theoretical ratio predicted for a dioecious diploid species with maternal mitochondrial inheritance where the effective gene number in mitochondria is one-fourth of that in the nucleus in idealized populations.51 Assuming an equal mutation rate for the nuclear and mitochondrial genomes, we would expect that the mitochondrial genome divergence within species to be about one-fourth of that for the nuclear genome in such organisms.51 The mean observed ratio (0.24) among the 22 Agaricomycete species being close to the expected ratio (one-fourth) for a dioecious diploid species forms a contrast to that in animals. In the majority of animals, despite having a higher effective gene number in the nuclear genome (four times of that over the mitochondrial genome), sequence variation in the mitochondrial genome is often significantly higher than that in nuclear genomes, primarily due to high mutation rates in their mitochondrial genomes. In our 147 pairwise comparisons, three showed high ratios of inter-strain mitochondrial/nuclear genome SNP frequencies exceeding one: Lentinula lateritia (3.14, between strains RHP3577 ss4 RV95-379) and Leucoagaricus gongylophorus (1.72, between strains AL2 AS2; 1.64, between strains AB2 AL2). At present, the reasons for such high ratios in these three comparisons are not known. A high mitochondrial mutation rate for a couple of the strains, similar to that observed in animals, could have contributed to the high ratios. Alternatively, hybridization between divergent taxa could have caused mitochondrial genome(s) from different species being associated with nuclear genome(s) of one species. In such cases, the compared mitochondrial genomes represented different species/varieties while the nuclear genomes were from the same species, resulting in such high ratios of inter-strain mitochondrial/nuclear genome SNP frequencies. Additional analyses of closely related species are needed to test the second possibility.
At present, morphological, sexual compatibility, ecological, and geographic features are often combined with phylogenetic analyses of DNA sequences at one or a few genes to differentiate existing species and describe new species. In this study, we observed broad variations in genome-wide SNP frequencies for both the nuclear and the mitochondrial genomes. Thus, our findings highlight the difficulty in applying one threshold of genome-wide SNP frequency to define species among broad taxonomic groups within Agaricomycetes. Indeed, almost any threshold value we apply will lead to changes in existing taxonomy. While setting such a threshold may be desirable in the long run, in the short term, one potential solution is to acknowledge the differences in intraspecies genome divergence among taxonomic groups and use the current intraspecific sequence divergences within individual genera as references to define new species within each corresponding genus.
On the other hand, the ratios of inter-strain mitochondrial genome SNP frequency vs nuclear genome SNP frequency showed a tight distribution, with overwhelming majority values being close to or smaller than the theoretic value of 0.25. We believe such ratios represent a promising indicator in species delineation in Agaricomycetes. In Agaricomycetes, most species are dikaryotic, their mushroom-forming ability represents their sexual cycle and mitochondrial inheritance is primarily uniparental.52 Together, these features predict that within an inter-breeding population in nature, the effective mitochondrial gene number is about one-fourth of that in the nuclear genome. And, assuming a similar base substitution rate between the mitochondrial and nuclear genomes, the observed SNP frequencies among strains within species should approach 0.25. In contrast, between reproductively isolated species and assuming a similar mutation rate, the smaller effective gene number within species means that between species, the mitochondrial genomes should diverge from each other faster than the nuclear genomes. The different patterns of mitochondrial and nuclear divergences within and between species could potentially result in a larger gap between species than within species, ideal for species delineation. In addition, using a ratio for species delineation has the advantage of being relatively independent of the mutation rate of individual species. Indeed, in S. commune, due to its high mutation rate, both the nuclear and mitochondrial genomes showed very high sequence divergence among strains.53 However, their mean ratio was 0.06 ( SD of 0.029; range 0.00–0.10; Underlying data: Supplementary Table 1, sheet 3),37 a much tighter distribution than the inter-strain SNP frequencies for both the nuclear and the mitochondrial genomes. Additional analyses of more taxa, including those of sister species and broad sampling within individual taxa, are needed in order to determine the usefulness of this measure in fungal taxonomy.
Through analyzing 398 nuclear and 106 mitochondrial genomes representing 112 species within 72 genera, we found broad inter-strain SNP frequencies among species in Agaricomycetes. Overall, we found a weak but statistically significant positive correlation between the paired nuclear and mitochondrial genome SNP frequencies. Different from those in animals, we observed an overall significantly higher SNP frequency in the nuclear genome than in the mitochondrial genomes between strains within most species. Interestingly, across the broad Basidiomycetes, the ratios of mitochondrial genome SNPs and nuclear genome SNPs between pairs of strains within each species were almost all lower than 1, with a mean of 0.24. Our analyses suggest that the ratio of mitochondrial genome SNP frequency to nuclear genome SNP frequency could potentially serve as an indicator for genome sequence-based species identification.
| Views | Downloads | |
|---|---|---|
| F1000Research | - | - |
|
PubMed Central
Data from PMC are received and updated monthly.
|
- | - |
Provide sufficient details of any financial or non-financial competing interests to enable users to assess whether your comments might lead a reasonable person to question your impartiality. Consider the following examples, but note that this is not an exhaustive list:
Sign up for content alerts and receive a weekly or monthly email with all newly published articles
Already registered? Sign in
The email address should be the one you originally registered with F1000.
You registered with F1000 via Google, so we cannot reset your password.
To sign in, please click here.
If you still need help with your Google account password, please click here.
You registered with F1000 via Facebook, so we cannot reset your password.
To sign in, please click here.
If you still need help with your Facebook account password, please click here.
If your email address is registered with us, we will email you instructions to reset your password.
If you think you should have received this email but it has not arrived, please check your spam filters and/or contact for further assistance.
Comments on this article Comments (0)