Keywords
Skeletal Class III malocclusion, chin cup, low-dose computed tomography, lose-dose CT, volumetric assessment
Skeletal Class III malocclusion, chin cup, low-dose computed tomography, lose-dose CT, volumetric assessment
The efficacy of the chin cup in controlling mandibular growth remains a controversial matter.1,2 Findings in some clinical studies support retardation or restriction of mandibular growth,3–5 but others show the opposite.6,7 Still, other studies highlight only changes in shape and redirection of mandibular growth.8,9 The conclusion of Liu's2 systematic review indicated insufficient data to judge the efficacy of the chin cup on mandibular inhibition. A recent systematic review by Chatzoudi1 concluded that more high-quality studies with proper methodology, untreated control groups, and reliable measurements are needed. Moreover, the supposed changes in the temporomandibular joint (TMJ) due to the retraction force applied by a chin cup is not yet clear. Zurfluh10 stated that the low-quality data from past studies hindered pointing out clear statements regarding the effects of chin-cup treatment on TMJ. Nevertheless, TMJ changes associated with this treatment need to be evaluated.
Previously, mandibular adaptation to chin cup force has been evaluated using two-dimensional (2D) lateral cephalograms or panoramic radiographs. However, the information provided by these techniques is limited in evaluating the condyles and mandibular ramus.11 Therefore, the three-dimensional (3D) analysis using 3D computed tomography (CT) or cone-beam CT (CBCT) has become important.12 Although CBCT uses relatively low radiation compared to conventional CT, the accuracy of this technique is still doubtful in detecting condylar changes.13,14 Low-dose CT is an alternative reliable procedure with an effective dose approximately equal to traditional radiographs.15 This technique has been used in some clinical studies.16,17
Histologically, experimental animal studies have demonstrated a reduction in the width of the prechondroblastic zone and a decrease in the cellularity of the condylar head after chin cup therapy.18 In this respect, investigating the volumetric changes in condyles may be useful.
To our knowledge, no study has investigated the volumetric changes of the mandible and condyles after early chin cup therapy. This randomized controlled trial aimed to evaluate the changes in the mandible, condyles, and glenoid fossa following the chincup therapy of Class III malocclusion patients in comparison with those changes in a control group of untreated patients. It aimed to test the null hypotheses that no significant differences existed between the chincup and the control group concerning the changes in the mandible, the condyles, and the glenoid fossa.
The research was designed as a single-center, 2-arm, parallel-group randomized controlled trial with a 1:1 allocation ratio and guided by the CONSORT statement.19 The study was conducted in the Department of Orthodontics at the University of Damascus Dental School between January 2019 to January 2022. This study was approved by the Regional Ethical Committee on Research of the Damascus University, Faculty of Dentistry, Syria (UDDS-2788-2016PG) on January 11, 2019. The study was registered at ClinicalTrails.gov (Identifier: NCT05350306) on 28 April, 2022 after the onset of the study. Retrospective registration was done as the regulations at the Univeristy of Damascus do not oblige researchers to register their trial protocols before the commencement of their research work. However, this protocol was registered retrospectively to publish the trial's results. This article is reported in line with the CONSORT guidelines.44
Sample estimation was calculated using Minitab® Version 18 (Minitab Inc., State College, Pennsylvania, USA). An independent t-test, statistical power of 85%, and a significance level of 0.05 were among the assumptions for this calculation. In total, 17 children were required in each group to detect a 1 mm significant difference in total mandibular length (Co-Gn) based on the standard deviation of this measurement for a previous study (0.92).20 Four patients were added to the experimental and control groups (2 patients in each group) to compensate for potential dropouts.
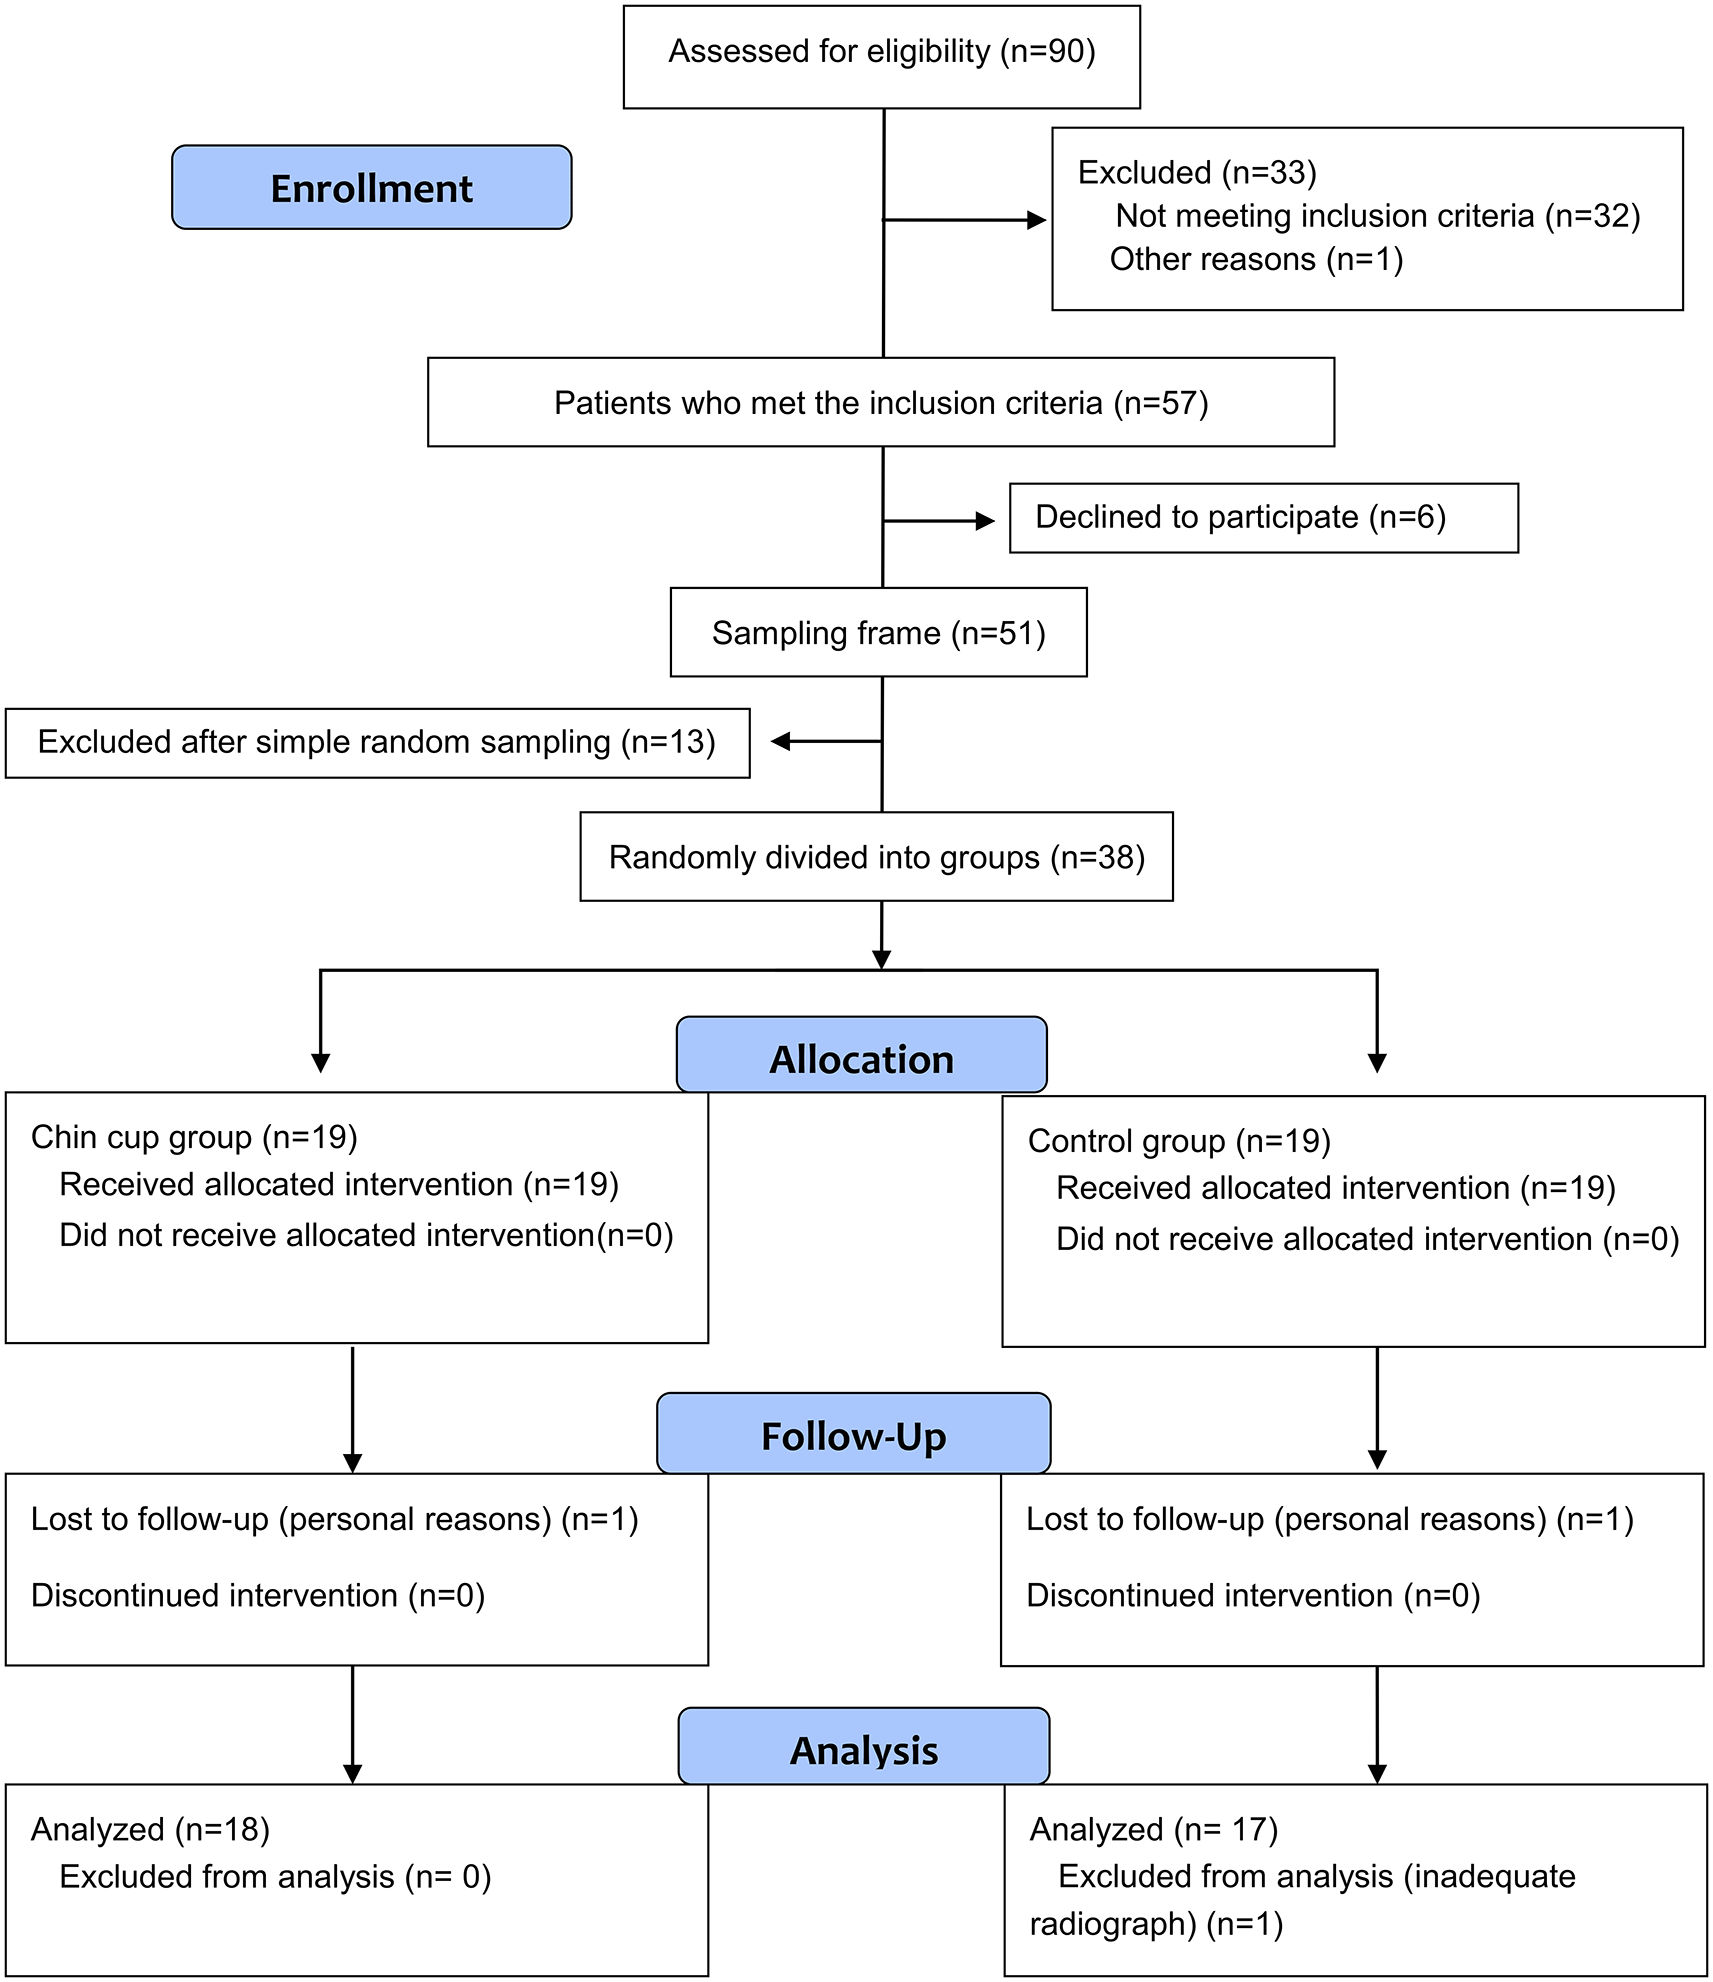
A preliminary screening was performed of schoolchildren during the period from April 2019 to May 2019. Ten public and private schools were randomly selected from the database of all primary schools in Damascus city, Syria. Intra- and extra-oral clinical examination was performed by the principal investigator (A.H.H.) for 1700 children with an average age of 7 years (range: 6-8 years), including 767 female and 933 male children at the medical clinics of the selected schools. Initially, 90 children with class III malocclusion (52 boys, 43 girls) were expected to be suitable for inclusion in the trial. A formal invitation letter was sent to the parents of candidate children asking them to visit the Department of Orthodontics at the University of Damascus for further analysis and to assess the need for early correction of the deformity. All invited parents came for this in-depth assessment. The following inclusion criteria were used: age between 6 and 8, edge-to-edge incisor relationship or anterior crossbite, class III relationships at the permanent first molars or mesial-step relationships at primary second molars, absence of discrepancy between the centric relation and the maximum intercuspation position, short or normal-face pattern, normal or deep overbite, and no temporomandibular joint disorders or craniofacial anomalies. The radiological inclusion criteria were (1) mild to moderate mandibular prognathism (SNB > 80°, and 0 ≤ANB≥4) and (2) normal or horizontal growth pattern (Bjork’s sum ≤396° ±5°). Fifty seven patients met the inclusion criteria. Information sheets were given to parents of eligible patients. The need for two low-dose CT images, and the possibility of postponing treatment if the child fell into the control group were elaborately explained before taking their written informed consents. Six parents refused to participate in this trial. Therefore the resultant sampling frame included 51 patients. Simple random sampling was used to select 38 patients for this trial who were then assigned randomly to the chin cup and the control groups. The CONSORT flow diagram of patients’ recruitment, follow-up, and entry into data analysis is given in Figure 1.
An online randomization service (www.randomizer.org) was used to perform simple randomization with an allocation ratio of 1:1. The allocation sequence was concealed from the researcher (AH) using sequentially numbered, opaque, and sealed envelopes, which were opened after patients completed all baseline assessments. Blinding of either patient or operator was not possible. Blinding was applied for the outcome assessment only. After the mandibular mask was constructed by one of the co-authors (MYH), the row image was resliced by cutting the region of the overjet to blind the other investigator (AH), who completed the extraction of results.
Interventions
Experimental group: Chin-cup group
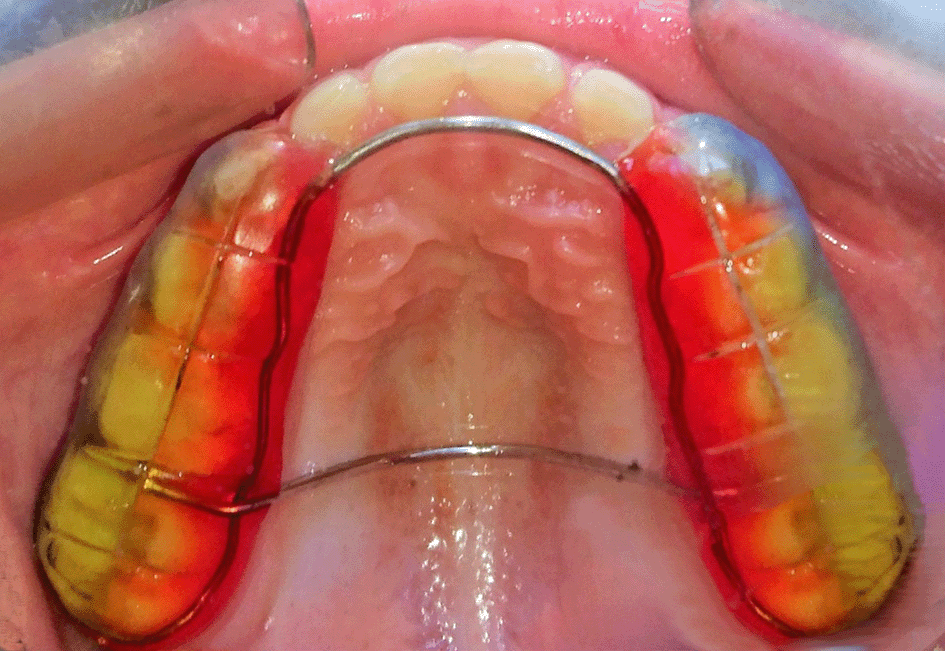
Each patient in the treatment group received a bonded maxillary bite block and an occipital chin cup (Figure 2 shows the bite block). The splint consisted of a 2 mm posterior acrylic cap reinforced by a metal framework. The traction force on the mandible by the chin cup was 400–500 g at each side, in the direction of the condyles.8 Patients were instructed to wear the appliance for 14 hours per day. The true overjet and overbite were measured monthly, subtraction the effects of the bite block on these variables based on the assumption that every 1 mm of the thickness of the posterior bite block increases the overjet by an average of 1.3 mm and decreases the overbite an average of 2 mm.21 After achieving 1 mm overjet and 2 mm overbite, the acrylic splint was removed. Then, the chin cup was used with a light force for approximately 8 hours per day as a retainer. The active treatment was considered complete when the following two conditions were met: a positive overjet of 2 to 4 mm, and an active treatment time of at least 16 months.
After acquiring low-dose CT images, the patients allocated to the control group received no clinical intervention. They were recalled 16 months after registration for collection of the second low-dose CT image records.
Computed tomography acquisition
A multiplanar spiral CT machine (Philips brilliance 64, Philips Medical Systems, Best, the Netherlands) was used to obtain pre- (T1) and post-treatment (T2) CT images. The CT scans were performed at 80 kV and 100 mAs, one pitch, 2.5 mGy (CTDIvol), and a 1.25 mm slice thickness.17 The patients were seated in a supine position with their Frankfort horizontal (FH) plane perpendicular to the floor and their teeth in maximum intercuspation. Once the low-dose CT images were stored in the Digital Imaging and Communications in Medicine (DICOM) format, they were transferred into MIMICS 21.0 software (Materialise, Leuven, Belgium) to create 3D volumetric mandibular models.
Mandible and condyles reconstruction
Each image was resliced to make the head orientation uniform along the midsagittal and Frankfort horizontal planes. The basion, crista galli, and glabella landmarks defined the midsagittal plane. The Frankfort horizontal plane was defined by the right and left orbitale landmarks and the right porion landmark.22
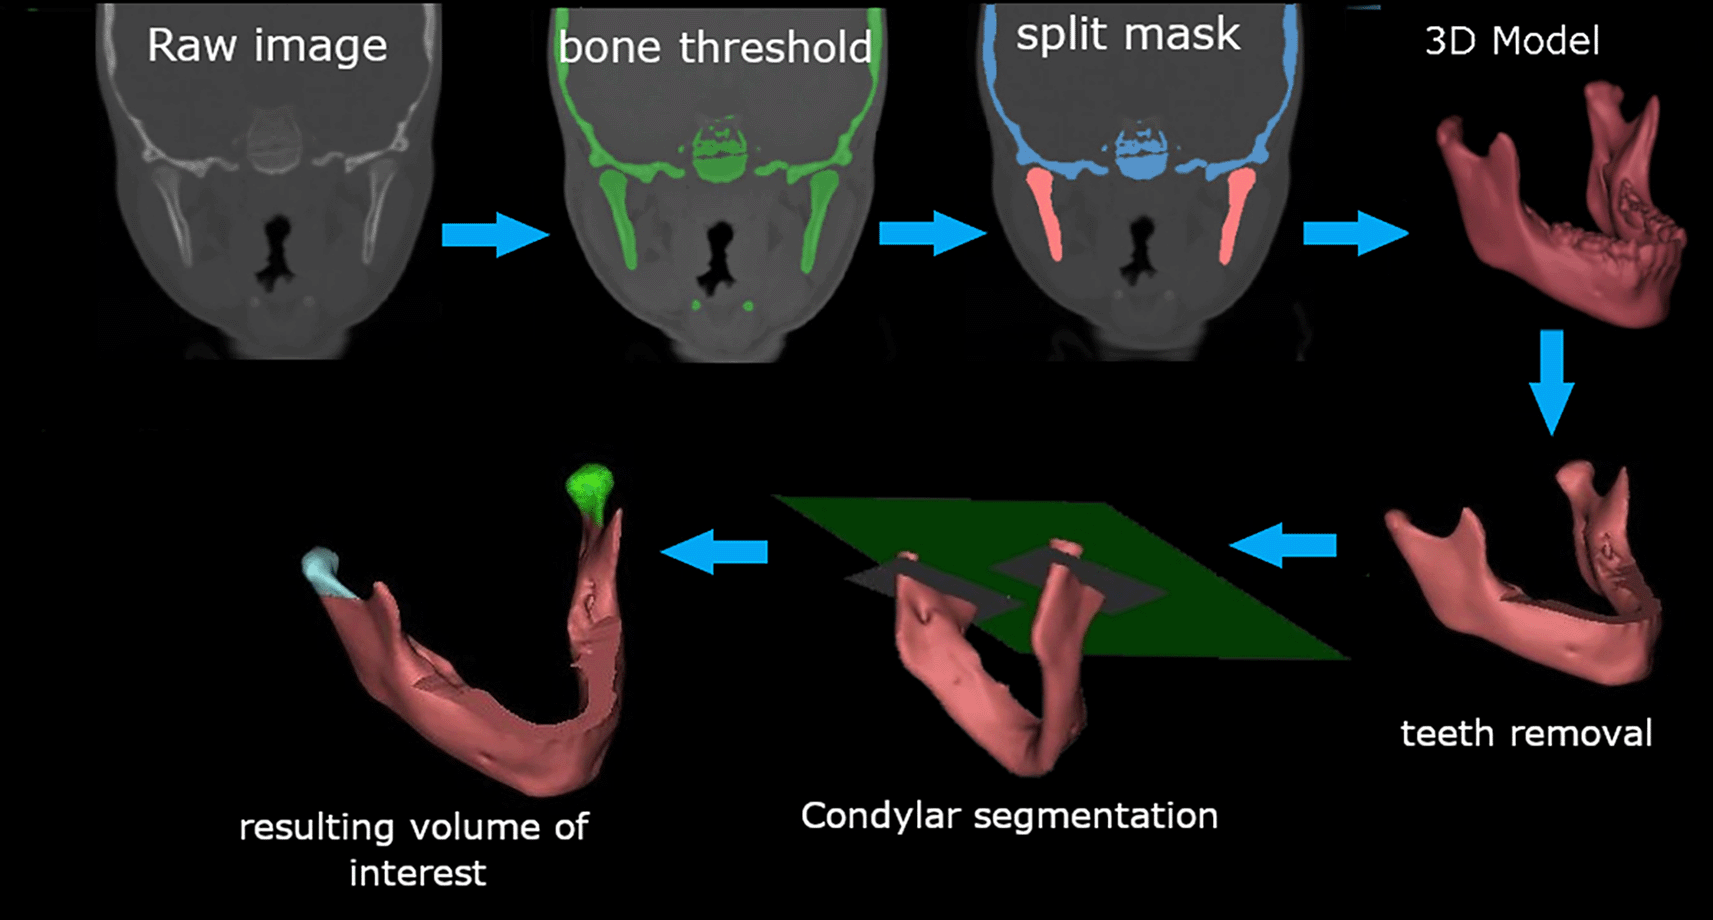
The image processing procedures are shown in Figure 3. Briefly, a bony mask was created using a global threshold value of 226 to 2976 Hounsfield units [HU] for the software algorithm. Semiautomatic segmentation using a split mask tool was utilized to isolate the mandibular bone. The mandible mask was rendered in a high-quality 3D model. Due to the differences in the lower permanent molar eruption, the crowns of the teeth were removed by a plane passing through 1 mm inferior to the alveolar bone and 10 mm distal to the second primary molars. Finally, the condyles were cut at neck level using a plane parallel to the Frankfort horizontal plane at the most inferior part of the sigmoid notch, and the post-treatment cut was parallel to the first cut.23 The condyle and mandible volumes and surface sizes were automatically calculated in mm3 and mm2, respectively.
Linear and angular measurements
A new template was created from the Measure and Analyze tool of Mimics™, which was used to define the anatomical landmarks and planes and produce the desired measurements (Tables 1 and 2).22,24,25 Ikeda and Kawamura suggested that the condylar and glenoid fossa landmarks were made on the corrected sagittal view.26 After identifying the landmarks, the software automatically calculated the distances and the angles. Then, the data was exported in.cvs format.
3D mandibular regional superimposition and comparison analysis
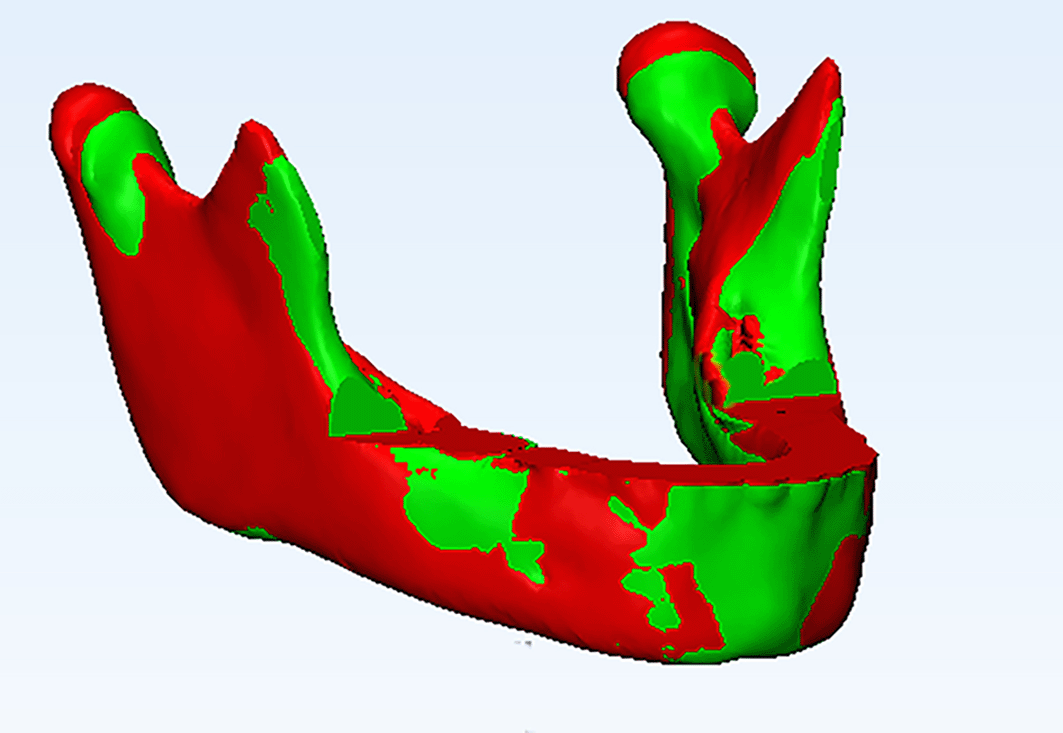
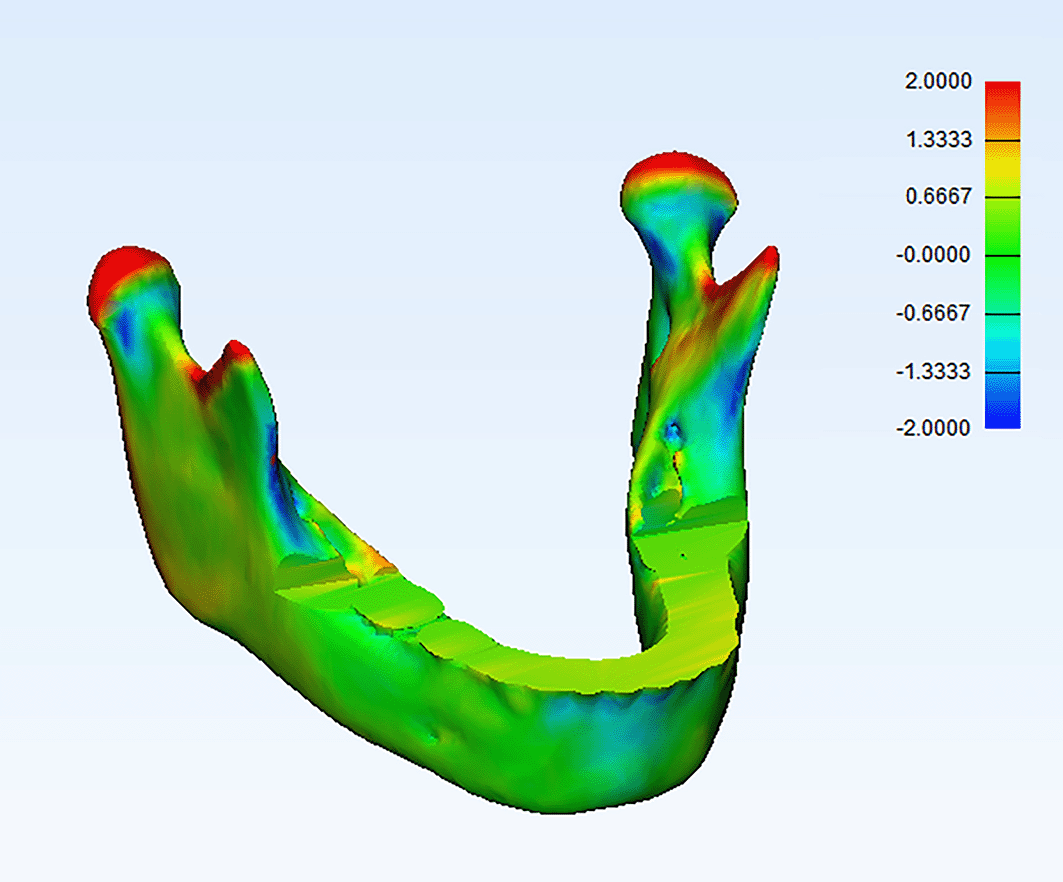
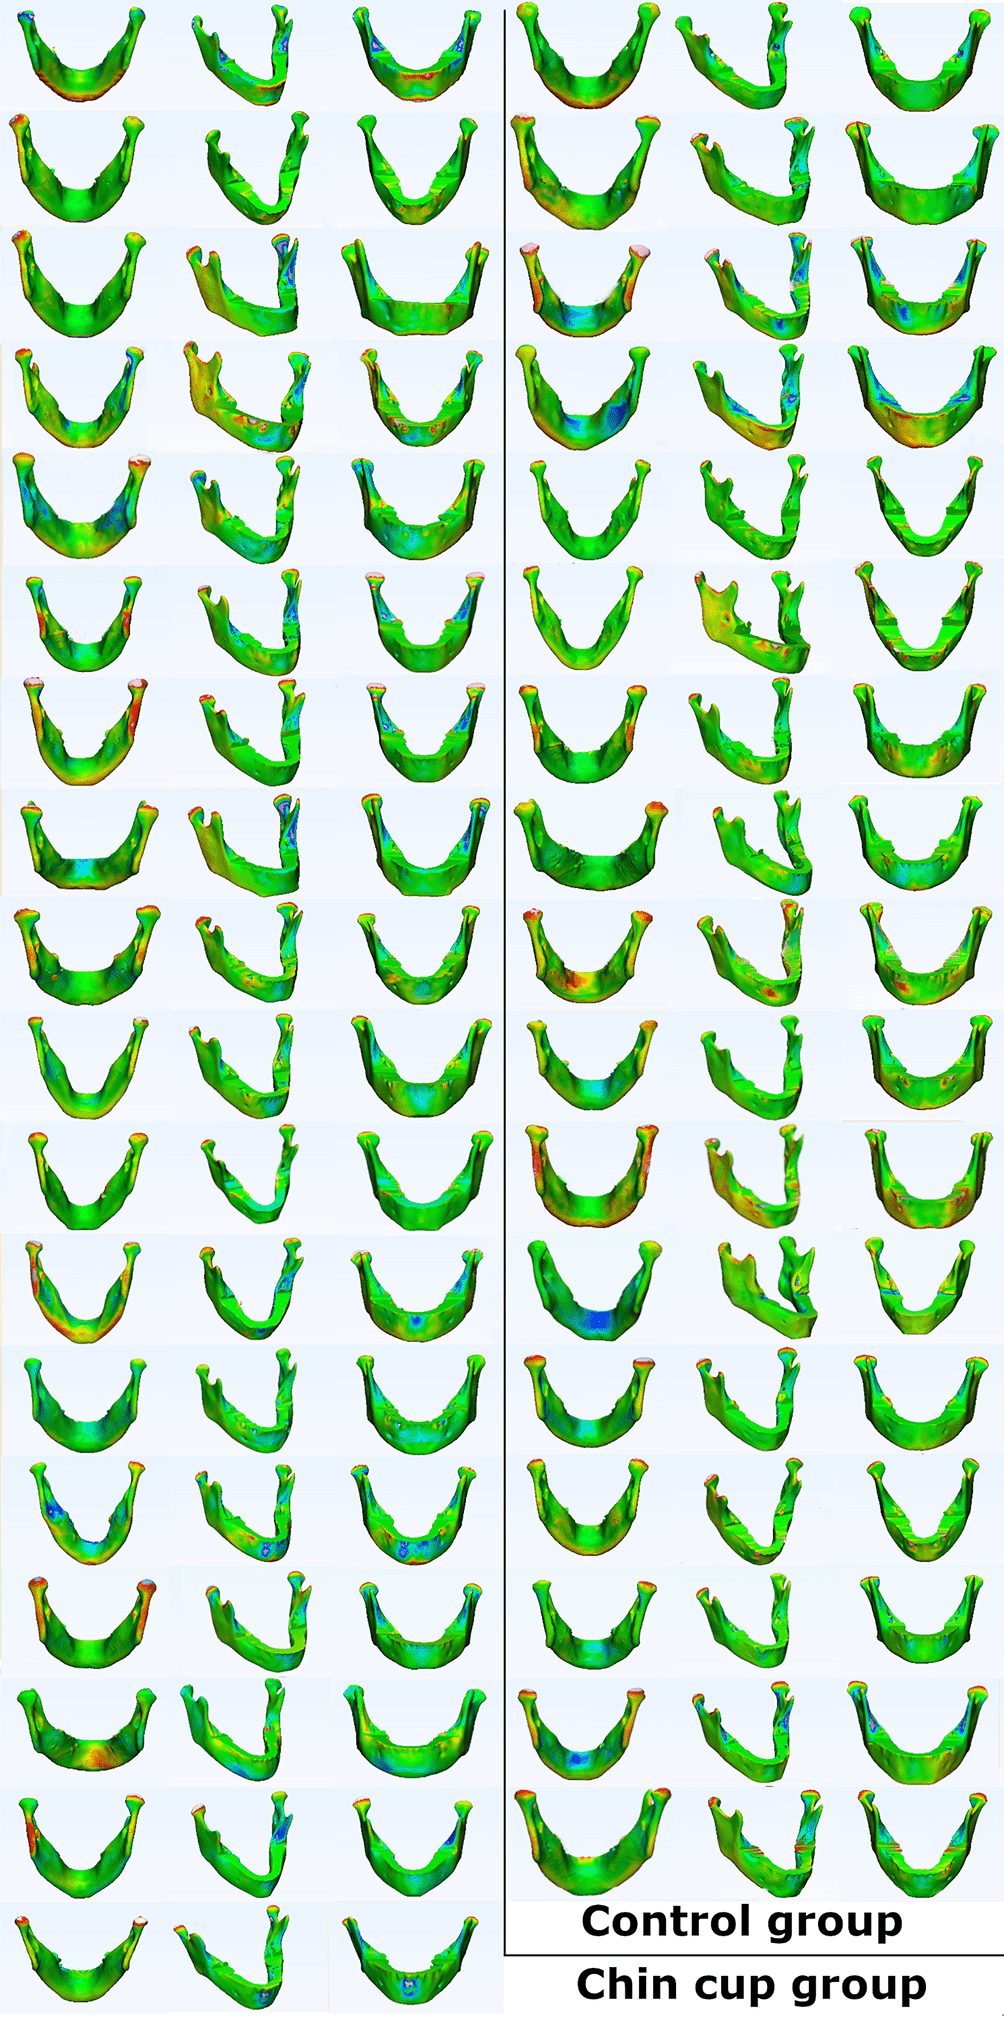
The paired resulting reconstructed mandibular models were exported to 3-Matic software (3-matic13.0, Materialise NV, Leuven, Belgium), and their surfaces were warped using the Warp tool of Mimics™. Initially, The T1 and T2 3D volumes were superimposed manually by approximating similar anatomical regions of the mandible using Interactive Translate and Rotate tools of the software, followed by automatic global registration in 3-Matic software (Figure 4). The superimposition was repeated three times to enhance accuracy and reproducibility. The point-based analysis was performed to assess the changes in 3D mandibular models between T1 and T2, and a color map was produced to assess the mandibular shape changes. The threshold was set at 2 mm: green areas indicated differences within 2 mm (between −2 and 2 mm), red surfaces indicated positive values displacement more than 2 mm, and blue surfaces indicated negative values displacement greater than −2 mm between two 3D models (Figure 5). Quantitative changes were done by reporting the mean, minimum, and maximum values of part analyses on a spreadsheet and used for comparative analyses
Interim analyses and stopping guidelines
No interim analyses were performed during this trial.
Statistical analyses were performed using IBM SPSS Statistics for Windows, version 26.0 (IBM Corp., NY, USA). The average value of each bilateral measurement was calculated to achieve the statistics of this study. Shapiro–Wilk test was used to test the normality of data. Accordingly, non-normally distributed data were analyzed by the Wilcoxon signed-rank test and the Mann–Whitney U test for in- and intergroup comparison, respectively. Additionally, a paired-samples t-test was used to evaluate the changes in the treatment group, and an independent t-test was used for the intergroup comparisons of parameters with a normal distribution. Bonferroni's correction was used to adjust the alpha level due to multiplicity. The adjusted alpha level was 0.0125 for the volumetric and surface area measurements and 0.005 for the cephalometric analysis. To assess the reliability of the measurements, 17 (25%) images were randomly selected and re-measured after a 2-week interval by the same examiner (AH). Intraclass correlation coefficients (ICCs) with the absolute agreement were used to assess intra-rater reliability. Error of the method was analyzed with Dahlberg's formula.27
Intra-examiner reliability was high, and ICCs ranged from 0.83 to 0.999. The error of the method was acceptable for both linear and angular measurements, which were smaller than 0.5 mm and 0.6 degrees, respectively. The measurement error ranged from 18.84 to 54.3 mm3 for the volumetric measurements and 18.81 to 44.58 mm2 for the surface area measurements (Table 3).
| Variable | 95% confidence interval | Mean difference* | Error of the method** | |||
|---|---|---|---|---|---|---|
| ICC | LB | UB | ||||
| Mandibular volume (mm3) | 0.993 | 0.981 | 0.998 | 17.19 | 54.3 | |
| Mandibular area size (mm2) | 0.995 | 0.986 | 0.998 | 17.92 | 44.58 | |
| Condyle volume (mm3) | 0.996 | 0.988 | 0.998 | 3.79 | 18.84 | |
| Condyle area size (mm2) | 0.973 | 0.925 | 0.990 | 3.31 | 18.81 | |
| Go-Gn (mm) | 0.989 | 0.971 | 0.996 | 0.17 | 0.46 | |
| Co-Go (mm) | 0.980 | 0.944 | 0.993 | 0.03 | 0.39 | |
| Co-Gn (mm) | 0.994 | 0.984 | 0.998 | 0.23 | 0.43 | |
| Co-Go-Gn (degree) | 0.950 | 0.982 | 0.993 | 0.22 | 0.6 | |
| CP-FH (mm) | 0.945 | 0.847 | 0.980 | 0.14 | 0.37 | |
| CP-Y (mm) | 0.964 | 0.900 | 0.987 | 0.13 | 0.41 | |
| FP-FH (mm) | 0.941 | 0.838 | 0.979 | 0.18 | 0.27 | |
| FP- Y (mm) | 0.980 | 0.945 | 0.993 | 0.07 | 0.39 | |
| AJS (mm) | 0.967 | 0.908 | 0.988 | 0.05 | 0.11 | |
| SJS (mm) | 0.982 | 0.950 | 0.993 | 0.08 | 0.24 | |
| PJS (mm) | 0.998 | 0.993 | 0.999 | 0.18 | 0.26 | |
| Point-based analysis | Mean part analysis (mm) | 0.932 | 0.823 | 0.975 | 0.01 | 0.09 |
| Minimum part analysis (mm) | 0.998 | 0.996 | 0.999 | -0.13 | 0.44 | |
| Maximum part analysis (mm) | 0.964 | 0.904 | 0.987 | 0.21 | 0.28 | |
** Evaluated using the Dahlberg's formula.27
Basic sample characteristics
The CONSORT flow diagram of patients' recruitment and follow-up is given in Figure 1. In total, 38 patients (21 boys and 17 girls) were enrolled.44 However, three patients were not included in the statistical analysis: one in each group was lost to follow-up, and the third one was extracted from the control group due to the low-quality low-dose CT image. Table 4 shows the basic sample characteristics. The mean treatment and observation periods were 16.67±0.52 months and 16.67±0.52 months, respectively. There were no significant differences in the age distribution and treatment/observation periods between the experimental and the control groups (p=0.675 and p=0.179, respectively).
| Variable | Control group (N=17) | Chin-cup group (N=18) | Mean difference | P-value | 95% Confidence Interval of the Difference | |||
|---|---|---|---|---|---|---|---|---|
| Mean | SD | Mean | SD | Lower | Upper | |||
| Gender (female) | 8 (47.05%) | 8 (44.45%) | 0.877† | - | - | |||
| Age (year) | 6.69 | 0.86 | 6.57 | 0.83 | 0.29 | 0.676‡ | -0.70 | 0.46 |
| Observation/treatment period (month) | 16.67 | 0.52 | 17.02 | 0.92 | 0.12 | 0.179‡ | -0.17 | 0.86 |
The mean mandibular volume increased significantly by 777.24 mm3 and 1,221.62 mm3 in the chin cup and control groups, respectively. Also, the mean condylar volume increased significantly by 94.57 mm3 and 132.54 mm3 in the chin cup and control groups, respectively (Table 5). The linear measurements of the mandible significantly increased in both groups (p<0.05). No statistically significant differences between the chin cup and control groups were observed regarding the volumes, superficial areas, and linear changes of the mandible and condyles (Tables 5 and 6). Although the mean mandibular angle decreased by 1.63° in the treatment group, there was no statistically significant difference between the treatment and the control groups regarding this variable (Table 6).
| Control group (N=17) | Chin-cup group (N=18) | Control group vs Chin-cup group | ||||||||
|---|---|---|---|---|---|---|---|---|---|---|
| Mean | SD | P value† | Mean | SD | P value† | Mean | P-value§ | 95% Confidence Interval of the difference | ||
| Lower bound | Upper bound | |||||||||
| Mandibular volume (mm3) | 1,221.62 | 641.52 | <0.001*‡ | 777.24 | 797.42 | 0.002*‡ | -444.38 | 0.110‖ | -943.94 | 55.18 |
| Mandibular area size (mm2) | 833.84 | 1,051.05 | 0.005* | 722.40 | 1,335.40 | 0.003*‡ | -111.44 | 0.785 | -941.21 | 718.33 |
| Condyle volume (mm3) | 132.54 | 84.79 | <0.001*‡ | 94.57 | 91.76 | 0.001*‡ | -37.97 | 0.184‖ | -98.83 | 22.89 |
| Condyle area size (mm2) | 88.49 | 100.20 | 0.002* | 66.08 | 48.05 | <0.001* | -22.41 | 0.401 | -75.96 | 31.14 |
| Control group (N=17) | Chin-cup group (N=18) | Control group vs Chin-cup group | ||||||||
|---|---|---|---|---|---|---|---|---|---|---|
| Mean | SD | P value† | Mean | SD | P value† | Mean | P-value§ | 95% Confidence Interval of the difference | ||
| Lower bound | Upper bound | |||||||||
| Go-Gn (mm) | 1.64 | 2.00 | 0.004*‡ | 1.18 | 1.54 | 0.005*‡ | -0.46 | 0.452‖ | -1.68 | 0.77 |
| Co-Go (mm) | 1.49 | 1.60 | 0.003‡ | 1.05 | 1.57 | 0.014‡ | -0.44 | 0.483‖ | -1.53 | 0.65 |
| Co-Gn (mm) | 1.77 | 1.38 | <0.001* | 1.53 | 2.15 | 0.008 | -0.24 | 0.702 | -1.49 | 1.01 |
| Co-Go-Gn (degree) | -0.25 | 2.15 | 0.639 | -1.63 | 2.80 | 0.024 | -1.38 | 0.111 | -3.11 | 0.34 |
| CP-FH (mm) | -0.84 | 0.82 | 0.001* | -1.68 | 0.75 | <0.001* | -0.84 | 0.003* | -1.38 | -0.30 |
| CP-Y (mm) | -0.15 | 1.23 | 0.266‡ | -1.29 | 1.03 | 0.001*‡ | -1.14 | 0.003*‖ | -1.92 | -0.36 |
| FP-FH (mm) | 0.04 | 1.21 | 0.904‡ | -0.81 | 0.51 | <0.001* | -0.91 | 0.004*‖ | -1.53 | -0.29 |
| FP-Y (mm) | -0.11 | 0.77 | 0.557‡ | -0.82 | 0.54 | <0.001*‡ | -0.71 | 0.004*‖ | -1.14 | -0.27 |
| AJS (mm) | 0.05 | 0.50 | 0.701 | 0.12 | 0.30 | 0.103 | 0.07 | 0.600 | -0.21 | 0.36 |
| SJS (mm) | 0.10 | 0.54 | 0.309‡ | -0.71 | 0.76 | <0.001*‡ | -0.81 | 0.017‖ | -1.26 | -0.36 |
| PJS (mm) | 0.07 | 0.35 | 0.421 | -0.93 | 0.91 | <0.001* | -1.00 | <0.001* | -1.48 | -0.52 |
There was a significant posterior and superior displacement of the condyles following treatment by a mean of 1.29 mm (p=0.001) and 1.68 mm (p<0.001), respectively. Similar changes were observed in the glenoid fossa, but to a lesser extent by a mean of 0.82 mm posteriorly (p<0.001) and 0.81mm superiorly (p<0.001). The superior joint space (SJS) and posterior joint space (PJS) showed a significant mean decrease of 0.71 mm and 0.93 mm, respectively. However, no statistically significant differences were observed in the relative positions of the condyles, glenoid fossa, and joint spaces in the control group (p>0.05), except for a significantly superior displacement of the condyles (0.84 mm; p=0.001). The changes in the relative sagittal and vertical positions of condyles and glenoid fossa were significantly smaller in the treatment group than in the control group. No statistically significant differences were observed between the treatment and control groups regarding the average mean, maximum, and minimum part analysis of the point-based analysis (p>0.05; Table 7).
| Control group (N=17) | Chin-cup group (N=18) | Control vs. Chin-cup | 95% Confidence Interval of the Difference Control vs. chin-cup | ||||||
|---|---|---|---|---|---|---|---|---|---|
| Mean | SD | Mean | SD | Mean | P-value† | Lower | Upper | ||
| Point-based analysis | Mean part analysis (mm) | 0.20 | 0.31 | 0.07 | 0.34 | 0.13 | 0.143 | -0.09 | 0.36 |
| Minimum part analysis (mm) | -2.26 | 1.08 | -2.97 | 1.38 | -0.71 | 0.076‡ | -1.15 | 1.56 | |
| Maximum part analysis (mm) | 2.59 | 1.61 | 2.20 | 1.36 | -0.39 | 0.463 | -0.63 | 1.41 | |
Harms
No serious harm was observed.
Although the extensive literature on the potential condyle-mandibular adaptation of the chin cup is of interest, the conflicting outcomes urge high-quality studies that apply 3D imaging technology to the study of the TMJ, such as CBCT or CT scan.1,2,12 But, the difficulty achieving condylar segmentation in CBCT images is due to its lesser density compared to the rest of the mandible, as demonstrated previously.28 Therefore, the use of low-dose CT imaging was preferred in this study. In addition, the acceptable radiation dose of this imaging method is 0.51 mSv under the acceptable limit of 1 mSv per year.13,15
Precise volumetric assessment can be affected by several variables, such as voxel size, patient position, and the characteristics of the software used for segmentation.28,29 The used software has been proven by Weissheimer30 as the most accurate software with errors in the volume segmentations less than 2% of the real size.
The influence of sex on the treatment outcomes was not accounted for in this study. Baccetti31 found no sex differences in most dentofacial parameters for Class III patients until the age of 13 years. The mean age of the treatment group was 6.59 (±0.86) years, which has been considered early optimal treatment timing.32 Additionally, the mean age of the control group sample was 6.57 (±0.83) years, which gives the patients the time to be treated ideally after the observation period. The treatment period was 17.02 (±0.92) months. Mitani33 stated that the major treatment effects of the chin cup are observed in the first 2 to 3 years of treatment. Some previous studies suggested variable treatment periods from 1-7 years, but most stopped heavy forces after obtaining a good overjet. On the other hand, treatment effects can be better demonstrated if longer periods of observation were implemented in the current study.
Although the force applied from the chin cup, the volume and the superficial area of the mandible showed a significant increase. These changes could be secondary to simultaneous bone repositioning on most surfaces of the mandible.34 Similarly, the linear mandibular measurements increased significantly in both groups. It was observed that the mean of the increase in the mandibular dimensions was smaller in the treatment group than in the untreated group, but no differences were found between both groups regarding these parameters. Due to several studies on chin cup therapy using 2D measurements based on cephalometric radiographs, only linear measurements of this trial could be compared. The results of this study regarding the changes in the linear mandibular measurements were in agreement with some relevant clinical studies.6–8 On the contrary, Mimura and Deguchi35 reported a similar increase in the mandibular length in the chin cup and control groups; these data suggest that chin cup use does not decrease the overall mandibular growth. As mentioned previously, the differences in the appliance design, the force application, and the evaluation method might cause differences in the results.
The gonial angle showed a closing pattern at the end of treatment. This gonial angle change has also been reported in the literature.7,8,36 Lin et al.37 attributed the reason to the force's direction that tends the mandible's ramus to rotate around the gonial angle.34 Nevertheless, the observed change in the gonial angle in this trial was insignificant in the chin cup group and among the groups. It is more likely to be affected by the individual growth pattern, as the gonial area has some freedom to remodel.8
The condyle's volume and superficial area increased significantly in both groups. It is important to highlight that even though no statistically significant differences were found, the overall changes in the condyles in the treatment group were smaller than in the control group. This change had been previously demonstrated by experimental studies showing a decrease in the condylar growth rate due to the compression force applied by the chin cup.18
Another point that should be considered is the observed extensive standard deviation in the volumetric condylar change. The individual differences in the condyles' size, form, and growth cartilage; thus, growth magnitude should also be individually different. In turn, the chin cup force affects condyles variably in the clinical environment.33
The distinguishing differences between the two groups involved most of the TMJ parts. The condyle was displaced posteriorly and superiorly in the chin cup group and accompanied by a posterior and posterior remodeling of the glenoid fossa. However, it showed lesser superior and posterior displacement than the condyle. The histological differences between the glenoid fossa and the condyles could be the reason for the non-equivalent changes.38 Interestingly, Pancherz et al.39 observed a later remodeling response of the glenoid fossa than that occurring in condyles after the Herbst appliance. The study findings regarding the condyles and glenoid fossa portions were similar to those of Mimura and Deguchi.35 However, neither the amounts of displacement nor the evaluation method was similar. On the contrary, Gökalp and Kurt40 showed no changes in condylar positioning by magnetic resonance imaging after chin cup therapy. The evaluation method, however, might cause differences in the results.
In this context, Lee et al.41 found that the facemask appliance induced similar effects but with a smaller magnitude. Results from Grandori42 could explain the difference, revealing that only 70% of the facemask force was translated to the chin. Surprisingly, De Clerk et al.43 used bone-anchored Class III intermaxillary traction with a force of 250 g/side, but the amounts of displacement of the condyle and glenoid fossa were greater than those observed in this study. These differences might be due to the duration of the applied force and the age of the sample in his study, which was older and closer to puberty than in this study.
The results indicated a decrease in the spaces of the joint, except for the anterior space. This may be attributed to the backward and upward forces applied from the chin cup, with the slow remodeling of the glenoid fossa, as mentioned previously.39 Gökalp and Kurt’s40 study showed no change in the condyle-glenoid fossa relationship. However, the evaluation method and the relatively small sample size make the comparison meaningless. These changes require long-term evaluation to corroborate the TMJ adaptation to these positional changes.
The analysis of the changes in mandibular shape through 3D superimposition showed no differences between the two groups, except some inward changes were noticed in the symphysis region, which is indicated by the blue areas in the color mapping in Figure 6. This type of change has been reported previously and might be induced by the plastic cup of chin cup.8,33 The condyles showed atypical changes. On the contrary, the past 2D cephalometric studies assumed that chin cup treatment could induce a forward bending of the condylar neck.8,35 The individual differences in growth direction and magnitude, and sometimes the asymmetric position of the condyles, could affect condylar reaction either to the chin cup or the growth.33
Quantitative results of the point-based analysis showed positive mean displacement in both groups. The average mean and maximum point part analysis was smaller in the chin cup group than in the control group. Although intergroup comparisons according to the parameters of the point part analysis showed insignificant differences between the two groups, class III malocclusion worsens in untreated subjects over time; thus, early treatment is required.
One of the limitations of the current trial is its short-term evaluation. Secondly, the temporomandibular disk was not studied in this trial. However, this aim needs another imaging method.
Randomized controlled trials (RCTs) provide the highest level of evidence.10 Additionally, three-dimensional quantification gives a true mandibular, condyle, and glenoid fossa changes after orthodontic treatment by the chin cup.43 Moreover, significant changes occur in the craniofacial region during the mixed dentition that can be utilized for orthodontic therapy.32 Our study designed as RCT with the help of the three-dimensional quantification and patients were in the early mixed dentation, as a result, the current research findings revealing the effects of the chincup are generalizable. In this randomized controlled trial, the chin cup treatment failed to control mandibular growth, resulting only in orientation to condylar positions and compression of joint spaces.
| Views | Downloads | |
|---|---|---|
| F1000Research | - | - |
|
PubMed Central
Data from PMC are received and updated monthly.
|
- | - |
Provide sufficient details of any financial or non-financial competing interests to enable users to assess whether your comments might lead a reasonable person to question your impartiality. Consider the following examples, but note that this is not an exhaustive list:
Sign up for content alerts and receive a weekly or monthly email with all newly published articles
Already registered? Sign in
The email address should be the one you originally registered with F1000.
You registered with F1000 via Google, so we cannot reset your password.
To sign in, please click here.
If you still need help with your Google account password, please click here.
You registered with F1000 via Facebook, so we cannot reset your password.
To sign in, please click here.
If you still need help with your Facebook account password, please click here.
If your email address is registered with us, we will email you instructions to reset your password.
If you think you should have received this email but it has not arrived, please check your spam filters and/or contact for further assistance.
Comments on this article Comments (0)