Keywords
Sensorial characteristic, technological tools, electronic nose, electronic tongue, artificial vision, texture analyzer, acoustic analysis, food sector
This article is included in the Agriculture, Food and Nutrition gateway.
Sensorial characteristic, technological tools, electronic nose, electronic tongue, artificial vision, texture analyzer, acoustic analysis, food sector
The world of the food industry search to ensure satisfactory multisensory experiences for consumers through the consolidation of quality standards for food products (Blissett & Fogel, 2013; Tuorila & Hartmann, 2020). The first approach to each food matrix allows the consumer to identify attributes related to size, shape, color, and brightness. A second approach allows more direct interactions related to the perception of smell, aroma, taste, temperature, and texture of the product (Fine & Riera, 2019; Isogai & Wise, 2016; Moding et al., 2020; Nederkoorn et al., 2018). Recognizing these sensory characteristics determines the acceptance or rejection of the food (Costell et al., 2009; Torres Gonzalez et al., 2015; Wadhera & Capaldi-Phillips, 2014). One of the disciplines that study the sensory characteristics of food is sensory analysis. This term became a field of study in the 17th century when Jean Anthelme Brillat-Savarin, in 1825, wrote his first book entitled Philosophy of Taste, in which he established the basis for the analysis of food and how it is perceived (Chong, 2012). The constant evolution of the concept and applicability of sensory analysis has consolidated its study using trained panelists or instrumental methods. Although the analyses carried out by these panelists constitute an essential source of information for the acceptance or rejection of a food product, this can be subjective due to biological, social, and other external factors surrounding the subject (Buratti et al., 2018; Loutfi et al., 2015; Tan & Xu, 2020).
One of the main limitations when implementing sensory tests is the number of required panelists, ranging from 7 to 100 depending on the test type (Lawless & Heymann, 2010; O’Mahony, 2017). This implies an investment of human and economic resources, raw materials, and/or time. This limitation has motivated researchers to generate technologies to identify and quantify some sensory characteristics of foods with greater precision (Akimoto et al., 2017; Kusumi et al., 2020; Pascual et al., 2018).
Such developments search to mimic the functioning of the five senses, such is the case of electronic noses (e-noses) and tongues (e-tongues), which upon contact with food, generate an electronic response from a chemical interaction, which is interpreted by a digital information processing system (Banerjee et al., 2019; Bonah et al., 2020). Similarly, image analysis through devices such as cameras seek to simulate the sense of eyesight (Ansari et al., 2021; Barbon et al., 2017; Kakani et al., 2020; Khojastehnazhand & Ramezani, 2020); concerning touch and hearing, some reports show various technological tools that measure force and sound, seeking to imitate the behavior of these senses (Akimoto et al., 2019; Kato et al., 2017; Kusumi et al., 2020).
Each of the technological tools mentioned above contributes a description of the primary sensory characteristics of the food matrix to be evaluated. This article consolidates information on some technological tools reported in the literature for sensory analysis in various food matrices.
Odor is one of the most representative attributes of food. This can be expressed as one of the qualities of Volatile Organic Compounds (VOCs), so unique and distinctive that they are considered fingerprints (Bonah et al., 2020; Tan & Xu, 2020).
Generally, the sensory analysis method to identify such components is performed by panelists who rate and classify on different scales the odor perceived in the sample (Barbieri et al., 2021; Giungato et al., 2018; Niu et al., 2019; Świąder & Marczewska, 2021). On the other hand, different methods have been developed for the identification of VOCs, which are characterized by high accuracy and reliability, such as: Gas Chromatography-Olfactometry (GC-O), Gas Chromatography-Mass Spectrometry (GC-MS), Headspace Solid Phase Microextraction (HS-SPME), as some of the most used methods (Attchelouwa et al., 2020; Chen et al., 2021). However, these methods usually require sample conditioning, which involves investing many different types of resources (Shi et al., 2018). Considering the above, devices such as the e-nose have been developed, consisting of an array of electrochemical sensors articulated with a pattern recognition system that identifies, groups, and discriminates the VOCs (Gliszczyńska-Świgło & Chmielewski, 2017; Loutfi et al., 2015). This has become an alternative to generating fast and reliable results in the food industry (Barbosa-Pereira et al., 2019; Conti et al., 2021; Wasilewski et al., 2019).
For the articulation of three fundamental systems characterizes E-nose: sensing, electrical conditioning, and pattern recognition; see Figure 1.
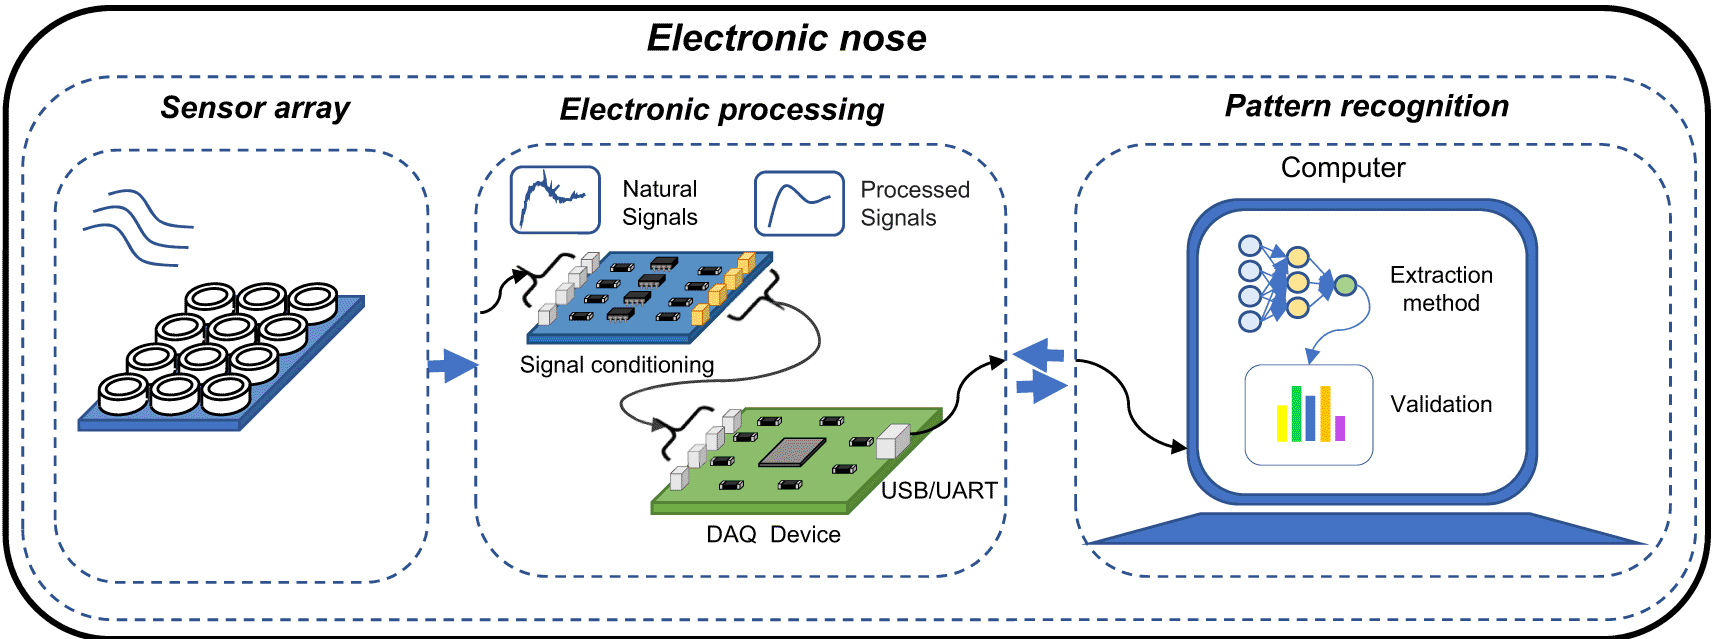
The sensing system is composed of a matrix of sensors that can be of different types such as: conductivity, polymers, intrinsic conductive polymers, metal oxide, surface acoustic waves, and quartz crystal balance, which allow the detection of VOCs through absorption, adsorption, or chemical reaction methods. Depending on the characteristics of the food matrix to be evaluated, the sensors that make up the e-nose must be carefully considered, as they will react more efficiently to certain particles (Tan & Xu, 2020; Wilson & Baietto, 2009). This detection produces an electronic signal, from which it is possible to characterize the VOCs.
The electrical conditioning system is responsible for matching the signal emitted by each of the sensors. Signal matching consists of amplification and filtering to identify the analyzed food matrix sample (Shi et al., 2018).
Finally, the pattern recognition system receives the already conditioned electrical signal and is in charge of processing it. For this procedure, extraction methods are used, which aim to obtain reliable and robust information from the electrical signal, guaranteeing greater measurement efficiency. Some extraction methods are: Principal Component Analysis (PCA), Support Vector Machines (SVM), Artificial Neural Networks (ANN), Linear Discrimination Analysis (LDA), Discriminant Function Analysis (DFA), decision trees, and other machine learning classifiers (Tan & Xu, 2020; Yan et al., 2015).
E-nose is used in several food matrices to identify their authenticity due to the growing number of counterfeit products that represent a significant risk to the health of consumers (Gliszczyńska-Świgło & Chmielewski, 2017). Additionally, this device also allows users to identify and group according to their specifications some food matrices such as: alcoholic beverages, dairy products, and juices (Sanaeifar et al., 2017); the ripeness of fruits and vegetables; quality of meats; shelf life of grains, among others (Du et al., 2019; Tan & Xu, 2020; Wang et al., 2019).
For example, the e-nose of the Alpha MOS FOX family has been used to identify possible adulteration of olive oil with hazelnut and sunflower oils (Mildner-Szkudlarz & Jeleń, 2008). Also, in the analysis of flaxseed oil detecting adulteration with other similar components (Wei et al., 2015).
In research conducted by Nurjuliana (2011), the volatile compounds in pork, beef, lamb, and chicken sausages were analyzed. The samples taken from each of the sausages were analyzed by mass spectrometry, gas chromatography, and zNose™ electronic nose, which allowed the identification of the type of meat from which the sausages were made. Although the results of the tests carried out by all the instruments were highly efficient, the speed and low cost of using the zNose™ e-nose were highlighted.
Additionally, in the research by Ghasemi-Varnamkhasti et al. (2019), an e-nose was custom designed using five types of MOS sensors to classify two pieces of cheese: Roquefort and Camembert. This classification was carried out by taking into account the milk (sheep, goat, or cow) with which it was made, the degree of pasteurization, and the maturity of these cheeses.
Other reports show the use of e-noses to analyze fish. Güney and Atasoy (2015), used a low-cost e-nose developed at Karadeniz University, composed of 8 metal oxide gas sensors, to classify three fish species (Horse mackerel (Trachurus murphyi), Anchovy (Engraulidae) and Whiting (Merlangius merlangus). In addition, Zhang et al. (2012), analyzed VOCs during the storage and freezing process of sawfish (Scomberomorus niphonius), finding a linear relationship between a volatile nitrogen base with triethylamine. A separate investigation reports the use of the commercial e-nose Alpha MOS FOX 3000, composed of 18 MOS-type sensors, to establish the sensory profile of the active aromatic compounds of cumin (Cuminum cyminum L.) (Ravi et al., 2013).
Table 1 shows some relevant studies using e-nose in the food, specifying: product, purpose of the analysis, e-nose model, type of sensor, extraction method, and main result obtained.
| Product | Purpose of the analysis | Electronic nose model and combinations | Sensor type | Extraction method used | Results | Reference |
|---|---|---|---|---|---|---|
| Cheese | Analysis of cheese ripening with raw and pasteurized milk | Custom Design | Six piezoelectric quartz crystals | PCA and PLS-DA | Discrimination of cheeses of each milk type | (Valente et al., 2018) |
| Comparison of aroma intensity to sensory measurement | POLFA | MOS | N/A | Demonstrated a linear correlation between the two factors (Pearson's R = 0.983) | (Fujioka, 2021) | |
| Origin and authenticity of Oscypek cheese with Protected Designation of Origin (PDO) | SPME-MS | MS | PCA, LDA, SIMCA, SVM | Classification between 90% and 97% according to the extraction method | (Majcher et al., 2015) | |
| Argan oil | Identification of adulteration with sunflower oil | MOS electronic gas nose | 5 MOS sensors | PCA, DFA, SVM | 85% identification of original oil and 87% identification of adulterated oil | (Bougrini et al., 2014) |
| Flaxseed oil | Oils processed differently for counterfeit detection | Alpha MOS FOX 3000 | 18 MOS sensors | PCA | 87% success rate in counterfeit detection | (Wei et al., 2015) |
| Pork | Identification of adulteration of minced pork with spoiled pork | PEN 2 | 10 MOS sensors | CDA, BDA, PLS, MLR, and BPNN | The identification success rate of 97% | (Tian et al., 2013) |
| Ham | Differentiation of PDO marked hams | PEN 2 | 10 MOS sensors | PCA | Differentiation between ham types between 80% and 87% | (Laureati et al., 2014) |
| Honey | Sugar beet and sugar cane adulteration identification | Cyranose320 | 32 sensors of different types of polymeric matrix, mixed with carbon black | ANN | Identification of samples with a success rate of 89.5% | (Subari et al., 2014) |
| Confirmation of botanical origin | Alpha MOS Fox 4000 | 18 MOS sensors | PCA, DFA, LS-SVM, PLS | The success rate is between 81% and 90%, depending on the extraction method | (Huang et al., 2015) | |
| Confirmation of botanical origin and identification of adulteration with rice and corn syrups | Flash GC | -- | PCA, SVM, PLS | Difference between samples with a 71% success rate and a 65% success rate in identification | (Gan et al., 2016) | |
| Cherry tomato juice | Identification of adulteration with ripened tomato juice | PEN 2 | 10 MOS sensors | PCA, CA | Identification with a 76% success rate | (Hong et al., 2014) |
| Spirits | Confirmation of botanical origin (rye, triticale, wheat, distilled agricultural corn) | Flash GC | -- | PCA, DFA, SIMCA, SQC | The success rate is between 71.9% and 82.9% depending on the extraction method | (Wiśniewska et al., 2016) |
| Liquor | Identification of authenticity of traditional Polish beer Nalewka | Flash GC | -- | PCA, DFA, SIMCA, SQC | Identification with a success rate between 22% and 89.5% depending on the sample and extraction method | (Śliwińska et al., 2016) |
| Peach | Impairment detection | Fox 4000 | 18 MOS sensors | PLSR, LS-SVM, MFRG | A prognostic model of fruit decay was obtained with a response rate of 82.26% | (Huang et al., 2017) |
| Bell pepper | Freshness evaluation | iNose (Ruifen Trading Co) | 14 MOS sensors | HCA, PCA, PLS | Differentiation in the days after harvest was obtained. Obtaining a statistical model of (R2 = 0.9783, RMSE = 0.3317) | (H. Z. Chen et al., 2018) |
| Cocoa | Fermentation degree detection | Custom Design | 6 MOS sensors | ANN | 9.4% misclassification rate | (Tan et al., 2019) |
| Rice | Detection of infection in rice | PEN2 | 10 MOS sensors | PCA and PLSR | Prediction result of Rp2 = 0.864 and RMSEP = 0.235 | (Gu et al., 2020) |
| Dragon fruit, Snow pear, Kiwi fruit, and Fuji apple | Determination of freshness and degradation | Custom Design | 8 MOM sensors | PCA | Discrimination of four levels of fruit condition between 91.12% and 93.69% in the PCA. | (Ding et al., 2018) |
The human tongue can identify five basic tastes: sour, salty, sweet, bitter, and umami (Beauchamp, 2019). Usually, the evaluation and classification of the basic flavors of a product are done through trained panelists and sometimes consumers (Jiang et al., 2018). However, these measurements can be subjective, which can be reduced by using technological tools such as the e-tongue, thus ensuring repeatability and reproducibility of the results (Schlossareck & Ross, 2019). Ross (2021) showed that combining different electrodes makes it possible to identify different flavors, such as fatty, metallic, and others. Different investigations have shown that by using the e-tongue, it is possible to determine the quality, adulteration, classification, or origin of food (de Morais et al., 2019; Elamine et al., 2019; Jiang et al., 2018; Sobrino-Gregorio et al., 2018). The previously mentioned characteristics have allowed the e-tongue to become a fast, economical and impartial detection alternative (Titova & Nachev, 2018); this is because it allows the characterization of the flavor of the food matrix (di Rosa et al., 2017). Additionally, the e-tongue has a matrix of electrodes that, according to their combination and characteristics, produce potentiometric, voltammetric, and impedimetric signals (Jiang et al., 2018).
E-tongue is characterized for articulating three fundamental systems: sensing, electrical conditioning, and pattern recognition (di Rosa et al., 2017) (see Figure 2).
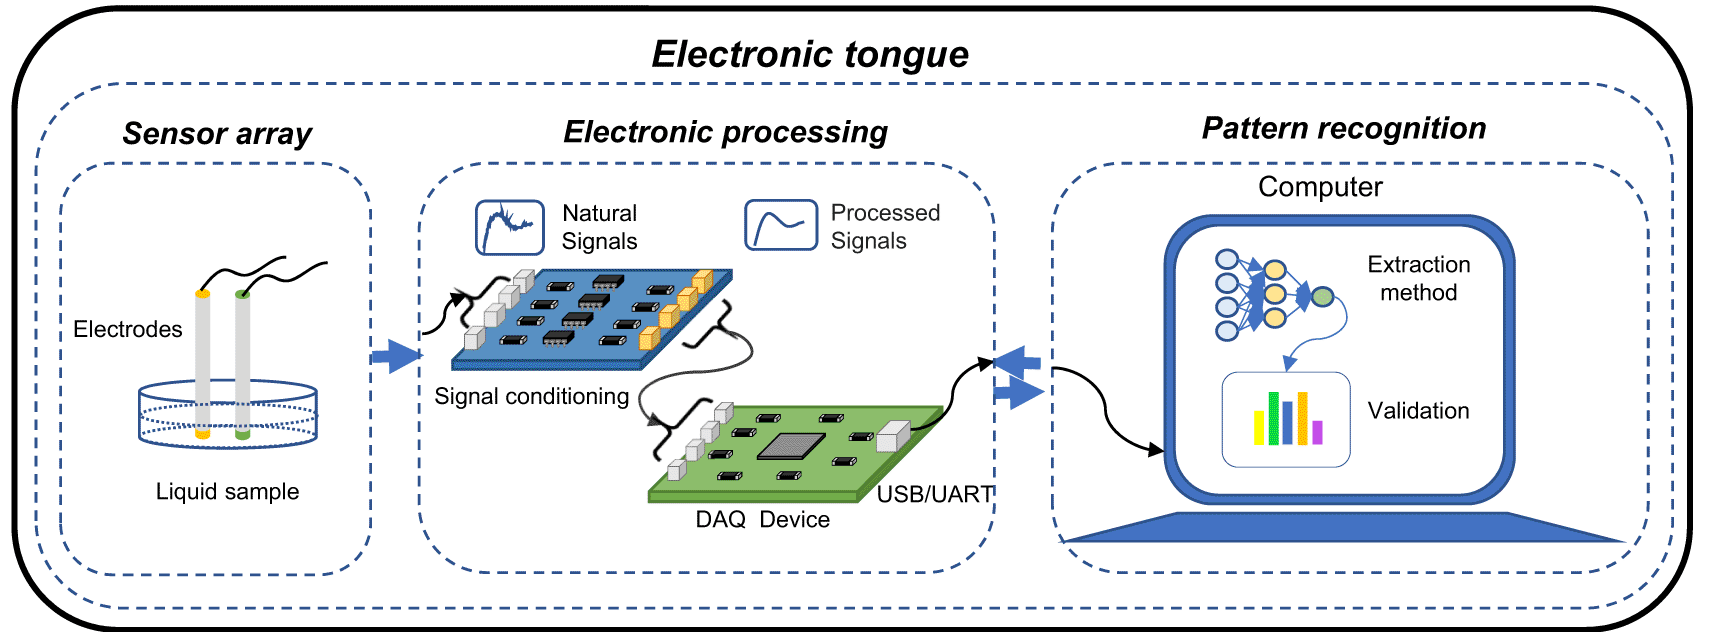
E-tongue sensing system is composed of two or more electrodes, each electrode has a membrane that upon contact with the analyte generates a chemical interaction causing a reversible change in the electronic properties, which allows the characterization of the food matrix (Tan & Xu, 2020).
Potentiometric-type electrodes measure the voltage differences between the working and the reference electrodes (Wasilewski et al., 2019). The voltage change in the measurement given by the working electrode will have a proportional relationship to the concentration of the analyte (Jiang et al., 2018; W. Wang & Liu, 2019). Some of the membranes used in potentiometric electrodes can be multi-channel lipid with a reference electrode made of a silver/silver carbon alloy (Ag/AgC), chalcogenide glass with a polyvinyl chloride (PVC) film, liquid or polymeric, which allow the detection of the voltage generated when in contact with the food matrix (Tan & Xu, 2020).
Regarding voltammetric electrodes, these are used in conjunction with a minimum electrode configuration in which one must have a working, a reference, and an auxiliary electrode (Jiang et al., 2018; Wasilewski et al., 2019). Generally, these working electrodes are constituted by a bare or modified metal, which contemplates any of the following compounds: copper (Cu), nickel (Ni), palladium (Pd), silver (Ag), tin (Sn), titanium (Ti), zirconium (Zr), gold (Au), platinum (Pt) and radium (Ra) (Jiang et al., 2018). Its operation encourages the transfer of electrons through the food matrix, measuring the resulting polarization current, which has a direct relationship with the concentration of certain components present in the food (Wei et al., 2018).
Another group of electrodes is those of impedimetric type, characterized by being coated with different polymeric materials, which, upon receiving an alternating signal of variable frequency and constant amplitude, produce an alteration in the impedance value (Garcia-Hernandez et al., 2018). This impedance change allows for characterizing, detecting, and discriminating different components such as: sucrose (C12 H22 O11), sodium chloride (NaCl), potassium chloride (KCl), and hydrochloric acid (HCl) (Podrazka et al., 2017). According to the literature, the most commonly used electrodes on the market are potentiometric and voltammetric electrodes due to advanced development (Wang & Liu, 2019).
Tan and Xu (2020) indicated that electrodes in the development phase incorporate biomaterials such as enzymes, whole cells, tissues, receptors, or antibodies, whose chemical interaction with the food generates a transfer of electrons, ions, or molecules. This transfer modifies the characteristics of the electronic signal, like those produced by potentiometric and voltammetric electrodes. It is expected that these biosensors will be a technology that will contribute to improving results in the future.
The electrical conditioning and pattern recognition systems of the e-tongue present particularities closely like those of the e-nose. The only substantial difference between these two technological tools is presented in the sensing system in terms of the characteristics specific to the internal and structural design of the sensors (Tan & Xu, 2020; Wasilewski et al., 2019).
The use of the e-tongue in the food industry encompasses a wide range of applications, including discrimination by type and place of origin, verification of authenticity, adulteration or counterfeiting, and quantification of food matrix components (Titova & Nachev, 2018; Wasilewski et al., 2019).
A clear example of the use of such technology for classifying products by type and place of origin is evidenced in the research developed by Souayah (2017), where a potentiometric e-tongue was used to classify 60 samples of olive oil. Moreover, Elamine et al. (2019) discriminated 31 samples of honey from Portugal by botanical origin using an impedimetric e-tongue.
Cetó and Pérez (2020) used an inset voltammetric e-tongue from Bas Inc. configured with three electrodes of gold (Au), platinum (Pt), and glassy carbon (C), to carry out the process of identification of authenticity and classification of 44 samples of six different varieties of vinegar. The measurement results of the equipment were subjected to the PCA and LDA extraction methods, which allowed the discriminating and categorizing of the total of the analyzed samples with 100% accuracy. This research allowed it to generate records of the electrochemical fingerprints of the vinegar.
Furthermore, a voltammetric-type e-tongue was custom-developed to identify adulteration in roasted ground coffee (de Morais et al., 2019). This research analyzed 90 cups of coffee (60 unadulterated and 30 adulterated). LDA, SPA, and PLS-DA identification methods were applied to the measurements obtained; as a result, the adulterated beverages were identified and the purity percentage in each sample was quantified.
Another example is the investigation of the evolution process of taste compounds in the chicken stew at different cooking times, which focused on detecting nucleotides and free amino acids using a commercial e-tongue (TS-5000Z, Insent). As a result, the proportion of the components detected in each cooking stage and the identification of inosine monophosphate (IMP), glutamic acid (Glu), lysine (Lys), and sodium chloride (NaCl) as the main compounds highlighted the final flavor attributes of the chicken were evidenced (Liu et al., 2017). Table 2 shows some relevant studies in which e-tongues in different food matrices.
| Food | Purpose of the analysis | Type of electrode used in the electronic tongue | Extraction method | Results | Reference |
|---|---|---|---|---|---|
| Milk | Brand Classification | Voltammetric | PCA and PLS | 80.5% success rate | (Yu et al., 2015) |
| Quantitative analysis of urea in adulterated milk | Voltametric | PCA and PLS | Identification and separation of different components | (Li et al., 2015) | |
| Ham | Measurement of curing processes with different amounts of salt | Potentiometric | RNA | Differentiation with a 100% success rate | (Gil-Sánchez et al., 2015) |
| Comparison of umami flavor peptides in water-soluble extractions | Voltammetric | PCA | Comparison with 65% success rate | (Dang et al., 2015) | |
| Meat | Quality modeling and classification by breed | Potentiometric | PCA and LDA | 100% identification and 97.5% prediction for each breed | (Surányi et al., 2021) |
| Ammonia and putrefaction detection | Voltammetric | PCA and PLS-DA | Classification of samples with ammonia at 100% | (Apetrei & Apetrei, 2016) | |
| Pork | Determination of the role of salt in the flavor of the meat | Lipid Membrane | PCA | Identification of the highest flavor indexes in dry-cured meat with a salt content of 3% and 5% | (Tian et al., 2020) |
| Vegetable oil | Determination of three quality parameters | Potentiometric | PCA and PLS | Quantification of the three parameters with a relative error of 20%. | (Semenov et al., 2019) |
| Vegetable milk | Emulation of sensory analysis for product discrimination | Voltammetric | PCA and PLS | Product differentiation with a variance of 77% | (Pascual et al., 2018) |
| Red Wine | Evaluation of phenolic contents for 14 varieties of liquor | Voltammetric | PCA and PLS | Validation with a variance of 85.8% | (Garcia-Hernandez et al., 2020) |
| Honey | Validation of adulteration | Voltammetric | PLS-LDA, LSD and MLR | Classification of samples between original and adulterated with an accuracy of 97.5% | (Oroian et al., 2018) |
| Tea | Classification of different species | Voltammetric | LDA, SPA, GA and SW | 100% success rate classification with LDA/SPA method | (Rodrigues et al., 2018) |
| Measurement of phenolic compounds during the storage process for quality assurance | Potentiometric | PLS | Classification of the different types of tea with a coefficient of determination of Rp2 between 0.926 and 0.956 | (Ruengdech et al., 2019) | |
| Blueberry juice | Characterization of four types of cranberry juice for flavor profiling | Potentiometric | ANOVA and PLS | Characterization of flavor profile components given a cross-correlation with a variance of 83.14% | (Yu et al., 2018) |
| Honey | Discrimination of botanical origin | Impedimetric | PCA | Discrimination of each characteristic of honey types | (Elamine et al., 2019) |
| Red Meat and Poultry | Determination of optimal dilution level of meat extract | Potentiometric | LDA | Discrimination with an accuracy between 68.77% and 78.13%, depending on the dilution percentage | (Zaukuu et al., 2021) |
Computer Vision System (CVS) also known as Artificial Vision System (AVS), is an image analysis tool used to obtain information about objects through them (Bhargava & Bansal, 2018; Wu & Sun, 2013). This is due to its ability to characterize: shape, size, color, and other particularities of the object, which can be static or moving (Zhu et al., 2021). Therefore, the CVS can be used in both continuous and static production lines, achieving a real-time analysis, as it allows fast, accurate, and non-invasive captures, with reliable and reproducible results (Barbon et al., 2017; Patrício & Rieder, 2018). Due to its flexibility and technological development, a CVS can store information about an object to perform further analysis using new images (Taheri-Garavand et al., 2019; Wu & Sun, 2013). Thus, the CVS becomes an alternative to avoid the possible errors of quality inspection of the objects which the human eye can incur (Patrício & Rieder, 2018).
A CVS is composed of three fundamental stages: illumination, image detection, and pattern recognition (Kakani et al., 2020), see Figure 3. The first stage plays an important role in image acquisition, since light has a direct impact on the clarity and color of the images and its improper use can generate shadows and unwanted reflections, cataloged as noise in the images (Vithu & Moses, 2016). Therefore, depending on the application of the system, an appropriate selection of the light-generating elements must be made, considering characteristics such as wavelength, intensity, and direction. These light-generating elements can be light bulbs (incandescent, fluorescent, halogen), lasers, light emitting diodes (LEDs), X-ray tubes, and infrared lamps (Naik & Patel, 2017; Sun et al., 2019; Zhu et al., 2021). These ensure clarity, repeatability, and reliability of the image (Barbon et al., 2017).
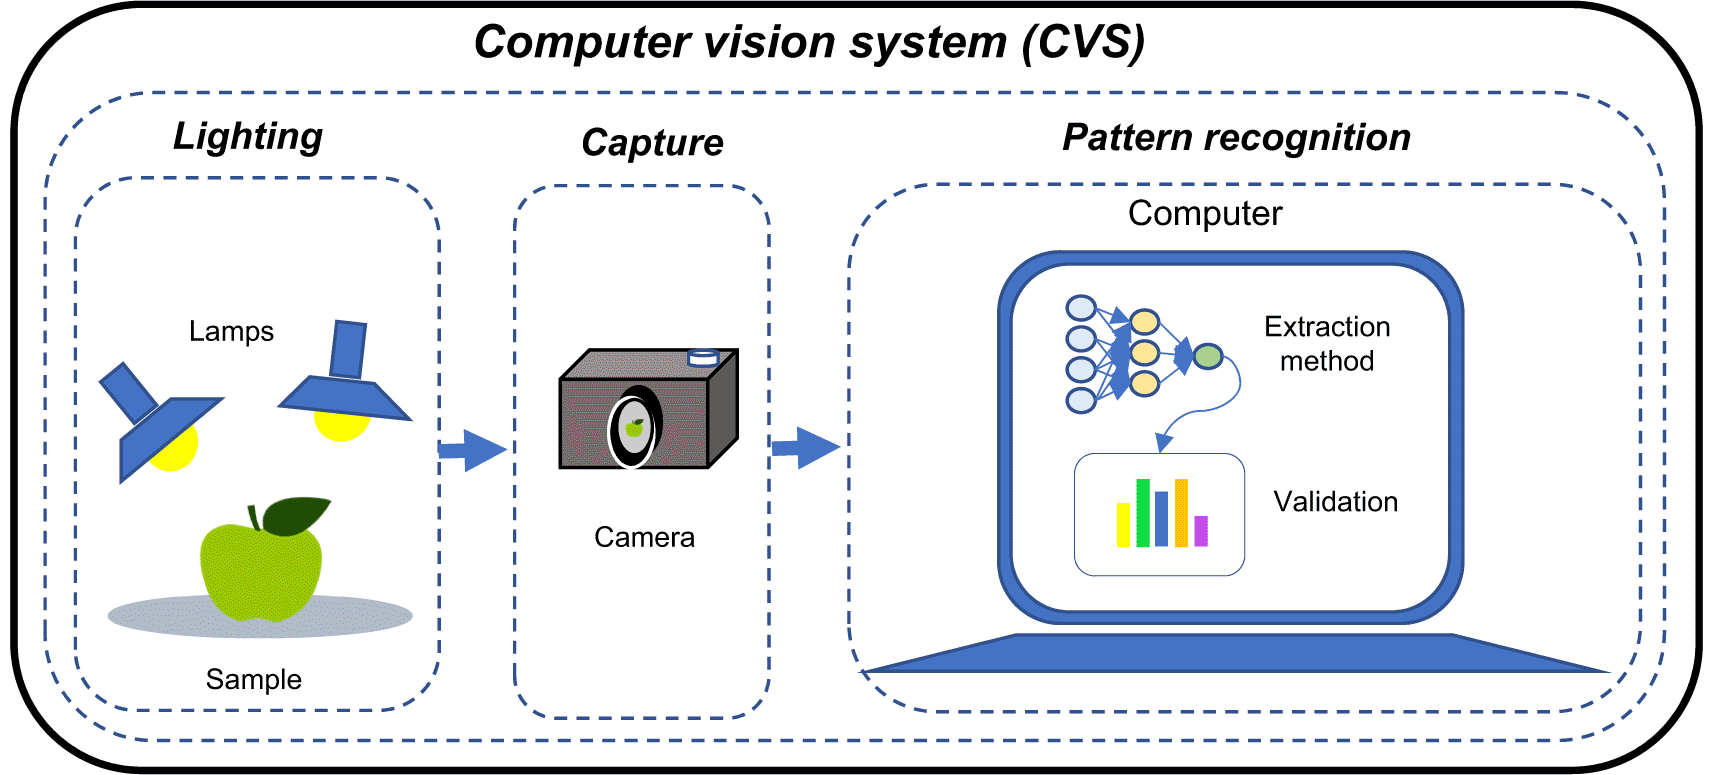
Two of the most commonly used technologies in the second stage are cameras or scanners, which are responsible for taking an image of the object to be analyzed. Cameras capture a two-dimensional image instantaneously, while scanners take a line of pixels in an instant of time, so it requires a mechanism that performs a displacement of the scanner or the object to capture a succession of data and thus obtain the two-dimensional image (Patrício & Rieder, 2018). Internally, these devices have specialized sensors that can capture color, monochromatic, thermal, or ultraviolet images depending on their characteristics (Patrício & Rieder, 2018; Sun, 2016; Vithu & Moses, 2016; Zhang et al., 2014). Other technologies used in this stage are: Hyperspectral, Magnetic Resonance, and X-Ray (Sun, 2016; Zhang et al., 2014).
Finally, the third stage aims to extract quantitative and qualitative information from the image using an analysis algorithm usually run on a processor (Zhu et al., 2021). Depending on the application and the complexity of the system, image processing is divided into three different levels: low, medium, and high. At the first level, operations such as cleaning of noise caused by shadows or external elements, quality enhancement, or correction of image illumination errors are performed (Patrício & Rieder, 2018). Then, at the medium level, segmentation, description, classification of shapes, and image dimensions are performed (Sun et al., 2019; Taheri-Garavand et al., 2019). Finally, at the third level, more complex operations are performed, including classification, comparison, and discrimination of the characteristics of the object in the image. These operations can be applied to the area or regions of interest using analysis methods such as statistical tools or computational models such as neural networks, which are some of the most used extraction methods (Kakani et al., 2020; Patrício & Rieder, 2018).
Given the versatility and advantages presented by a CVS, the food industry has been implementing these systems to identify properties such as: morphology, color, texture, freshness, and quality (Bhargava & Bansal, 2018; Patrício & Rieder, 2018; Taheri-Garavand et al., 2019; Vithu & Moses, 2016). In general, the information collected is fed into databases to train learning algorithms and establish patterns to build a knowledge base, with which a system for autonomous decision-making can be implemented to provide an agile and flexible solution (Zareiforoush et al., 2015).
The applications that recurrently use CVS are focused on the classification and prediction of the characteristics of a food matrix, whether it is an individual analysis, a production batch, or harvesting (Arsalane et al., 2020; Kakani et al., 2020; Velesaca et al., 2021). Research such as the one carried out by Arselane et al. (2020) in which they were able to successfully evaluate and determine the freshness of beef based on color and texture obtained by a portable custom-designed CVS. The system comprises fluorescent lighting, a GigEPRO camera, and an EVM6678 processing system in which PCA, SVN, PNN, and LDA algorithms were evaluated using Matlab®. In a similar investigation carried out by Barbin (2016) to find the relationship between color and quality of chicken meat, a CVS was used with a Doc L-Pix camera.
Researchers such as Ghyar & Birajdar (2017), implemented a CVS, with which the state of pests in the rice plants was identified, to determine and discriminate anomalies or disease traits using leaf texture and color as reference parameters. The system developed consists of a Sony F470 camera, LED illumination, and computer analysis where ANN and SVM algorithms were run. Similarly, Koklu and Ozkan (2020) carried out the classification of seven different bean varieties to ensure the uniformity and quality of the seeds, identifying the characteristics of each bean species such as: area, perimeter, length of major and minor axes, aspect ratio, roundness, equivalent diameter, among others. The CVS was equipped with a Prosilica GT2000C camera, LED lighting, and a processor where an ANN algorithm was implemented in Matlab®.
The research performed by Shrestha et al. (2016) reported a morphological analysis of wheat kernels to segment and classify them into three groups: healthy, damaged, and very damaged, as a consequence of premature germination. The result obtained was the segmentation and classification of the three groups of grains with an accuracy of 95% and 72.8%, respectively. The custom-designed system has two RL04C-OC cameras (Ximea GmbH, Germany), LED lighting system, and ANN implemented in Matlab®.
Other applications of CVS systems are in fruits and vegetables, such as the one carried out by Santos Pereira (2018), where he classified the ripeness level of harvested papayas through the identification of color, length, diameter, and weight with an accuracy of 94.3% compared to manual classification. The CVS developed in-house, incorporates a Sony camera (Japan) located in an environment illuminated with white LED light. The pictures of each fruit were analyzed in Matlab® using a decision tree algorithm. Table 3 shows some relevant investigation where CVS has been used.
| Product | Purpose of the analysis | CVS device | Attribute measured | Extraction method used | Results | Reference |
|---|---|---|---|---|---|---|
| Cherry tomato | Volume and mass estimation | Microsoft Kinect Camera | Size | SVM, Bayesian-ANN | The relation between tomato mass and volume was established as M1.312V^0.995 the mass was estimated at an R2 of 0.9824, with accuracy between 0.9226 and 0.9706 | (Nyalala et al., 2019) |
| Olive oils | Determine the moisture and insoluble impurities | Generic Digital Camera | Color | ________ | The MII content estimated with was determination coefficient (R2) of 0.996 | (Gila et al., 2020) |
| Coffee trees | Estimate the total amount of cherry coffee beans with direct measurements in the field | Camera Phone | Color | CNN | The CV system achieved 0.594 precision and 0.669 cherry beans correctly classified. | (Rodríguez et al., 2020) |
| Black tea | Evaluation of fermentation degree by FT-NIR and computer vision | Digital Camera | Color and UV–Vis spectrometer | LDA, PCA, and SVM | The mid-level fusion SVM model based on PCA obtained an accuracy of 100% | (Jin et al., 2020) |
| Table grapes (Italia and Victoria) | Non-destructive and contactless evaluation between fully marketable and residual quality levels | CCD | Color | Random forest models | Accuracy between 92% and 100% was obtained using the binary classification model by Random Forest | (Cavallo et al., 2019) |
| Coffee beans | Recognition of coffee roasting degree using color patterns in CIE L*a*b* and grayscale comparing them with the numerical scale of roasting defined | Digital Camera | Color | ANN | The ANN obtained a degree of approval of the toast index with a R2 factor of 0.99 | (Leme et al., 2019) |
| Milk | The CVS was compared with a colorimeter to identify similarities in the color measurement of twenty-seven different milks and milk products | Digital Camera | Color | t-test and ANOVA | The comparison tests between the real color and the CVS indicated a similarity frequency of 100% in all cases | (Milovanovic et al., 2021) |
| Apple | Detection of defective apples on a four-line fruit sorting machine Detection of defective apples on a four-line fruit sorting machine | RGB Camera | Color, Size and form | CNN | The model used get a performance of accuracy of 96.5%, recall of 100% and specificity of 92.9%, and accuracy of 92% for the testing set | (Fan et al., 2020) |
| Tomatoes | Use of an ANN with a binary classification for the detection of external defects | CCD | Color and Size | ANN | With the model used, they had an average precision of 97% on the test set, his optimal classified was 86.6% while maintaining a precision of 91.7% | (da Costa et al., 2020) |
| Fruits/vegetables (Orange, Lemon, Sweet Lime, and Tomato) | A binary classification (Bad/Good) of fruits and vegetables using soft computing techniques | Digital Camera | Color and texture | PCA, BPNN, and PNN | A classification pressure was obtained for the test set of 90.58%, 92.90%, 92.90%, and 89.23% for Lemon, Orange, Sweet Lime, and Tomato, respectively | (Veeranagouda Ganganagowdar & Gundad, 2019) |
| Patata | Quality classification based on deformity assessment and mass prediction | CCD | Size, form, volume, and surface gradient distribution | PCL, Model 3D | The success rate in mass classification reached 90%. They demonstrated the mass-volume relationship, mass prediction accuracy reached of 7.7 g for MAE and 4.4% for MPE | (Su et al., 2018) |
| Broiler weight | Broiler weight estimation with the use of a CVS and ANN | Digital Camera | Area, perimeter, convex area, major, minor, and eccentricity | ANN - Bayesian regulation | The model used get a R2 value of 0.98 in the prediction of broiler weight with an accuracy of less than 50 g | (Amraei et al., 2017) |
| Thomson oranges | Automated and non-intrusive estimation of the pH value use of hybrid ICA-ANN algorithm | Digital Camera | Length, width, area, eccentricity, perimeter, RGB value, contrast, texture, and roughness | ANN, ICA, PCA, MSE, RSM | The hybrid algorithm accuracy determined the pH value obtaining an R2=0.843±0.043 | (Sabzi & Arribas, 2018) |
| Pork loin | Prediction of quality using an online computer vision system with an integrated artificial intelligence model | Industrial Digital Camera | Color | ANN | The results obtained with the CVS was a prediction accuracy of 92.5% for pork color and 75.0% for pork marbling score | (Sun et al., 2018) |
| Egg | Estimation of volume and mass of egg with the method disc without damaging the egg. | Portable webcam | size and area | ANNOVA | The CVS with the method used got a result significant of 0.955 y 0.982 for the volume and mass, respectively | (Widiasri et al., 2019) |
The texture of a food is perceived through the response to the contact between the body part and the food. It is a determining characteristic in the acceptance of the product by the consumer (Civille, 2011; Liu et al., 2019; Muthukumarappan & Karunanithy, 2021). Texture is a quality attribute used in the food industry (Torres Gonzalez et al., 2015), allowing the parameterization and standardization of food products (Liu et al., 2019). For example, freshness, a determining characteristic in selecting a vegetable or fruit, can be described by its hardness (Liu & Zhang, 2021). The latter is one of the primary properties of texture, as well as cohesiveness, viscosity, elasticity, and adhesiveness (Foegeding et al., 2011).
To determine some of the main textural characteristics mentioned, Friedman in 1963 established a method called Texture Profile Testing (TPA) (Nishinari et al., 2019). This method generates characteristic curves from the force measurement performed by the jaw to realize a change in the geometrical property of the product, generating deformation or fracture (Kohyama, 2020; Peleg, 2019). The study of these curves allows for establishing and quantifying texture characteristics such as: brittleness, hardness, adhesiveness, cohesiveness, elasticity, gumminess, and chewiness (Nishinari et al., 2019).
For the measurement of texture characteristics, different methodologies and instruments have been developed, the most widely used technology is centered on texture analyzers or texturometers (Torres Gonzalez et al., 2015), which are based on the TPA principle, this device simulates the bite of the jaw in two cycles (compression and decompression), through a controlled mechanism that vertically displaces a uniaxial compression cell (Peleg, 2019). When the cell comes into contact with the product, it generates an electrical signal conditioned by a transducer and sent to a computer to be read by operating software (Taniwaki & Kohyama, 2012). The displacement is carried out until it reaches either a distance threshold or a force level defined by the operator. When this limit is exceeded, the cell moves back and repeats the cycle (Liu et al., 2019).
The texture analyzer usually has three fundamental parts: a moving beam, a load cell, and a control panel (Schmidt, 2018). The first part has a mechanical system that performs the precise vertical displacement of the beam where the load cell is supported; these mechanisms work with a spindle-type system, which has a motor coupled to it that transmits the controlled circular motion (Sussex, 2013). The load cells are electrical elements that generate a voltage signal when they come into contact with a surface (Liu et al., 2019). The cells used are in a range of operation from 100 g to 500 kg (Schmidt, 2018; Sussex, 2013), which will depend on the design of each manufacturer's analyzer.
With the basic structure of the texture analyzer already mentioned, a variety of probes can be incorporated, which, coupled with the load cell, make it possible to measure a large part of the common texture parameters in foodstuffs (Liu et al., 2019). Among which are the cylindrical probe, which was used to determine the firming kinetics of breadcrumbs (Jekle et al., 2018). The conical probe that allowed me to measure the texture for deep-fried and air-fried French fries (Gouyo et al., 2020), The Spherical probe with which they analyzed the texture of the surface of cured ham (Fulladosa et al., 2021). Also, there are gel and cut probe, each with properties to perform certain texture tests.
Some applications in which the texture analyzer is used are evidenced in investigations such as the one conducted by Aguirre et al. (2018), where texture attributes were validated in the “woody breast” and “cooking methods on the marination” (marinated breast), for which a texture analyzer (TA. XT plus, Texture Technologies, Hamilton, MA) was used. The results were compared with a descriptive test, finding a significant difference in 9 of the 11 texture attributes. Another application is shown in the research conducted by Jiménez et al. (2017), where two lionfish surimi patties were studied to validate the efficiency of high-power ultrasound on textural properties. The measurement was performed with a texture analyzer (TA. XT plus, Texture Technologies, Hamilton, MA) correlated with trained panelists.
Other relevant studies, such as those mentioned above, where the aim is to characterize products and correlate them with sensory tests using a texture analyzer, are shown in Table 4.
| Food | Purpose of the analysis | Texture analyzer | Type of analysis | Reference |
|---|---|---|---|---|
| Quinoa | Characteristics of Quinoa Starch (TPA) | TA. XT 2i | ANOVA and LSD | (Wu et al., 2017) |
| Bread | Evaluation of texture attributes | TA. XT plus | ANOVA, LSD, and PCA | (Aleixandre et al., 2021) |
| Olives | Identification of kinesthetic properties of olives | TA. XT plus | ANOVA | (Lanza & Amoruso, 2018) |
| Pear | Identification of textural properties of Asian pear peel | TA. XT 2i | ANOVA | (Pham & Liou, 2017) |
| Strawberry jam | Relationship between sensory and instrumental analysis for the texture of strawberry jam | TA. XT 2i | ANOVA | (Kurotobi et al., 2018) |
| French fries | Evaluation of the texture of French fries from various restaurants. | TA. XT plus | ANOVA | (Li et al., 2020) |
| Cooked rice | Identification of textural properties | TA. XT plus | ANOVA, PCA | (Tao et al., 2020) |
| Chicken breast | Identification of textural properties | TA. XT plus | ANOVA | (Aguirre et al., 2018) |
Although TPA is a method that simulates the chewing process, its shear rate is low compared to that of the human bite (Nishinari & Fang, 2018). Therefore, some researchers have focused on finding other mechanisms that allow an understanding of the bite processes of people in a real environment. One of the alternatives is the study of Electromyographic (EMG) signals, which are produced by the nervous system so that the muscles involved during the chewing process react in a certain way producing electrical signals that can be measured (Besomi et al., 2020; Pereira de Caxias et al., 2021). These signals are captured with an electromyograph, which integrates an instrumentation amplifier that captures and amplifies the EMG signal with the help of three reference electrodes (Fang et al., 2020). This signal is sent through a data acquisition board (DAQ), to a processing system where it is processed and sent to a data acquisition system (DAS) (Gohel & Mehendale, 2020) to a processing system where it is subjected to extraction methods that perform the analysis of the signal (Ahsan et al., 2009; Zabala et al., 2019).
Sodhi et al. (2019) correlated bite EMG signals with texture variables (instrumental and sensory) of seven Indian sweets, identifying EMG parameters that distinguish the different textured foods. In addition, the PCA determined the significant correlation between hardness (instrumental and sensory) and sensory stickiness. Similarly, Shimada et al. (2012) established intraoral force recordings to analyze the mechanics of human chewing by measuring the force (using strain gauges located on the molars) and the EMG signals (using electrodes located on the masseter muscle) during the biting process of five different products (rice, bread, almonds, banana, and apple). Other relevant studies where the effectiveness of the analysis of EMG signals to determine the texture of a food matrix is sought to be validated are shown in Table 5.
| Food | Purpose of the analysis | Instrument | Type of analysis | Results | Reference |
|---|---|---|---|---|---|
| 7 different foods (Rasgulla, gulab jamun, cham, milk cake, petha, chana murgi, chocolate barfi) | Correlation of EMG variables with texture parameters | Own EMG | PCA | The PCA variables explain 76% of the variance, and the principal components are correlated with instrumental and sensory hardness. | (Sodhi et al., 2019) |
| Hydrocolloid gels | Identification of different textures | EMG | ANOVA | Identification of the relationship of EMG signals with chewing stress, fracture toughness, and adhesiveness. | (Kohyama et al., 2015) |
| Dhokla, paneer, rasgulla, cake and jelly | To study the relationship of EMG variables with sensory and instrumental texture parameters. | EMG and texture analyzer | PCA | Fifteen EMG variables were found to be effective in explaining significant texture variation (p ≤ 0.05). | (Rustagi et al., 2022) |
| Steamed rice cake | Study of rice cake structure with different rice flour particle sizes. | EMG and texture analyzer | TSD, ANOVA and MFA | The EMG response measured the relationship between the chewing process and textural properties. | (Lee et al., 2021) |
| Brown rice and wheat flour crackers | Physicochemical and textural evaluation | EMG and | PCA | Correlation between sensory parameters and EMG, for the two cookies found significant differences (p < 0.05) that distinguish the texture of the cookies. | (Dhillon et al., 2021) |
Food products have the characteristic that when consumed they generate sounds that allow identifying or relating some textural properties such as hardness, crispness, and crunchiness to it (Dias-Faceto et al., 2020). Some of the equipment to perform these measurements use devices such as microphones connected to computers, texture analyzers integrated with microphones (Dias-Faceto & Conti-Silva, 2022), and alternative designs with oscillating tips and piezoelectric sensors (Taniwaki et al., 2006). All these devices allow capturing the acoustic waves produced by the deformation of the product.
Researchers such as Błońska et al. (2014), showed that adding inulin with reduced fat content significantly affected the acoustic parameters of Short-Dough Biscuits. Eight Short-Dough Biscuits with different percentages of inulin addition were compared, determining the impact on the acoustic properties and the decrease in the breaking workforce. For example, the biscuit with 74.1% fat and 18.5% inulin, showed a low acoustic energy level of 1.134 a. u. this compared to a biscuit with 55.6% fat and 9.3% inulin, in which a high acoustic energy level of 17.373 a. u. was found, the former being less brittle and hard compared to the latter. This was achieved using a Zwick 1445 measuring system (Zwick GmbH & Co. KG, Ulm, Germany). Separately, Jakubczyk et al. (2017) studied the acoustic signals generated during puncture tests on some coextruded cereal products with different fillings (toffee, milk, fruit jelly, coconut, and chocolate creams), to perform the analysis of hardness, crunchiness, and texture sound attributes for each product. The results showed that the snacks with jelly filling were perceived as less crunchy and soft, compared to the snack with milk cream filling, which showed high acoustic and mechanical values that link it to crunchiness. The variables were measured with a BC45 cooking extruder (Clextral, Firminy, France). Other relevant investigation, such as those mentioned above, where acoustic analysis was performed to determine some textural properties of certain foods, can be seen in Table 6.
| Food | Purpose of the analysis | Instrument | Type of analysis | Results | Reference |
|---|---|---|---|---|---|
| Chips, cereals, cookies, others. | Identification of instrumental configuration with increased sensitivity of acoustic signals used as a sensory indicator of dry and crispy foods. | TA. XT plus Texture Analyzer | SPL Dias-Faceto, Salvador, and Conti-Silva 2020 | Identification of gain 1 as the most suitable acoustic condition to define different croaking intensity. | (Dias-Faceto et al., 2020) |
| Apple, cookie, biscuit and potato chip | Acoustic measurement of food texture | Designed instruments, Swing arm | FFT and ETI | Identification of textures for each product with a confidence level of 95% | (Akimoto et al., 2019) |
| Apple, biscuit, cucumber, lettuce, Japanese cracker and radish | Acoustic vibration measurement for food texture determination | Device with piezoelectric sensor in a horizontal manner | FFT and ETI | Determination of different texture indices according to device response. | (Iwatani et al., 2013) |
| Banana, salad, rice balls, others | Estimation of food texture | Vibraudio EM20 Microphone | SOM | A model was obtained to predict texture with 90% accuracy. | (Zhang et al., 2012) |
As evidenced in this review, some technological tools have been developed to emulate the functioning of the five senses (smell, taste, sight, touch, and hearing), seeking to quantify and characterize some sensory properties of different food matrices, to compare, parameterize and standardize a product. These investigations show that the use of technological tools guarantees the repeatability and reproducibility of the process, compared to the results obtained when working with trained panelists. Therefore, the use of this type of device reduces the number of samples required to perform the analysis, in addition to dispensing with the need for a team of trained panelists, which generates a reduction in costs. In addition, another advantage of these tools is the wider measurement capacity compared to that of human beings. However, most of the tools analyzed only have the property of measuring a single characteristic in a food matrix, this becomes an inconvenience when it comes to characterizing an entire product, for which many tools must be available, samples required and therefore an increase in the time of the analysis and availability of personnel to carry out the process. This is why both the scientific community and the industry, increasing the development of research that seeks to create new technological tools that allow the measurement of two or more sensory characteristics in a food matrix. All the above, seeking to develop new food products and improve existing ones to satisfy the sensory experiences of the consumer, driving growth in the food sector.
| Views | Downloads | |
|---|---|---|
| F1000Research | - | - |
|
PubMed Central
Data from PMC are received and updated monthly.
|
- | - |
Provide sufficient details of any financial or non-financial competing interests to enable users to assess whether your comments might lead a reasonable person to question your impartiality. Consider the following examples, but note that this is not an exhaustive list:
Sign up for content alerts and receive a weekly or monthly email with all newly published articles
Already registered? Sign in
The email address should be the one you originally registered with F1000.
You registered with F1000 via Google, so we cannot reset your password.
To sign in, please click here.
If you still need help with your Google account password, please click here.
You registered with F1000 via Facebook, so we cannot reset your password.
To sign in, please click here.
If you still need help with your Facebook account password, please click here.
If your email address is registered with us, we will email you instructions to reset your password.
If you think you should have received this email but it has not arrived, please check your spam filters and/or contact for further assistance.
Comments on this article Comments (0)