Keywords
comparative genomics, orthologous groups, whole genome duplications, yeast
This article is included in the Bioinformatics gateway.
This article is included in the The OMA collection collection.
comparative genomics, orthologous groups, whole genome duplications, yeast
The potential roles of gene duplication in driving evolutionary innovation have now long been recognized.1 Whole genome duplication (WGD) is a major event leading to duplicated genes, found several times over the course of evolution in many eukaryotic organisms,2 and leads to the formation of an organism (or a cell) with additional copies of its entire genome. This event is often followed by massive gene losses due to non-functionalization, however some duplicated genes might undergo subfunctionalization (gene partitioning) or neofunctionalization (acquire a novel gene function) which will favor their preservation.3
To understand the circumstances leading to WGD in eukaryotes, Marcet-Houben and Gabaldón proposed a hypothesis describing an ancient allopolyploidization event (hybridization event between two different species of the yeast prior to the genome doubling).4 In case of an autopolyploid scenario (genome doubling in a single species), benefits from neofunctionalization would only take effect in the long run. In contrast, an allopolyploid scenario would lead to an initial selective advantage, because of the fact that it brings together different physiological properties and isolates the newly formed lineage sexually.4
Elucidating the causes of WGD remains a non-trivial task, as such events are often ancient and leave few traces, since over the course of evolution polyploidy is usually not maintained.5–7 For the same reasons, dating these events becomes challenging. One type of remaining traces in available genomes are conserved paralogs (i.e. ohnologs) which are defined as descendants of an ancestral gene derived from a duplication event. Paralogs are also referred to as ohnologs when resulting from WGD.
Finding homologous relationships (genes derived from the same ancestor) is a key concept in evolutionary biology used by researchers to describe genetic differences and similarities between different species. One way to categorize genes is by inferring so-called hierarchical orthologous groups (HOGs). HOGs are defined as “sets of genes that have descended from a common ancestral gene in a given ancestral species”.8 These nested groups of orthologs and paralogs, defined at each taxonomic level, can be used to reconstruct ancestral genomes and infer gene families. This also provides information on evolutionary events such as gene duplications, gains or losses between known or reconstructed genomes. These inferred relationships play a critical role for this study.
Over the past few decades, multiple WGD events on the tree of life have been detected.9 In early vertebrate evolution, Susumu Ohno proposed that two rounds of complete genome duplication occurred (often referred as 2R). There is now strong evidence confirming this hypothesis.10 Additionally, a consensus has been reached in favor of a third round (3R) WGD occurring in the fish lineage and thus also referred to as the fish-specific genome duplication.11 As mentioned earlier, WGD events have also been established in other eukaryotic lineages. For instance, an ancestral genome duplication has been placed before the common ancestor of extant seed plants, followed by another in the common ancestor of extant angiosperms.12 Moreover, multiple WGD events have been estimated among eudicotyledons and monocotyledons.12 Over the course of evolution, another well-known case occurred just before the separation of the yeast species Vanderwaltozyma polyspora from the S. cerevisiae lineage.13
Although found in vertebrates, plants, fungi, and invertebrates, WGDs remain relatively rare evolutionary events that have far-reaching repercussions on speciation and biodiversity dynamics.2,14 Being able to place them across the tree of life is crucial to our understanding of species’ evolutionary history. Additionally, polyploidy has important effects on human health. Belonging to the hallmarks of cancers, polyploidization events are found in roughly one third of human cancers. Besides cancer, genome duplications also occur in normal cells such as hepatocytes and in premalignant lesions, impacting other disease conditions.15 Thus, expanding knowledge of WGD is of great importance for cancer and other disease research.
Currently, the main existing approaches for detecting WGD using genomic data are based on the detection of large conserved syntenic regions, gene counts along phylogeny, and synonymous mutation rates.16,17 These methods all have their own drawbacks. For instance, investigations through synteny require high-quality genome assemblies providing gene order, and might be biased by small scale duplications or remaining layers of older WGD.18 In methods based on the number of synonymous substitutions per synonymous site (Ks), signal is lost in older WGDs due to Ks stochasticity. Moreover, these methods suffer from Ks saturation which might lead to the formation of artificial peaks.19 Such limitations could be mitigated by leveraging a combination of multiple techniques when trying to infer WGD events. Finally, to cope with the rapid increase in available genomic data, scalable methods need to be developed.
This study aims to propose a novel approach, based on hierarchical orthologous groups of duplicated genes (henceforth referred to as duplication HOGs), to locate WGD events on the given phylogenetic tree of a set of organisms. The method relies on the organisms’ proteomes, i.e. protein sequence annotations, for the detection of WGD resulting from allopolyploidy or autopolyploidy. This study is focused on the yeast lineage as it contains a single well-established WGD.13 Additionally, yeast species have relatively small and less complex genomes, facilitating computation and analysis, thus favoring this choice. Applying our proposed method on two datasets comprising yeast species allowed proper identification of previously reported WGD events (details in the Results section). It is worth mentioning that the method could be used for newly sequenced genomes as well.
Our method uses the HOGs in addition to the species tree as inputs. In the following section, we described how one can estimate HOGs for the genome of interest. Then, in the section “Detection of whole genome duplications (WGD)”, our method to detect WGD is presented in detail. Of note, we evaluated our method using 32 yeast genomes from the Saccharomycetales clade (details in the Results section).
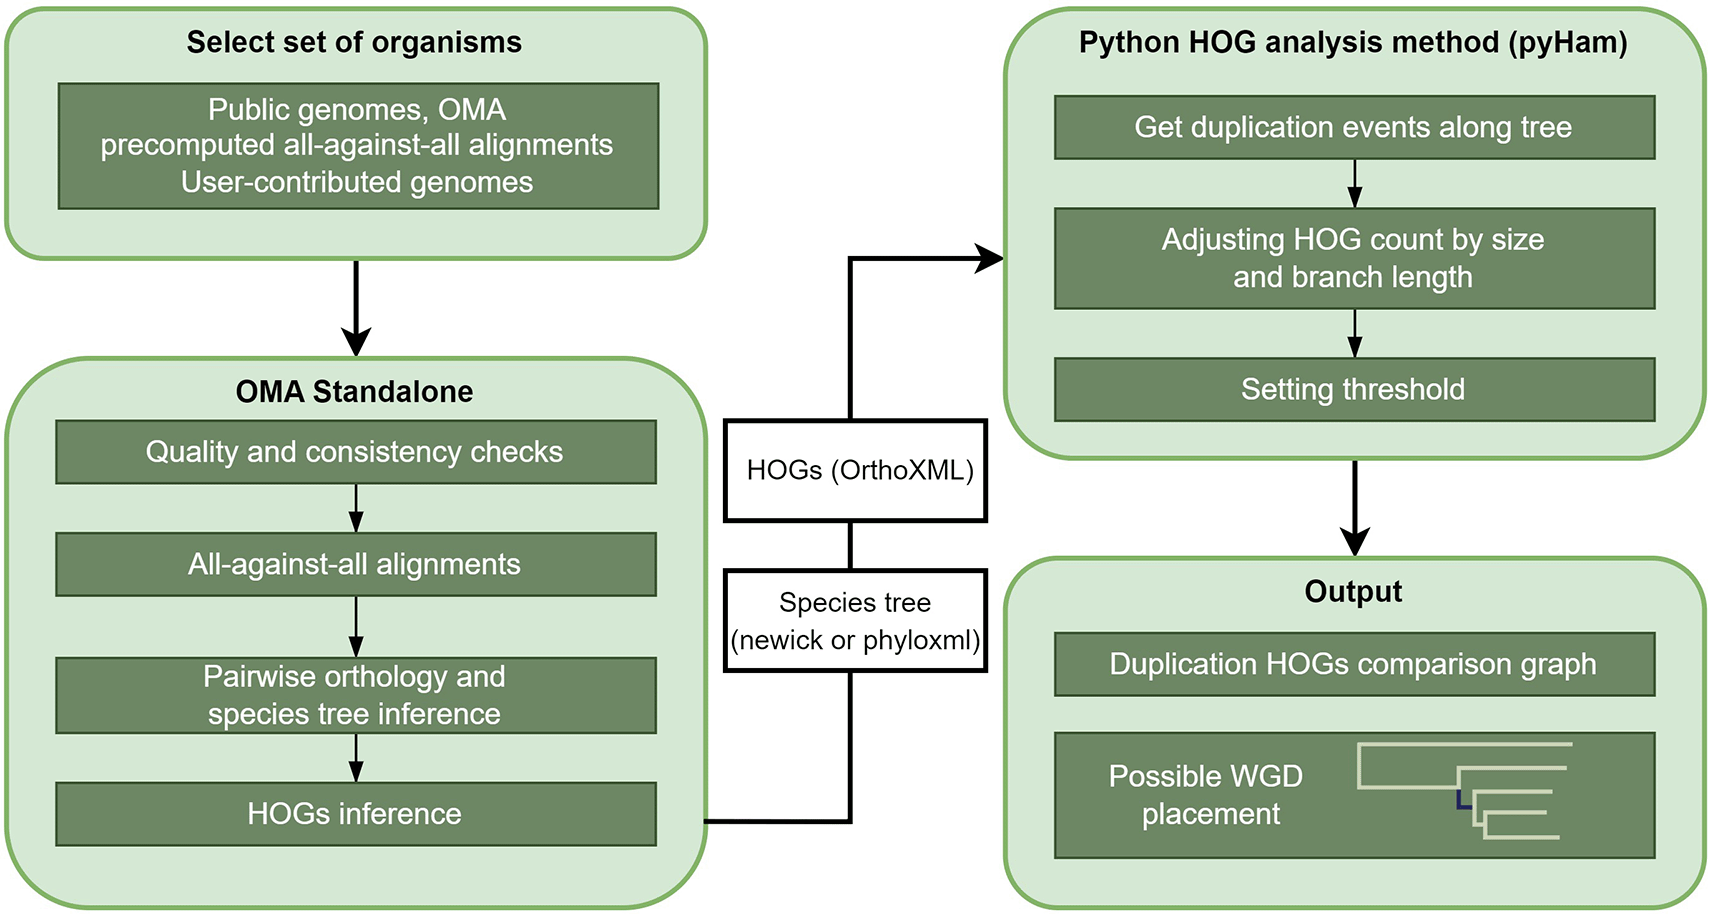
We used the OMA Standalone software20 to infer HOGs and to reconstruct ancestral genomes. To obtain HOGs, OMA Standalone performs multiple steps. First, the data undergoes quality and consistency checks. Second, all-against-all sequence alignments are computed in order to infer pairwise orthologs. We exported precomputed all-against-all protein sequence alignments from the OMA browser.21,22 Using precomputed all-against-all alignments as the input of the OMA standalone software significantly lowers the needed computational resources. In contrast to most other orthology inference resources, during the all-against-all alignment phase, OMA compares multiple isoforms in order to identify and utilize the isoform with the best cross-species matches.21 Next, pairwise orthologs are used to build an orthology graph. Finally, the GETHOGs algorithm (“Graph-based Efficient Technique for Hierarchical Orthologous Groups”) utilizes this graph and the given species tree for HOG inference. If no species tree is given, OMA estimates it using a least-squares distance approach based on OMA groups23 (Figure 1). OMA standalone was run with the selected sets of yeasts to obtain an estimated species tree in Newick format and HOGs in an OrthoXML file.20

The main steps of the developed method are illustrated on this flowchart. (For the complete description of the method, see the Methods section).
For WGD analysis, the number of inferred duplicated genes at each taxonomic level is essential. To retrieve this information, the python library pyHam (“python HOG analysis method”)24 was used. This package facilitates the extraction of evolutionary information such as gene duplications or losses at specific taxonomic levels from OMA Standalone’s HOG inference output. The duplication events can be inferred by the “mapper” class by comparing evolutionary relationships between an ancestral node and any of its descendants.
Our method to place WGD events is based on the number of HOGs which were the direct result of a duplication event (we call them as “HOGs of duplicated genes”) (Figure 1). The species tree was traversed from the root node and the evolutionary history, including duplication events, of all the genes between each ancestor node and its two closest descendant nodes were inferred using pyHam’s “vertical comparison” method.24 The number of HOGs of duplicated genes, rather than the number of duplication events was considered, as ohnologs should result from one large duplication event. Branches in the species tree with significantly higher numbers of duplication HOGs (after the adjustments described below) were considered as putative WGD events.
In order to have a fair comparison between branches on the species tree with different lengths, the number of duplication HOGs was adjusted by evolutionary distance and average genome size. Adjusting by distance is based on the molecular clock hypothesis, which states that DNA and protein sequences evolve at a somewhat constant rate throughout time and across organisms.25 With this assumption, we would expect more evolutionary events over a longer time period and thus need to adjust the number of duplication HOGs accordingly by dividing by branch length.
Note that since there could be some small branches in the tree which make the number of duplication HOGs adjusted value misleadingly high, it is needed to use a pseudocount when dividing counts by distance. Depending on the dataset, the user of our code is able to use different values of this pseudocount (set to one as default). Finally, to balance among the different genome sizes, the average number of genes between the compared nodes is used based on the assumption that the ancestor and descendant share similar genome sizes. These adjustments can be summarized with the following formula:
After obtaining the number of adjusted duplication HOGs for each branch, values and distribution were plotted to determine a significant threshold for selecting possible WGD candidates. Another way to find candidates is by computing adjusted HOG counts with different pseudocounts and considering branches that remain significant over the various adjustments. In order to find these high values (outliers), we set a threshold for each separate case which is defined based on the interquartile range.
Benchmarking of this method was done by comparing results with known cases found in the literature.4,26
A diverse range of yeast organisms were used in this project in order to assess the performance of our WGD placement method. We chose yeast for a proof of concept because this clade is well documented and the species have simple genomes relative to other eukaryotes. These genomes were extracted from the Orthologous MAtrix (OMA) database.20 This database currently contains 2,496 genomes (Nov. 2022) from across the entire Tree of Life and is continuously being updated. As part of method evaluation, we first consider a small dataset, “small yeast”, of five species including Schizosaccharomyces pombe, Kluyveromyces lactis, Zygosaccharomyces Rouxii, Vanderwaltozyma polyspora and Saccharomyces cerevisiae. In this dataset, the well-known model organism S. pombe acts as a rooting species. It is known that K. lactis and Z. rouxii are potential candidates of species that might have led to the WGD in the hybridization theory4 and thus branching off before the known WGD placed before V. polyspora’s branch. In other words, Vanderwaltozyma polyspora and Saccharomyces cerevisiae are known to have undergone polyploidization.4 Another dataset, “large yeast”, was used as proof of concept and is composed of 32 species from the Saccharomycetales order found on the OMA database in addition to the species Penicillium chrysogenum for rooting.
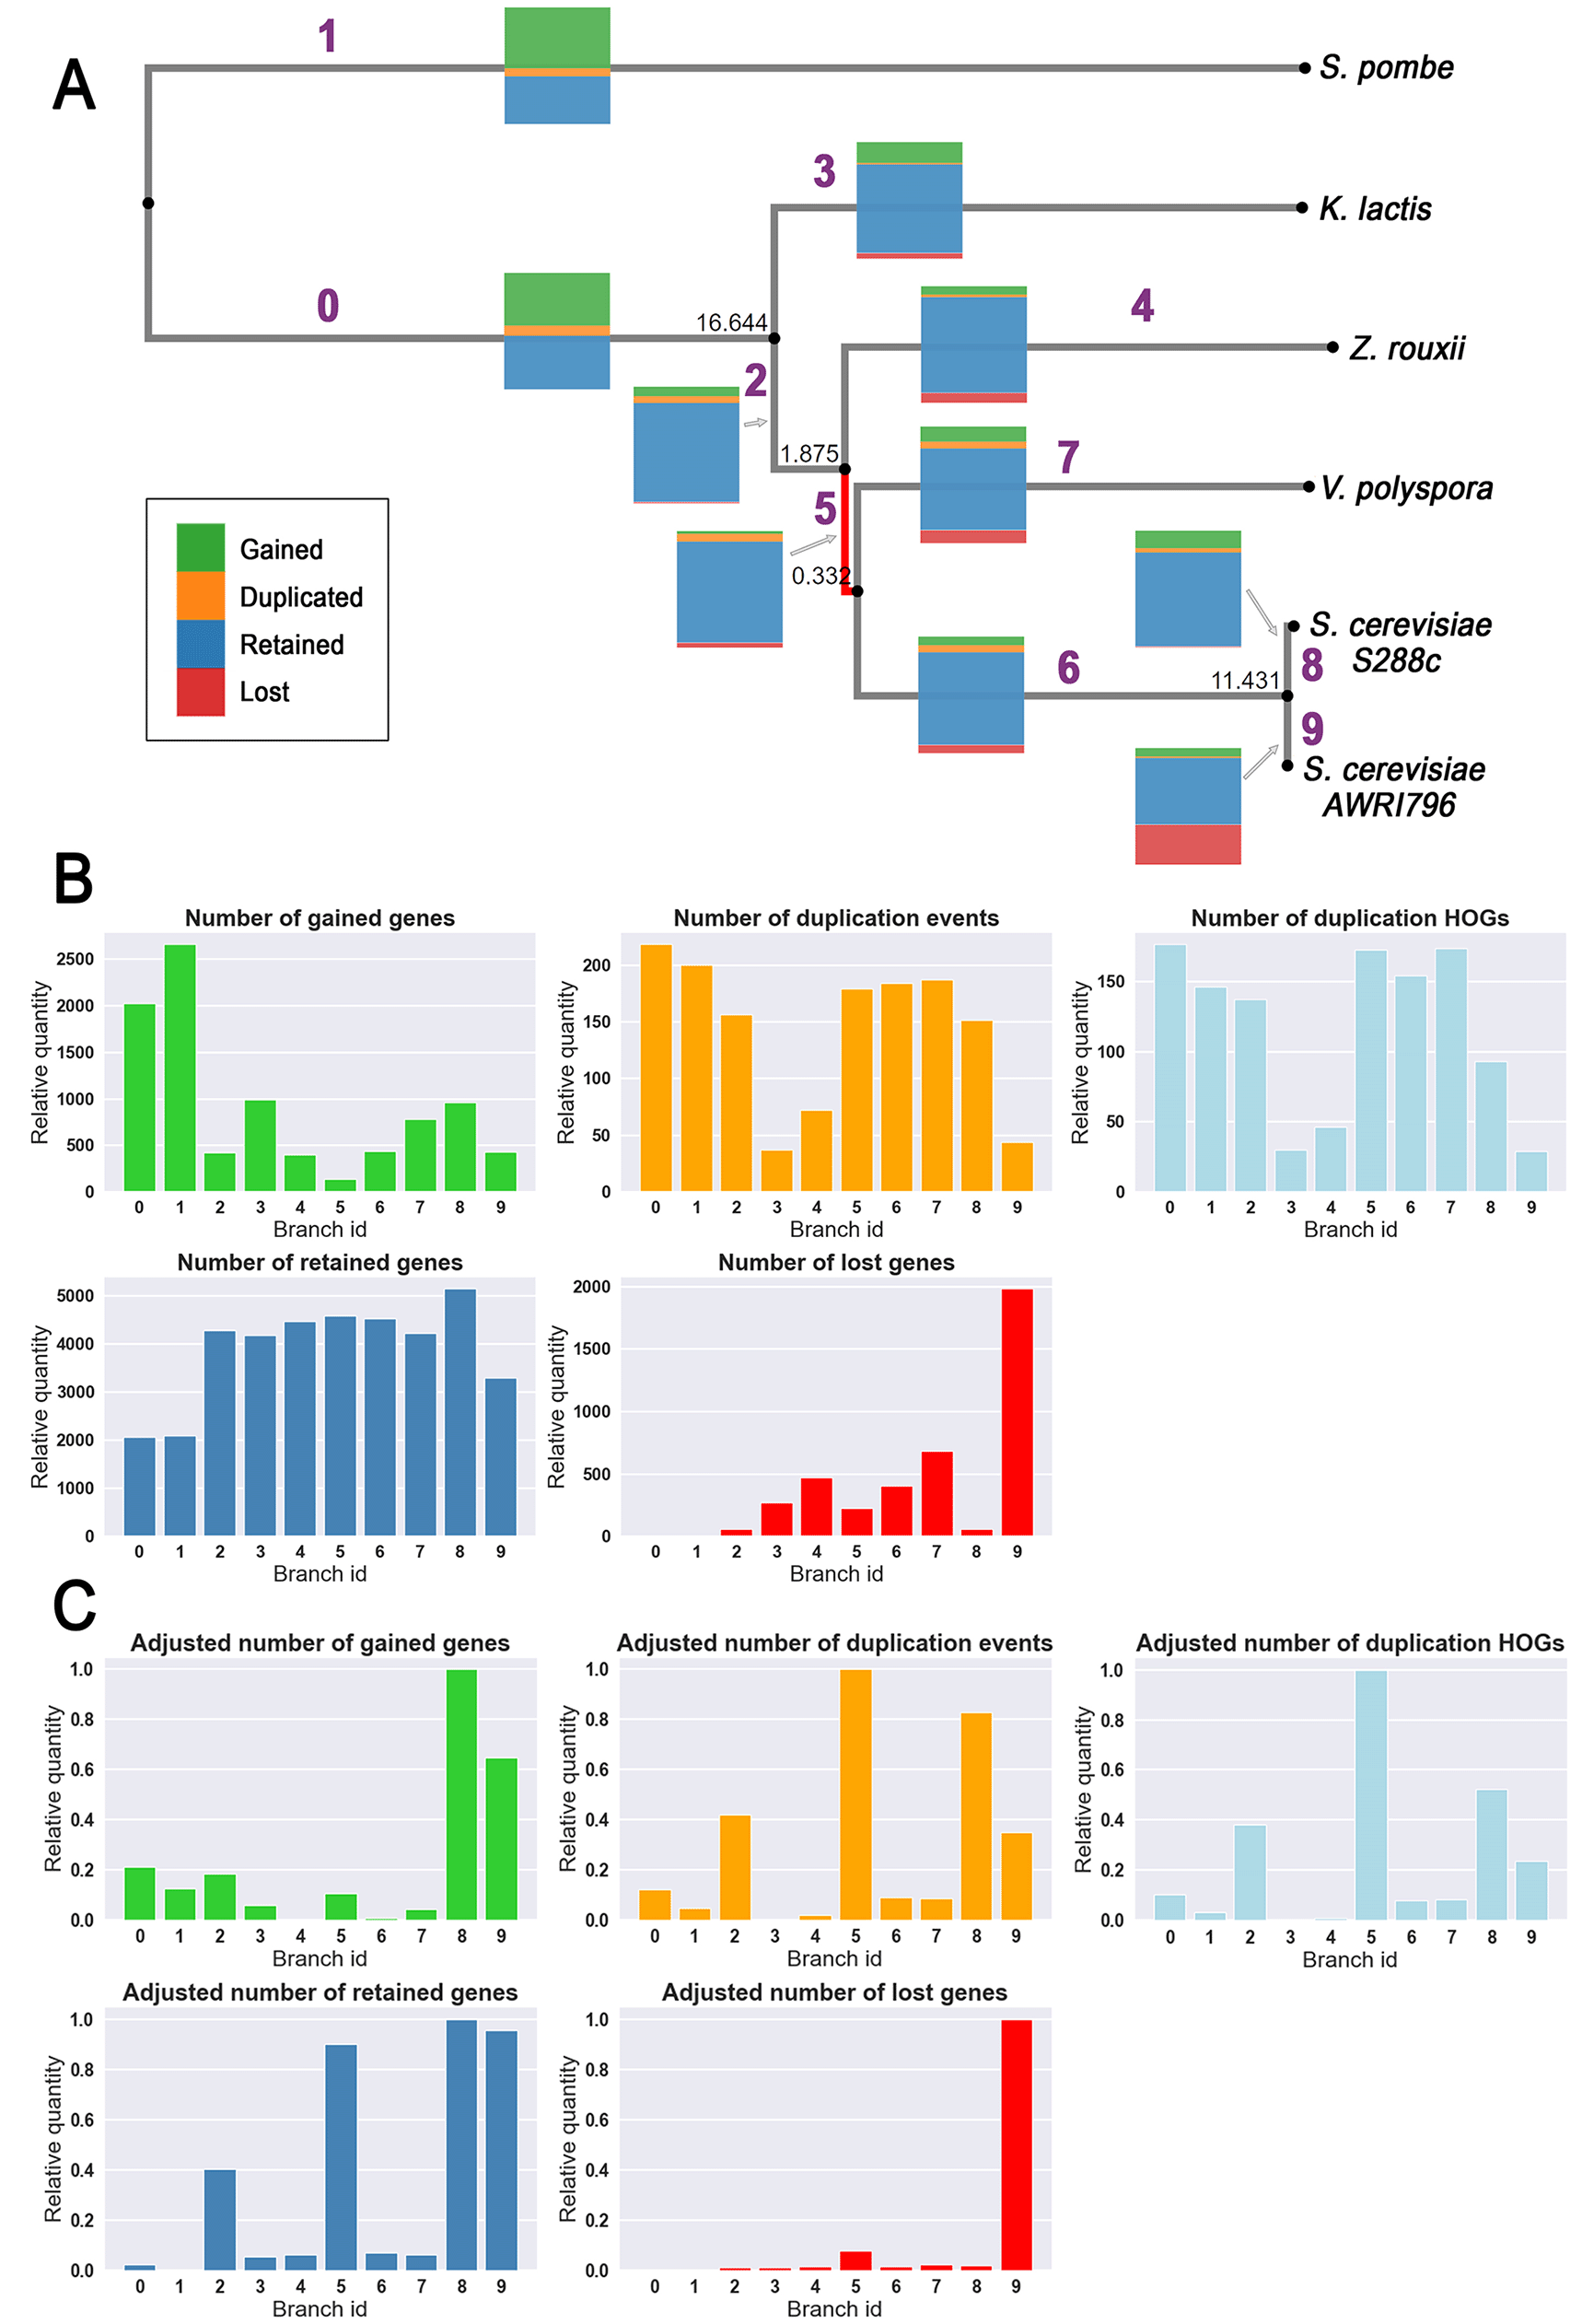
As described in the method section, once HOGs were inferred with OMA standalone, the estimated number of gained, duplicated, retained or lost genes on each branch was obtained and visualized with a python package pyHam (Figure 2A,B). We notice a striking gene loss on the branch leading to the extant Saccharomyces cerevisiae South African wine strain (strain AWRI796), which may be due to its domestication. However, many of the gene losses might be false positives, which can happen when the extant genome is of lower quality or incomplete. Branches leading to Kluyveromyces lactis and Zygosaccharomyces rouxii have slightly less duplication than the other branches, but this data on its own is not sufficient to discriminate against possible WGD candidates (Figure 2A,B).

(A) Inferred phylogenetic tree of the “small yeast” dataset using OMA standalone pipeline. Numbers in black correspond to branch length and numbers in purple to the branch id found in the bar plots. Colored stacked bars on branches illustrate the non-adjusted number of gained, duplicated, retained or lost genes from one node to another (these species have roughly 5000 genes in average). The same information can be found as a barplot on panel B. The red-colored branch corresponds to the placement of the whole genome duplications (WGD) detected by our method. (B) Bar plots represent the number of gained genes, duplication events, duplication HOGs, retained genes, and lost genes for the “small yeast” dataset. Branch ids correspond to the ids found on the phylogenetic tree of panel A. (C) Same bar plots as panel B adjusted by the distance (branch length plus pseudocount of one) and the average genome size for each branch (id).
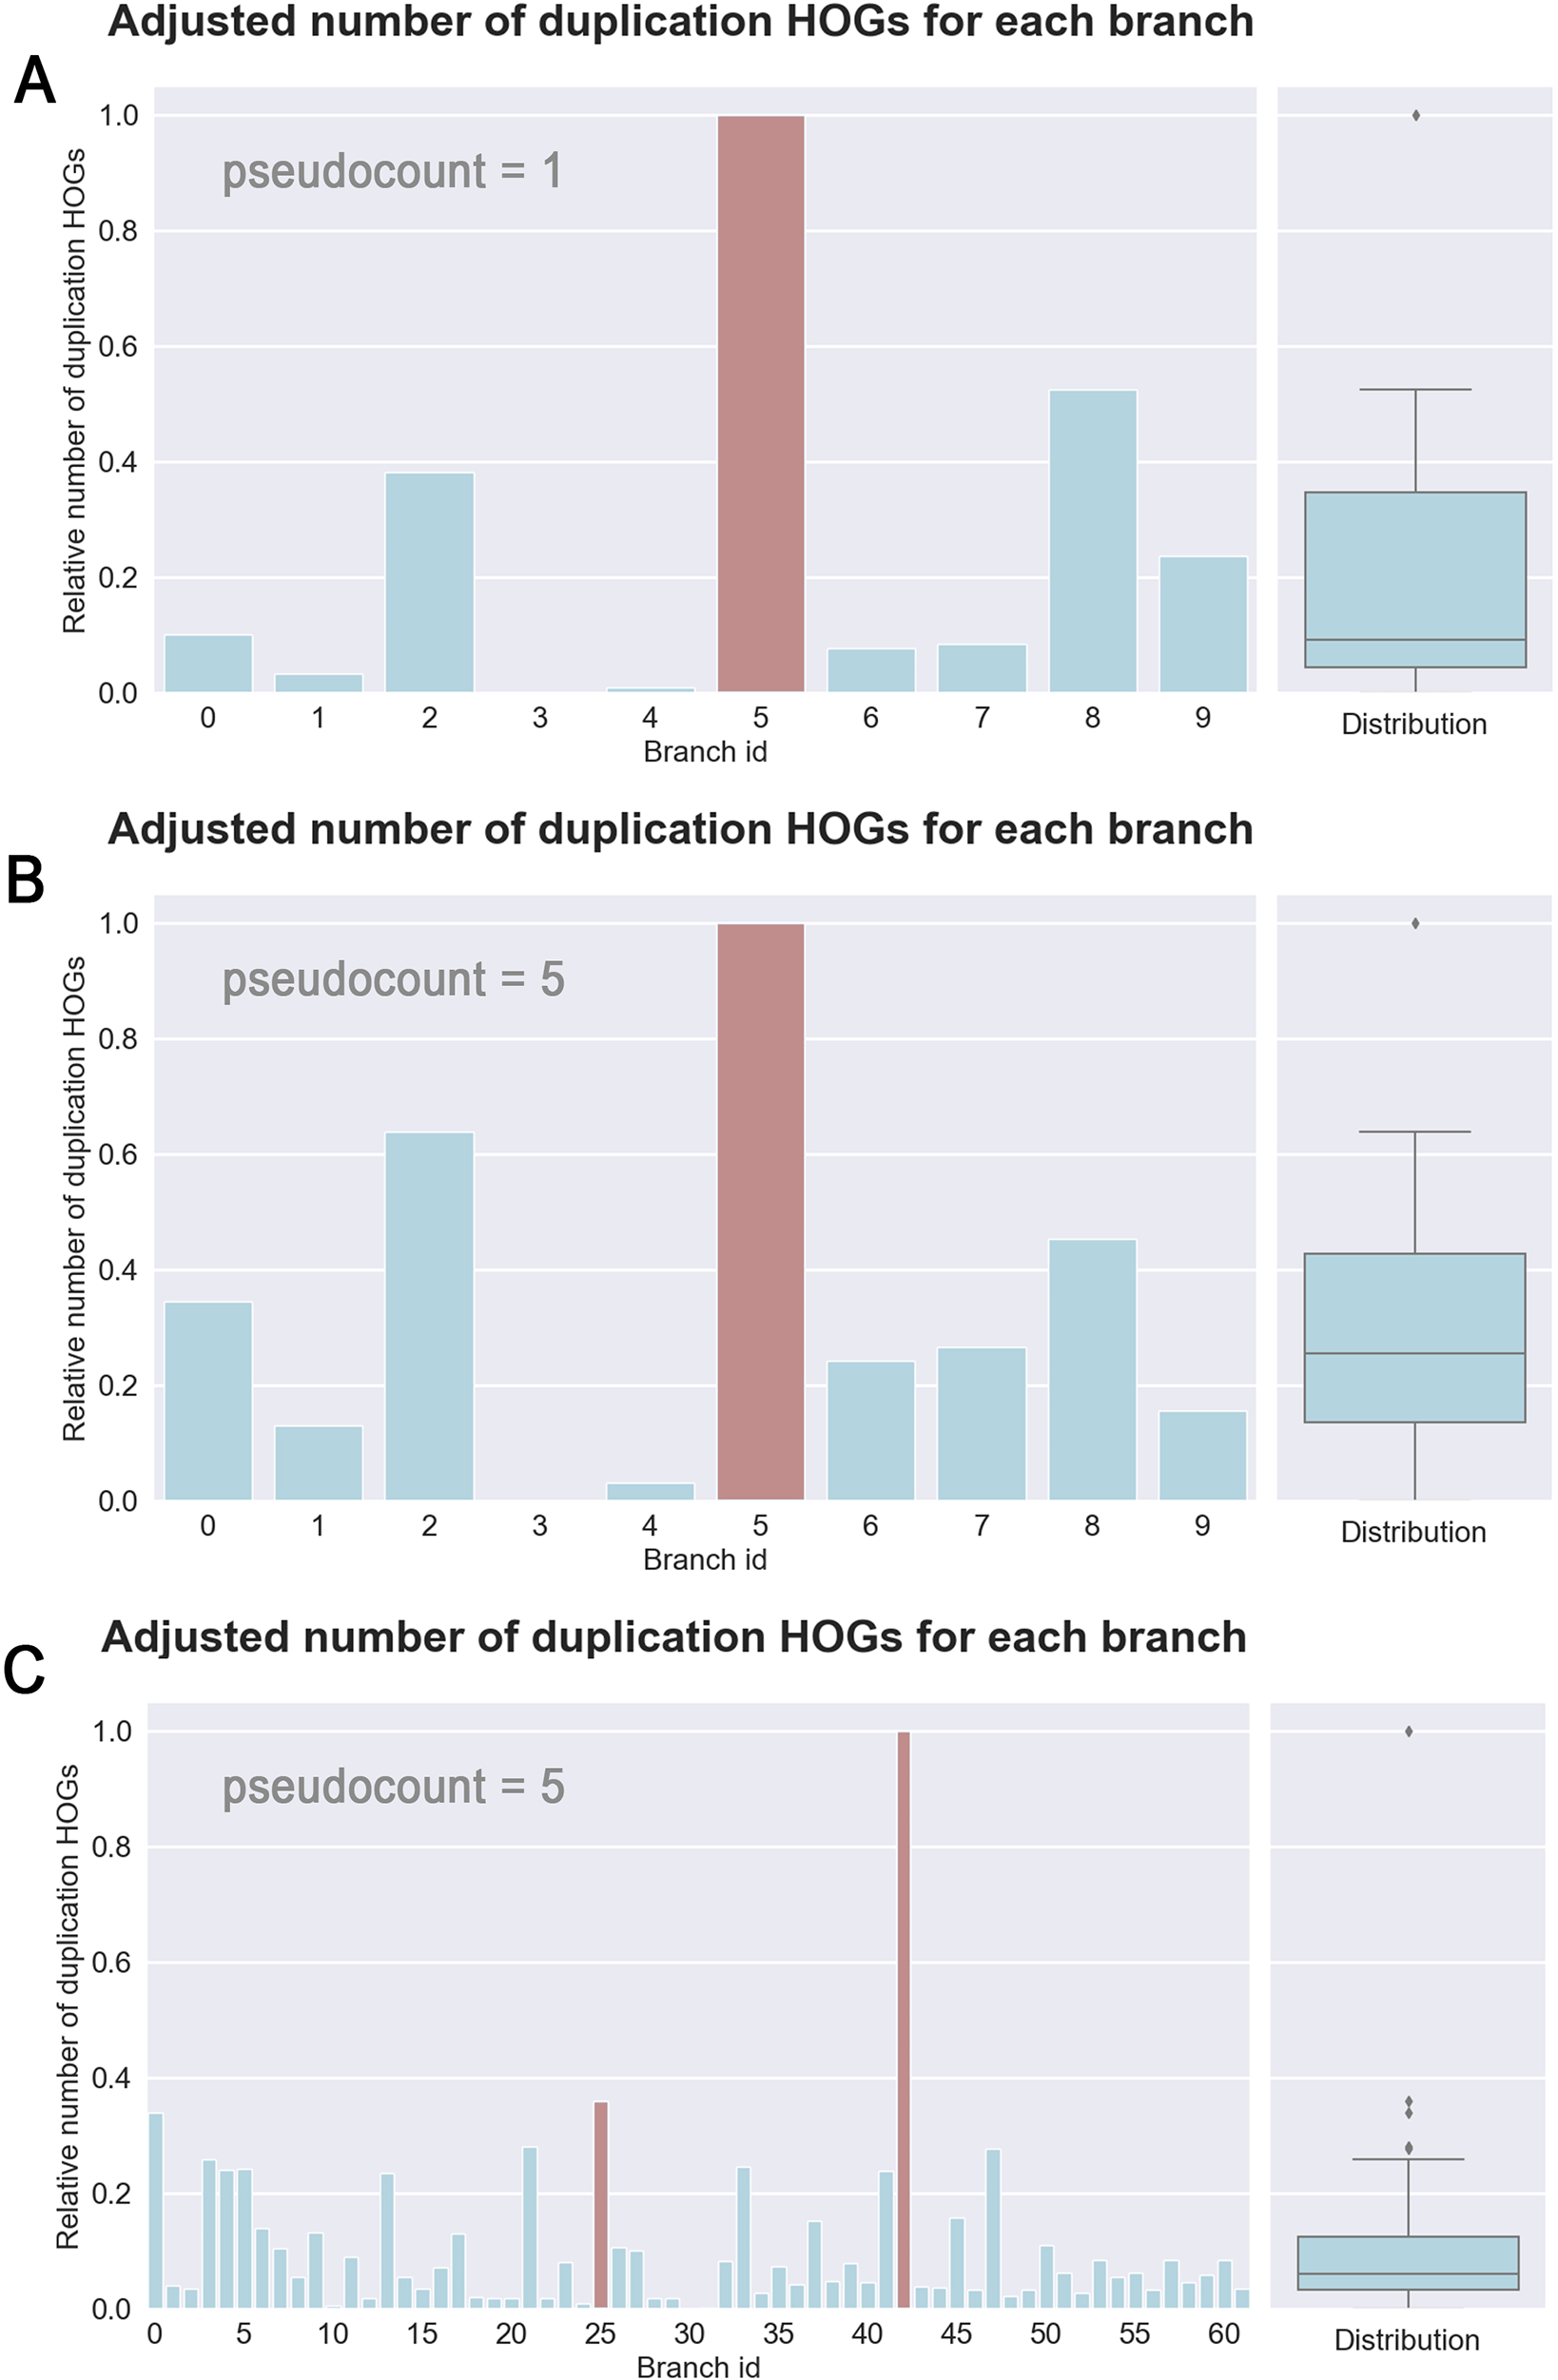
However, when counting the number of duplication HOGs adjusted by genome size and branch length, a distinctive larger relative quantity (seen as an outlier on the distribution) appears on the branch of the known WGD (branch id 5; Figure 2C). The significance threshold is determined by adding the third quartile to the multiplication of the interquartile range by 1.5 (Figure 3A). This allows clear placement of the WGD event on the species tree. Note that this significant value remains with a pseudocount of five (see Figure 3B). Indeed, the next highest quantity (branch id 8) lies at only 52% of this significant value.

(A) Bar graph of the relative (by min-max normalization) adjusted (by branch length plus one and average genome size) number of duplication hierarchical orthologous groups (HOGs) for each branch of the “small yeast” dataset (see Figure 2 for branch id correspondence). On the right side, the box plot represents the distribution of these values. The distribution outlier is considered as a significant value and thus as a WGD candidate. Red colored bars correspond to branches that are significant over a range of different pseudocounts. (B) Replication of panel A barplot with a pseudocount of five. (C) Adjusted number of duplication HOGs for each branch of the “large yeast” dataset. Pseudocount added to the distance changed to five. Red colored bars correspond to branches that remain significant across a range of different pseudocounts (e.g. 1,5 and 10). See Figure 4 for branch id correspondence.
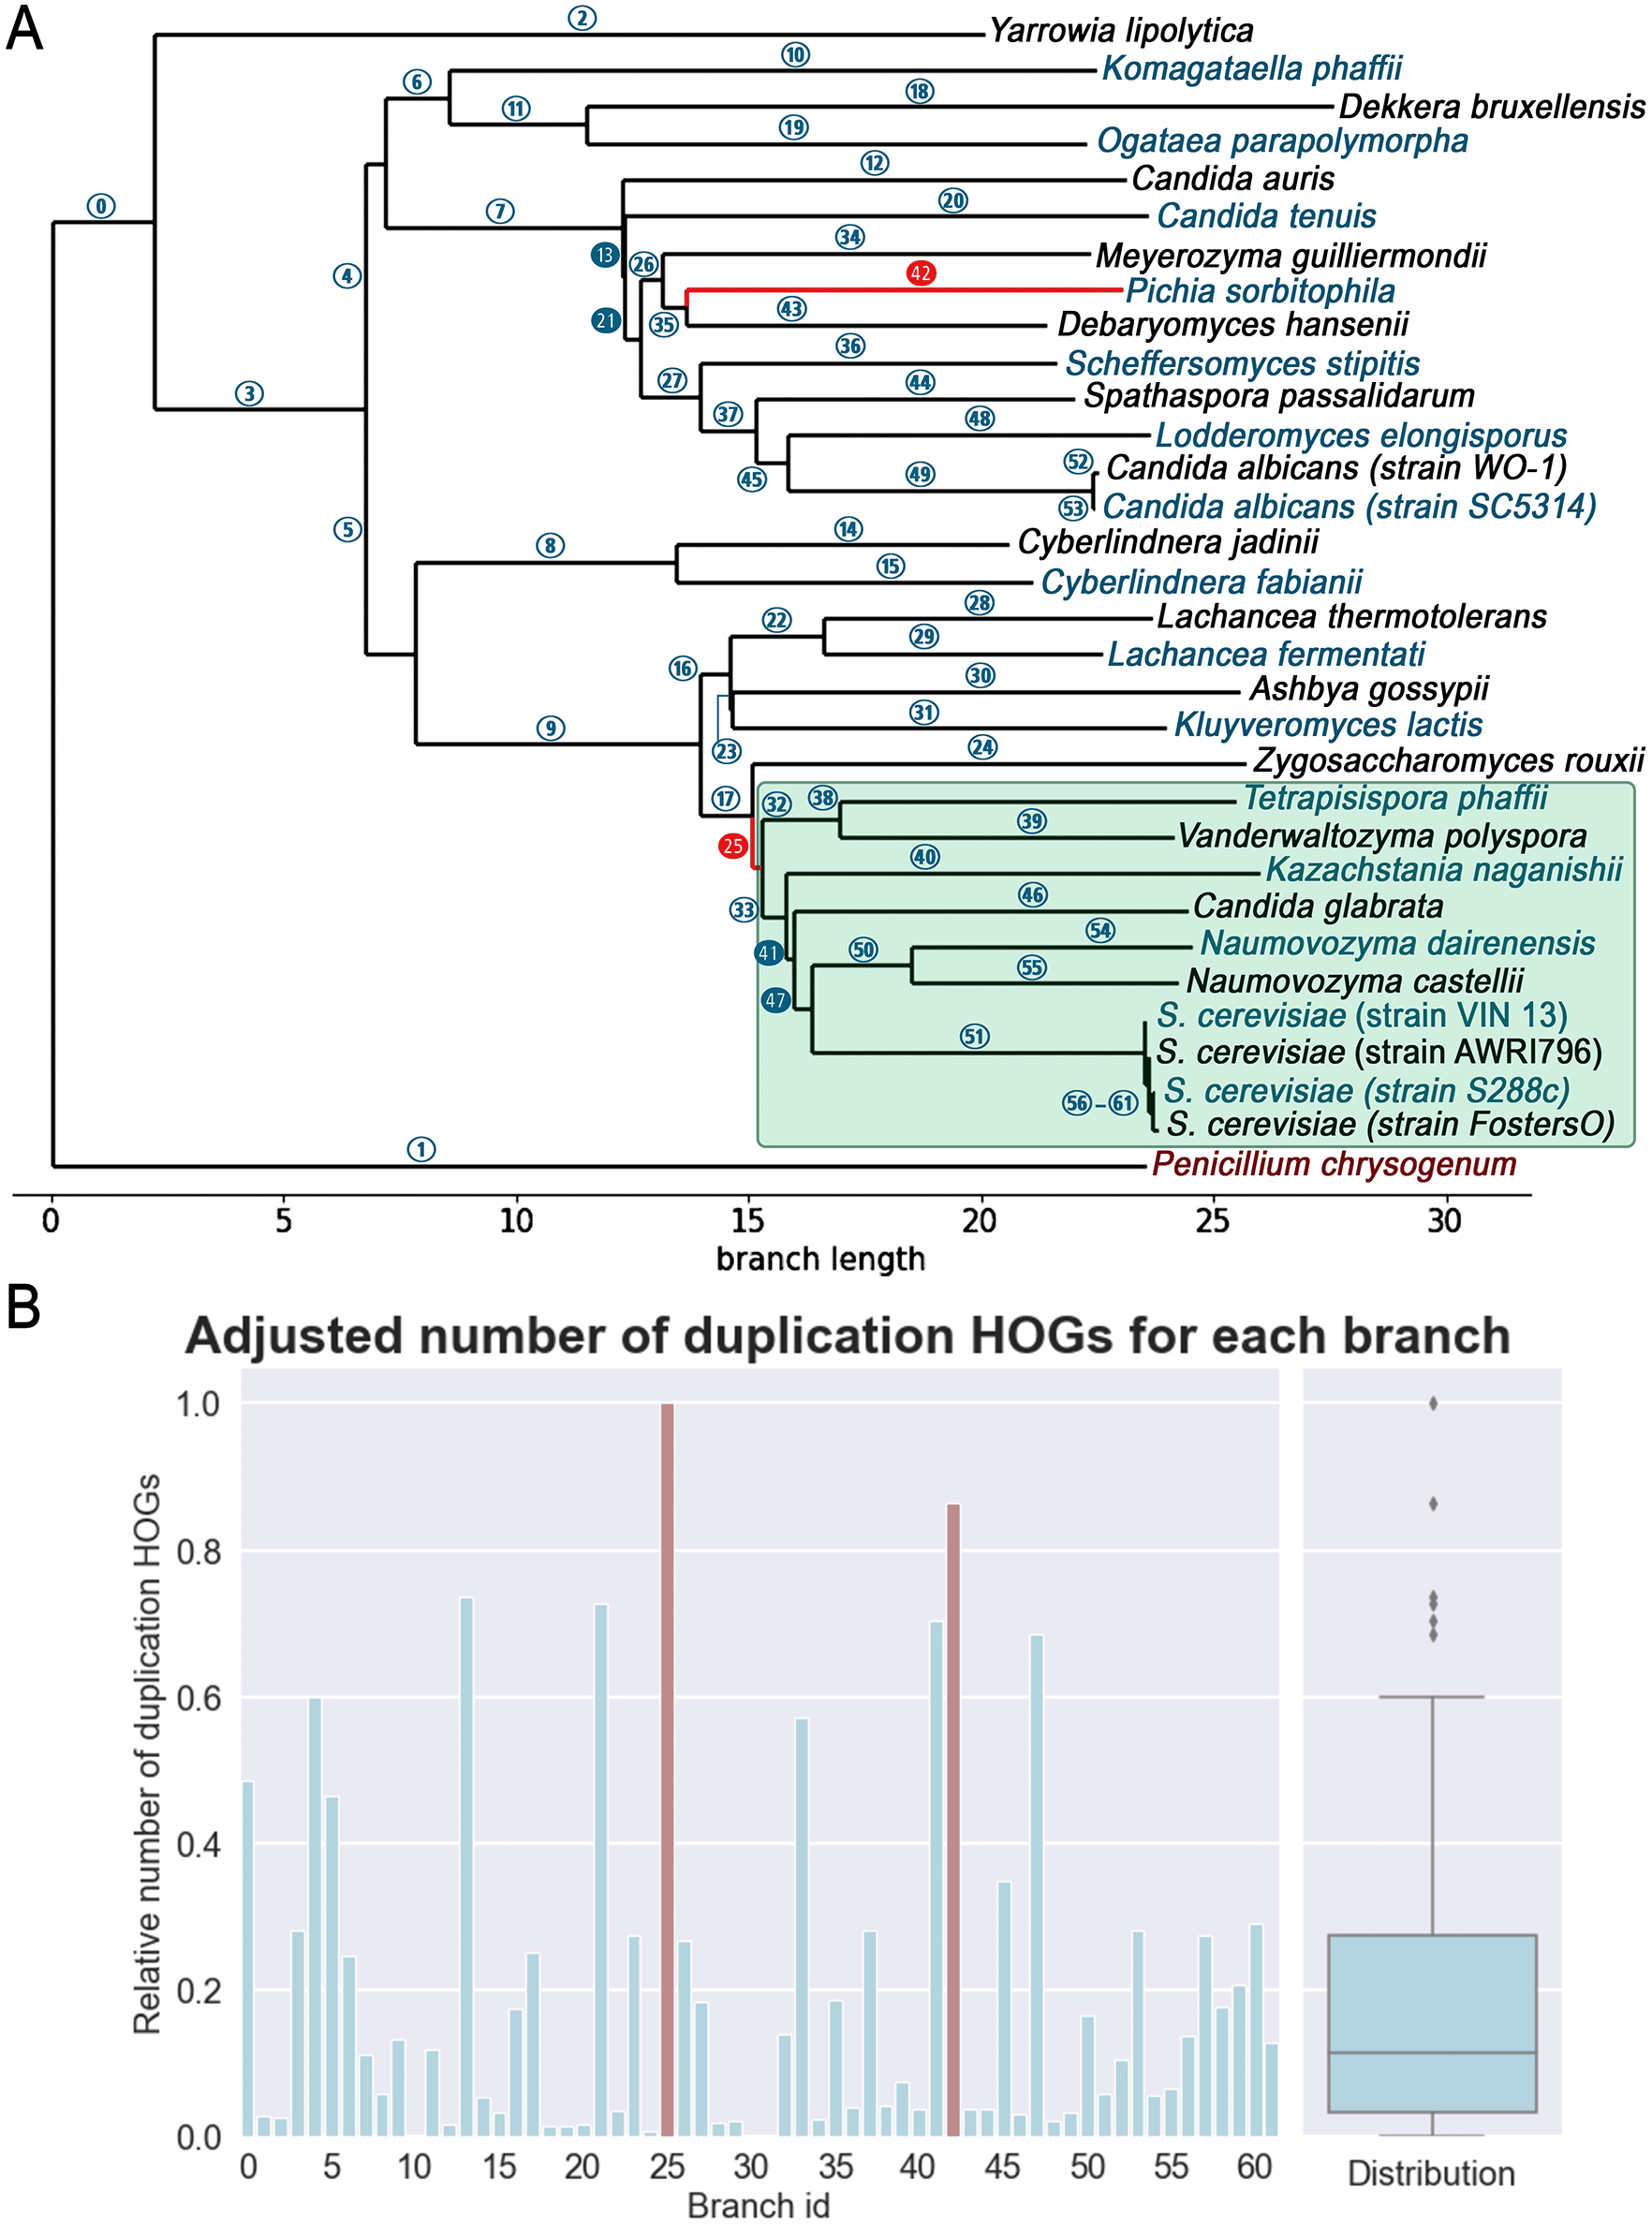
Applying the same approach on the bigger data set containing 32 species from the Saccharomycetales order resulted in two possible WGD candidates. The first corresponds to the aforementioned WGD branch with the branch id 25 (Figure 4). The second, with an adjusted number above 0.8, corresponds to the branch leading to the extant species Pichia sorbitophila with the branch id 42. Interestingly, it was shown that Pichia sorbitophila results from allopolyploidization and has a genome of about twice the size of its ancestor.27 In this data set, we can see smaller differences among adjusted HOG counts which makes it more difficult to set the threshold to distinguish WGD branches, i.e. those with the highest duplication HOGs (Figure 4).

(A) Inferred phylogenetic tree of the “large yeast” dataset. Established post-whole genome duplications (WGD) species under the light-green box. (B) Graph represents the number of duplication HOGs adjusted by the distance (branch length plus one) and the average genome size for each branch (id). On the right side, the box plot represents the distribution of these values. Keeping significant values that remain with higher pseudocounts (Figure 3C) correspond to found WGD candidates (branch id 25 and 42). Filled blue colored circles on the phylogenetic tree correspond to remaining significant values with a pseudocount of one.
Results obtained on the two yeast datasets are promising as the branch with the maximum adjusted duplication HOGs corresponds to the known WGD.
It is important to note that despite adding a pseudocount, when adjusting by evolutionary distance, small branches are still slightly more pushed upward compared to longer branches. To account for this, it is recommended to consider different pseudocounts and compare the outcomes. With the “large yeast” dataset we see various WGD candidates depending on the used pseudocount. By repeating the analysis with different pseudocounts (e.g., integers between one and 20) two branches persist: the known WGD branch but also the branch leading to P. sorbitophila which has a very large number of duplicated genes. As mentioned earlier, it was shown that this species has undergone genome duplication through allopolyploidization.28
Overall, the applied method seems to perform quite well on its own for WGD placement in the yeast lineage, assuming the user keeps a fairly stringent threshold or discriminates by applying different pseudocounts.
As the scope of this work was limited on yeast and witnessing clear results obtained on this lineage, extending the approach to find placement of WGD on plant datasets would be of great interest. This is quite challenging due to the fact that the plant dataset in the current release of OMA contains at the moment only few and relatively distanced species for many reported WGD. First of all, based on comparison, the method depends entirely on the characteristics of the species used as input. Only using species from post-WGD or opposingly, only ones that did not undergo WGD, would not lead to significant values of interest, as an average needs to be set. In such cases, results should probably not be considered on their own to place WGD events but could be combined with different approaches.
In addition, the number of input species also play an important role in setting the baseline to find abnormal duplication increases. While only a few well-selected species of the yeast lineage allowed proper WGD placement, a random selection might require a larger dataset to identify significant values. The size and variety of the set should also be considered. First, to infer ancient duplications, more extant information is needed for a better resulting ancestral reconstruction. Second, to find abnormal changes, normality needs to be defined through a sufficient amount of information and such changes might also result from different events than WGD. Moreover, in cases with multiple overlapping WGDs on the same branch, only one event could potentially be highlighted.
In the end, the proposed method indicates branches with an abnormal increase of HOGs of duplicated genes under the assumption of the molecular clock hypothesis and correct ancestral genome reconstruction. While these may not be WGD events per se, this information remains beneficial, or even sufficient on its own, to detect WGD. Like most approaches this method has its own strengths and weaknesses and should therefore be combined with other known or novel methods in order to place WGD in more complex datasets. A coherent next step would be to consider the HOG synteny of the found WGD candidates, as this information can be retrieved as a weighted network on the OMA platform and would likely improve the detection accuracy.
WGD placement, despite the many existing methods and algorithms,27 remains a complicated task and is therefore an ongoing research field. Most recently, researchers tried to apply a supervised machine learning approach based on the known detectable signatures of WGD.18 The advance of computational and biotechnologies should lead to the development of such new or improved methods to resolve remaining questions around WGD evolution. Such findings would contribute to a better understanding of the related rise of evolutionary innovations throughout history and could also be expanded to the study of WGD as macro-evolutionary event occurring in tumorigenesis.
Datasets are publicly available:
- species tree with Newick format https://omabrowser.org/All/speciestree.nwk
- precomputed all-against-all alignments can be exported from https://omabrowser.org/oma/export/
OMA standalone program available at https://omabrowser.org/standalone/
OMA browser license: Mozilla Public License 2.0
Source code for Python jupyter notebook and intermediate results for producing figures: https://github.com/cChiiper/UNIL_MLS_Master_FS_HOG_WGD_Detection
Archive source code for jupyter notebook at time of publication: https://doi.org/10.5281/zenodo.7682181
Python jupyter notebook license: Creative Commons Attribution 4.0 International license
Specifically, to manipulate data the following packages are needed:
- pandas (https://pandas.pydata.org/)
- numpy (https://numpy.org/)
For plotting the data:
- matplotlib (https://matplotlib.org/)
- seaborn (https://seaborn.pydata.org/)
| Views | Downloads | |
|---|---|---|
| F1000Research | - | - |
|
PubMed Central
Data from PMC are received and updated monthly.
|
- | - |
Is the rationale for developing the new method (or application) clearly explained?
Yes
Is the description of the method technically sound?
Partly
Are sufficient details provided to allow replication of the method development and its use by others?
Yes
If any results are presented, are all the source data underlying the results available to ensure full reproducibility?
Yes
Are the conclusions about the method and its performance adequately supported by the findings presented in the article?
Yes
References
1. Tiley GP, Ané C, Burleigh JG: Evaluating and Characterizing Ancient Whole-Genome Duplications in Plants with Gene Count Data.Genome Biol Evol. 2016; 8 (4): 1023-37 PubMed Abstract | Publisher Full TextCompeting Interests: No competing interests were disclosed.
Reviewer Expertise: Evolution of polyploid genomes
Is the rationale for developing the new method (or application) clearly explained?
Partly
Is the description of the method technically sound?
Partly
Are sufficient details provided to allow replication of the method development and its use by others?
Yes
If any results are presented, are all the source data underlying the results available to ensure full reproducibility?
Yes
Are the conclusions about the method and its performance adequately supported by the findings presented in the article?
Partly
References
1. Rabier CE, Ta T, Ané C: Detecting and locating whole genome duplications on a phylogeny: a probabilistic approach.Mol Biol Evol. 2014; 31 (3): 750-62 PubMed Abstract | Publisher Full TextCompeting Interests: No competing interests were disclosed.
Reviewer Expertise: Genome evolution
Alongside their report, reviewers assign a status to the article:
| Invited Reviewers | ||
|---|---|---|
| 1 | 2 | |
|
Version 1 12 Apr 23 |
read | read |
Provide sufficient details of any financial or non-financial competing interests to enable users to assess whether your comments might lead a reasonable person to question your impartiality. Consider the following examples, but note that this is not an exhaustive list:
Sign up for content alerts and receive a weekly or monthly email with all newly published articles
Already registered? Sign in
The email address should be the one you originally registered with F1000.
You registered with F1000 via Google, so we cannot reset your password.
To sign in, please click here.
If you still need help with your Google account password, please click here.
You registered with F1000 via Facebook, so we cannot reset your password.
To sign in, please click here.
If you still need help with your Facebook account password, please click here.
If your email address is registered with us, we will email you instructions to reset your password.
If you think you should have received this email but it has not arrived, please check your spam filters and/or contact for further assistance.
Comments on this article Comments (0)