Keywords
Predictive analytics, classifiers, Diabetes, DKA
Predictive analytics, classifiers, Diabetes, DKA
Type 1 diabetes, an autoimmune disease of insulin resistance, is predicted to affect one person per 10 individuals in the world by the year 2040.1 It was formerly known as juvenile diabetes because it is typically diagnosed during childhood. Complications with diabetes can adversely affect multiple organs such as the heart, the brain, the kidneys, eyes, and even the limbs, such as diabetic foot ulcers that can lead to foot amputations. Uncontrolled diabetes increases the risk of Alzheimer’s disease.2 One of the most serious complications of type 1 diabetes is ketoacidosis (DKA). DKA occurs when the body has high levels of sugar for a long period of time and the body then produces blood acids called ketones. Ketoacidosis can disrupt the normal body workflow which causes serious complications such as pulmonary and cerebral edema, hypokalemia and organ damages.3 DKA can cause neurocognitive impairment in children, such as memory loss, poor concentration, and/or deficits in learning and emotional connection.4 High occurrence of DKA can also increase patients’ admission to the hospital which results in higher management cost which creates an economic burden on the healthcare system.5 Machine learning is the scientific branch of artificial intelligence that focuses on how computers learn from data to define relationships between data variables through computing algorithms.6 In medicine, machine learning can be used to study diagnosis and disease patterns in large patient datasets. For example, machine learning can predict how fast a disease can develop. Also, it can predict which patients are at a higher risk of developing a condition or disease progression. These predictions can support physicians in their point of care decisions, whether it is preventive care or disease management, to provide a high level of care to these patients to improve healthcare outcomes.7 As such, machine learning can be used to flag patients with health risks and enable the healthcare team to provide the best course of treatment for their patients. In a study which used machine learning to predict the likelihood of diabetes occurrence in patients. Specifically, three classification algorithms, decision tree (DT), the support vector machine (SVM), and the naive Bayes (NB), were employed. The data used is a diabetes dataset named PIDD which is taken from the UCI machine learning repository. The data included 768 female patients with two values: 1 as positive for diabetes and 0 as negative. In addition, multiple attributes or risk factors, were included such as number of times pregnant, plasma glucose concentration, diastolic blood pressure, skinfold thickness, 2 hours serum insulin level, BMI ratio, diabetes pedigree function and age. Moreover, researchers tested the three algorithms performance evaluating precision, accuracy, F-measures and recall. The result shows NB has the highest accuracy level with 76.30% in comparison with other algorithms.8 However, the attributes included in the test did not include the known diagnostic tests such as hemoglobin (A1C) form of hemoglobin that is chemically linked to a sugar, random blood glucose, and fasting blood glucose; this requires further research using the same algorithms and models. Another study used the National Health and Nutrition Examination Survey data (NHANES) to predict patients at risk of diabetes and cardiovascular diseases.9 NHANES is a comprehensive national program in the United States to assess the status of health and nutrition among its population. Data from NHANES were used to predict diabetes and cardiovascular diseases. In the study, scientists used different models such as SVM,RF,GBT,WEM to classify patients at risk of diabetes and cardiovascular diseases, they provided the program with the training data which contained the observations and labels for the category of the observations. This can give the algorithm the ability to predict the output label associated with a new observation if presented to the program. Results showed that machine learning models based on the survey used can provide an automated identification method for patients at risk for diabetes and cardiovascular diseases and they were also able to identify major contributors to the prediction results.9 Given that this study was based on extraction of variables from a national survey rather than electronic health records data, the findings underscore the challenges of data set for machine learning as data from surveys can point to findings that are different from data extracted from electronic health records data. Additional studies aimed to create a prediction program which can detect high risk group who are more likely to develop type 2 diabetes. One in particular used the Synthetic Minority Over-sampling Technique to balance the dataset and included six features (body mass index (BMI), diet, smoking, blood pressure, sex and geographic region. The study evaluated the algorithms using the balanced data, they used nine classifiers which are, Logistic Regression (LR), Average Perceptron (AP), Naïve Bayes (NB), Neural Network (NN), Support Vector Machine (SVM), LD, Decision Jungle (DJ), Decision Forest (DF), and Boosted Decision tree (BDT). The Decision Forest (DF) model had better performance than other classifiers with an accuracy rate of 83%. The results of this study can help to establish a web-based service to assess a disease risk in preventative medical care.10 Another study, aimed to detect diabetic retinopathy where various classifiers were used such as, RF, kNN, SVM, LDA and RRF. The RF model showed the best performance among other classifiers, with an accuracy of 86%.11 Collectively, these studies underscore the potential of machine learning to be used in preventative medicine as well as in assistive decision making to improve healthcare. Table 1 summarizes the literature gap of machine learning in diabetic field.
In a project conducted in Texas children’s hospital in the United States to provide the best care for high risk patients with type 1 diabetes. The hospital developed a model using machine learning classifiers, which can predict the occurrence of DKA. The project aimed to reduce the number of hospitalizations related to diabetes or DKA from 9.5% to 5% by the year 2018 and to reduce the admissions of DKA by at least 1% every year to reach a goal of maximum 5% DKA admissions per year. A predicting risk model for DKA was developed. The model used data such as risk index for poor glycemic control (RIPGC), socioeconomic status, clinical data such as fasting blood glucose level, hemoglobin A1C, and number of clinical visits per year. The team then proceeded with developing a risk stratification tool and divided patients into four tiers; high risk, moderate risk, mild risk, and lowest risk. They then provided care according to their risk prediction model. This targeted approach resulted in decreasing the recurrent DKA cases admission by 30.9% per year and it showed higher documentation rate of RIPGC in the electronic system. In addition to a risk index for DKA for all the patients.12
In this study we used machine learning as a tool to predict DKA occurrence among a pediatric population and identify the most important factors in predicting DKA.
This research was ethically reviewed and approved by the institutional review board at Imam Abdulrahman bin Faisal University (IRB-PGS-2020-03-431). It was also approved by the institutional review board at King Fahad Medical city. (IRB Log Number: 21-186E) This study is an experimental study aimed to create a predicting model for diabetic ketoacidosis among pediatrics cases and find the most important factors predicting diabetic ketoacidosis. The target variable is the DKA and the attributes are sex, age, HbA1c levels, number of patient appointments in the diabetic clinic, number of patient appointments in the health education clinic, and the number of patients those who do not attend appointments at the health education clinic. The dataset included the medical records of pediatric patients aged 18 and younger who attended the Diabetic clinic in King Fahad medical city from starting January 2018 to until December 2020. We excluded any patients who were above 18 at the time of data collection and patients who did not have any laboratory results registered in the system. The total sample size was 1537 patients.
The dataset was received in excel format from King Fahad Medical City health information system in Riyadh, Saudi Arabia. It was divided into four sections. The first section was the list of appointments in the pediatric Diabetes clinic, which also included whether the patient attended the appointment or was registered as a no-show, and the demographics (e.g., nationality, sex). The first section data size was 3737. The second section was the laboratory results of the patients, which contained their Hemoglobin A1c levels. The third section was the list of patients who were diagnosed with DKA. The fourth section is the list of patients’ ages. All patient identifications have been removed to ensure patients privacy and confidentiality. We created a new spreadsheet to consolidate this information. It included the lab results where duplicated Medical record number (MRN) numbers were removed using the remove duplicates function in excel. We used the VLOOKUP function which looks up a value in the columns of a table and returns the value in the same row from a column which the user specifies. Using the patient’s MRN, we matched the patients’ age, sex and DKA diagnosis to their laboratory results and the data size was reduced to 1543 data records. we used the COUNTIFS function in excel, which counts the number of cells specified by a given set of conditions or criteria, to count the number of appointment visits versus no shows. The variables assessed included sex, age, HbA1c level, number of appointments, number of health education clinic appointment and number of no shows to health education clinic appointment The target variable was DKA status with two values of yes and no.
To analyze the data we used Orange Data Mining (RRID:SCR_019811) V3.30. Orange is an open source software which is used for data visualization, machine learning and data mining purposes. There are different classifiers available in Orange, which include: Random Forest, which creates a set of decision trees. Every tree is created from a small sample from the training data. When the classifier develops an individual tree, a random subset of attributes is drawn then the best attribute is selected. The final model is based on the majority selected individual developed trees in the forest. KNN, which uses algorithms to search for the closest training examples in a feature and uses the average to form the prediction. AdaBoost, is an algorithm that merges weak learners and adapts to each training sample. CN2 rule inducer uses an algorithm as a classification technique through making of simple, comprehensible rules.13 Tree simply uses an algorithm to separate the data into nodes. It is similar to Random Forest. Gradient Boosting is a technique that produces a prediction model in the form of an joined of weak prediction models, typically decision trees.
To analyze descriptive statistics for the variables, we used a feature statistics tool in Orange, also ranked the attributes to demonstrate the most contributing factor to DKA among pediatric patients.
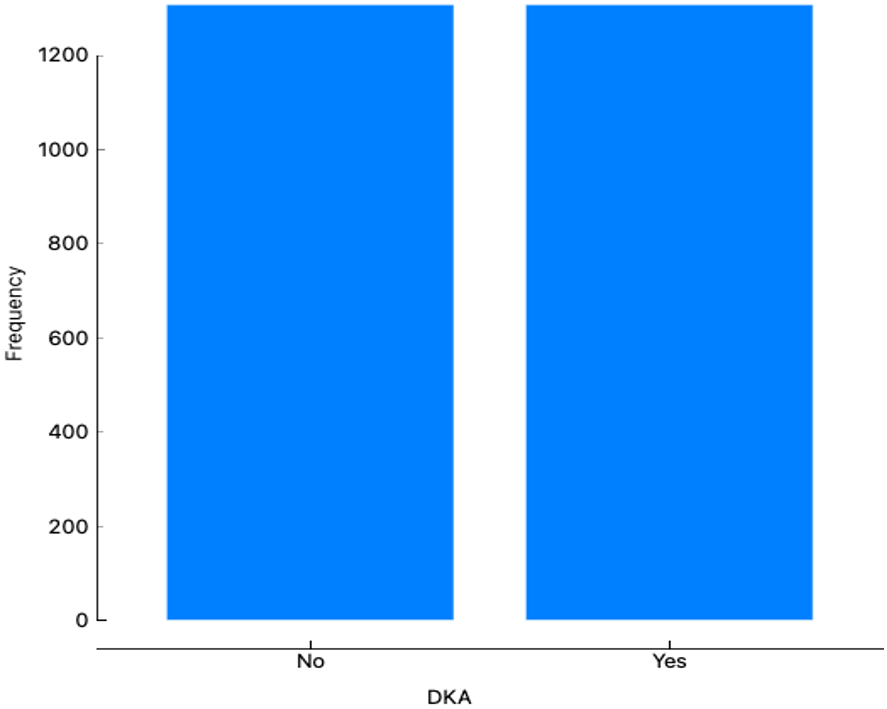
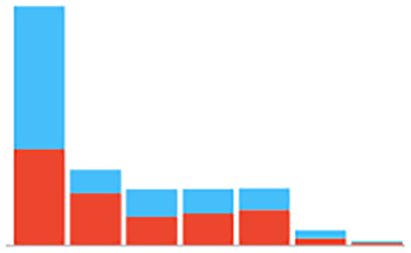
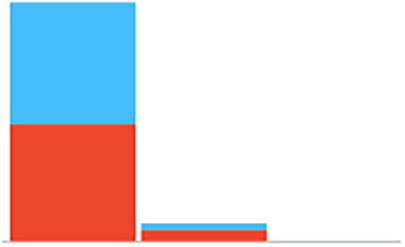
dataset showed an imbalance among DKA cases (17.5%) and none DKA (82.5%). To balance the data set, a data sampler tool in Orange V3.30 was used. This tool is used to develop different types of complementary samples from the input data. The fixed sample size method develops a certain number of data instances with replacements, which means always sampling from the entire dataset and does not delete instances from the subset data. We also maintained the sampling pattern by checking replicable sampling settings in the data sampler. This technique to oversample the DKA instances. The positive DKA instances were replicated by 1308 to equalize it with the negative 1308 DKA instances and overcome the data imbalance. Furthermore, Python was used to oversample the data as a comparison method with the data sampler in Orange. The oversampling technique has been used in research which aimed to evaluate the performance of supervised learning algorithms on imbalanced class datasets.14
We used stratified 5-folds to cross validate our data which is the default parameters in Orange. This technique splits the dataset into folds such as N. One-fold will be used for testing while the remaining N-1 will be used for training in each N iterations. In the current study the dataset is divided into 5 stratified folds and in each fold there are approximately equal number of samples for each class.
This matrix shows the number and proportion of instances in the predicted and actual class. This allows the reporting of cases that were misclassified or were accurately classified.
Is model performance evaluation technique that indicate the ability of the classifier to distinguish between classes. The higher the AUC score, the better performance for the classifier to distinguish between true positives and true negatives.
Is a measure to evaluate the performance of a classifier by calculating the number of correct predictions divided by the total number of predictions.
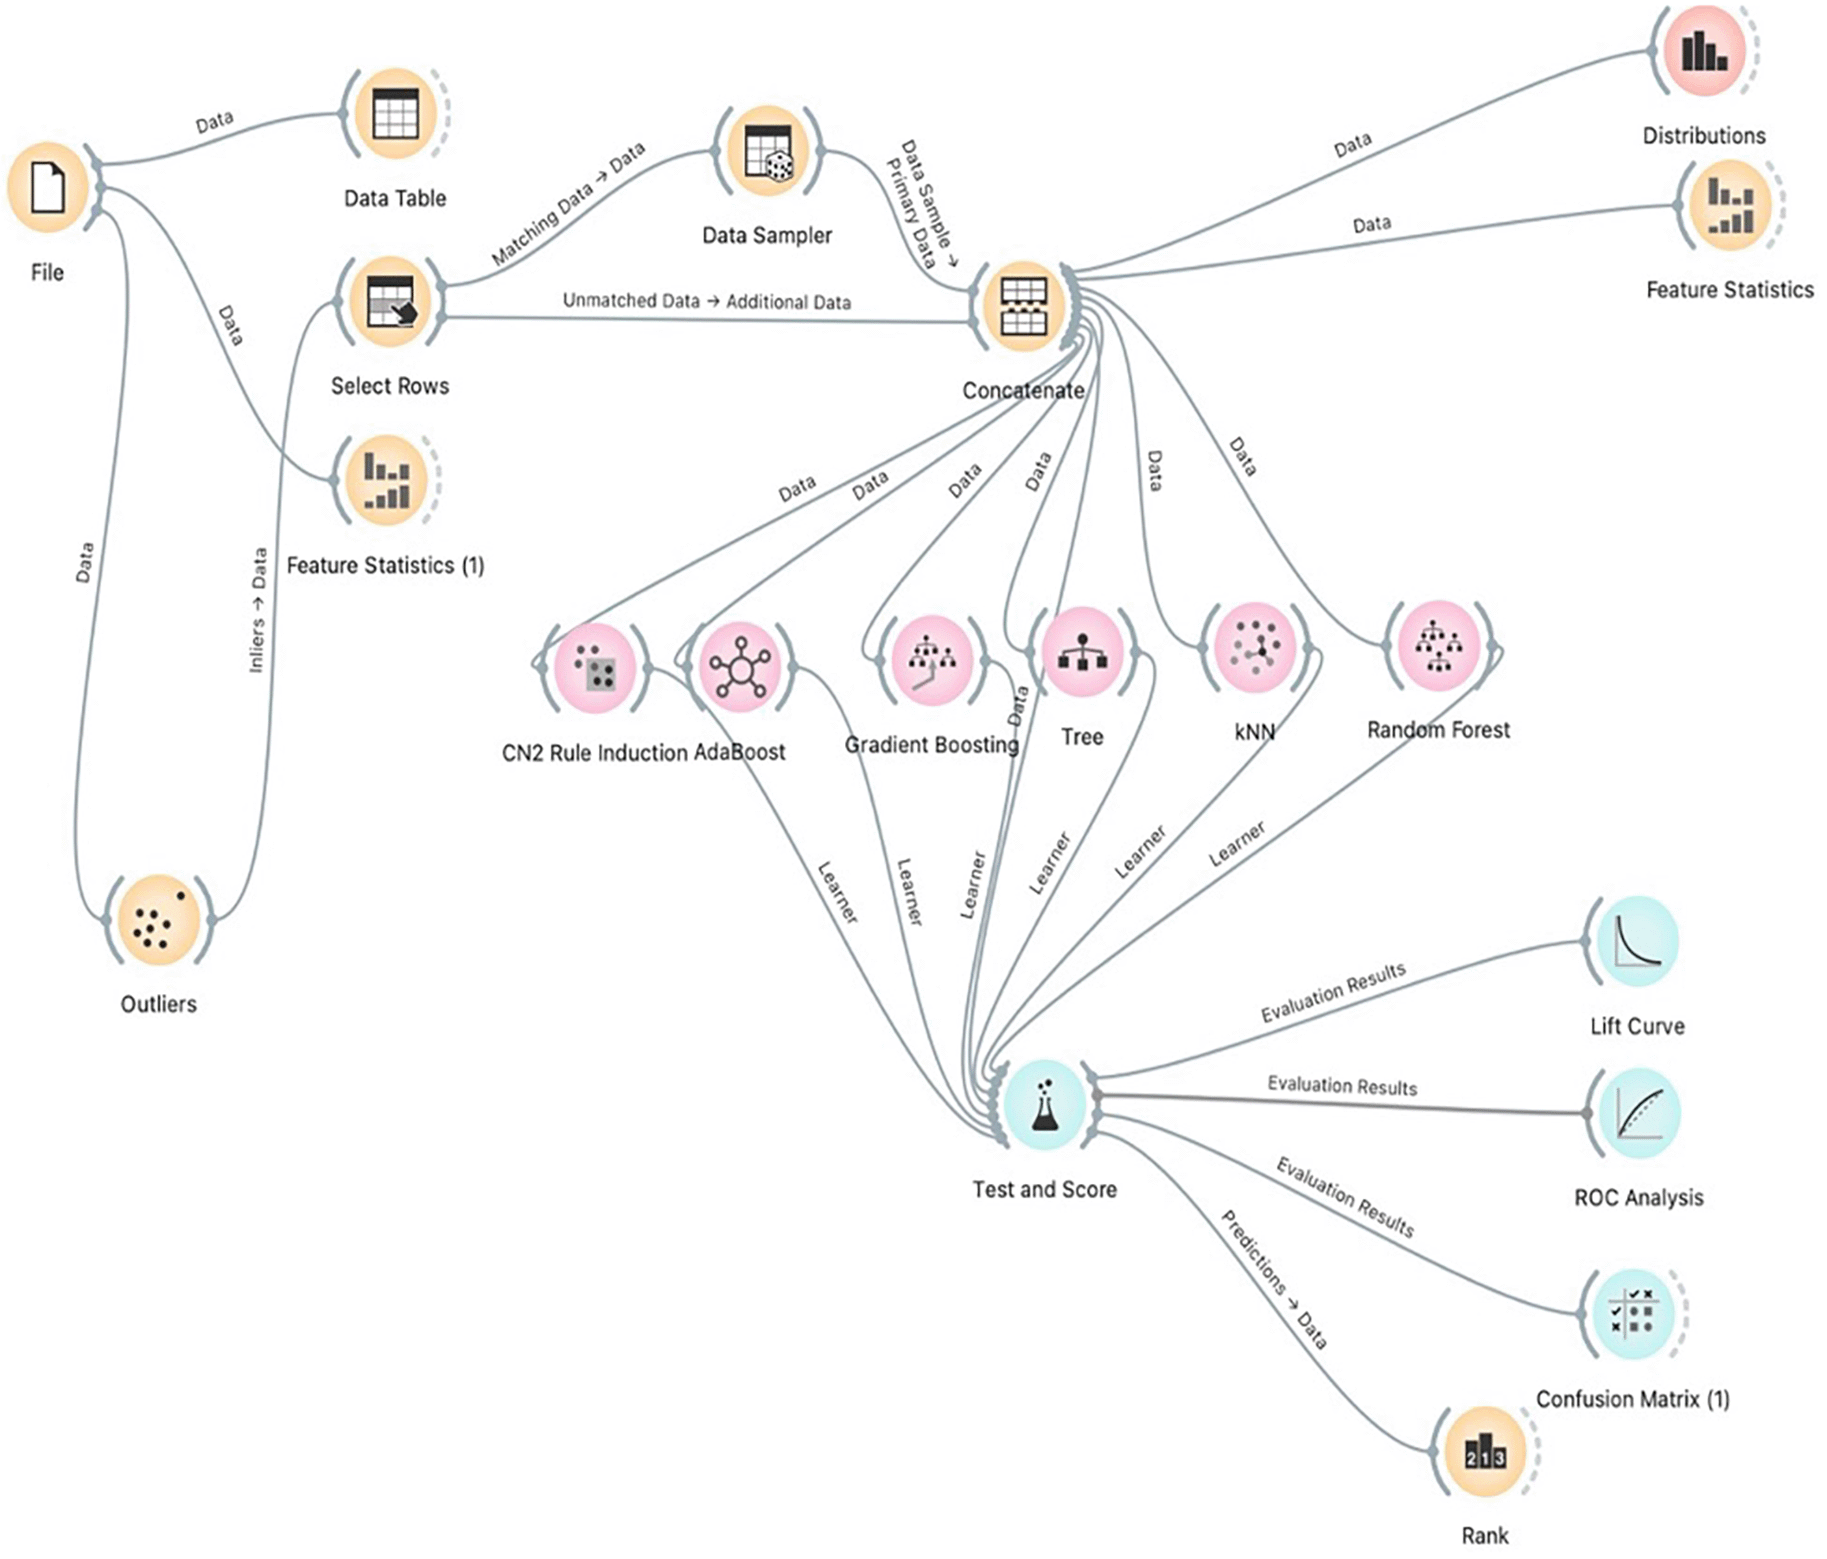
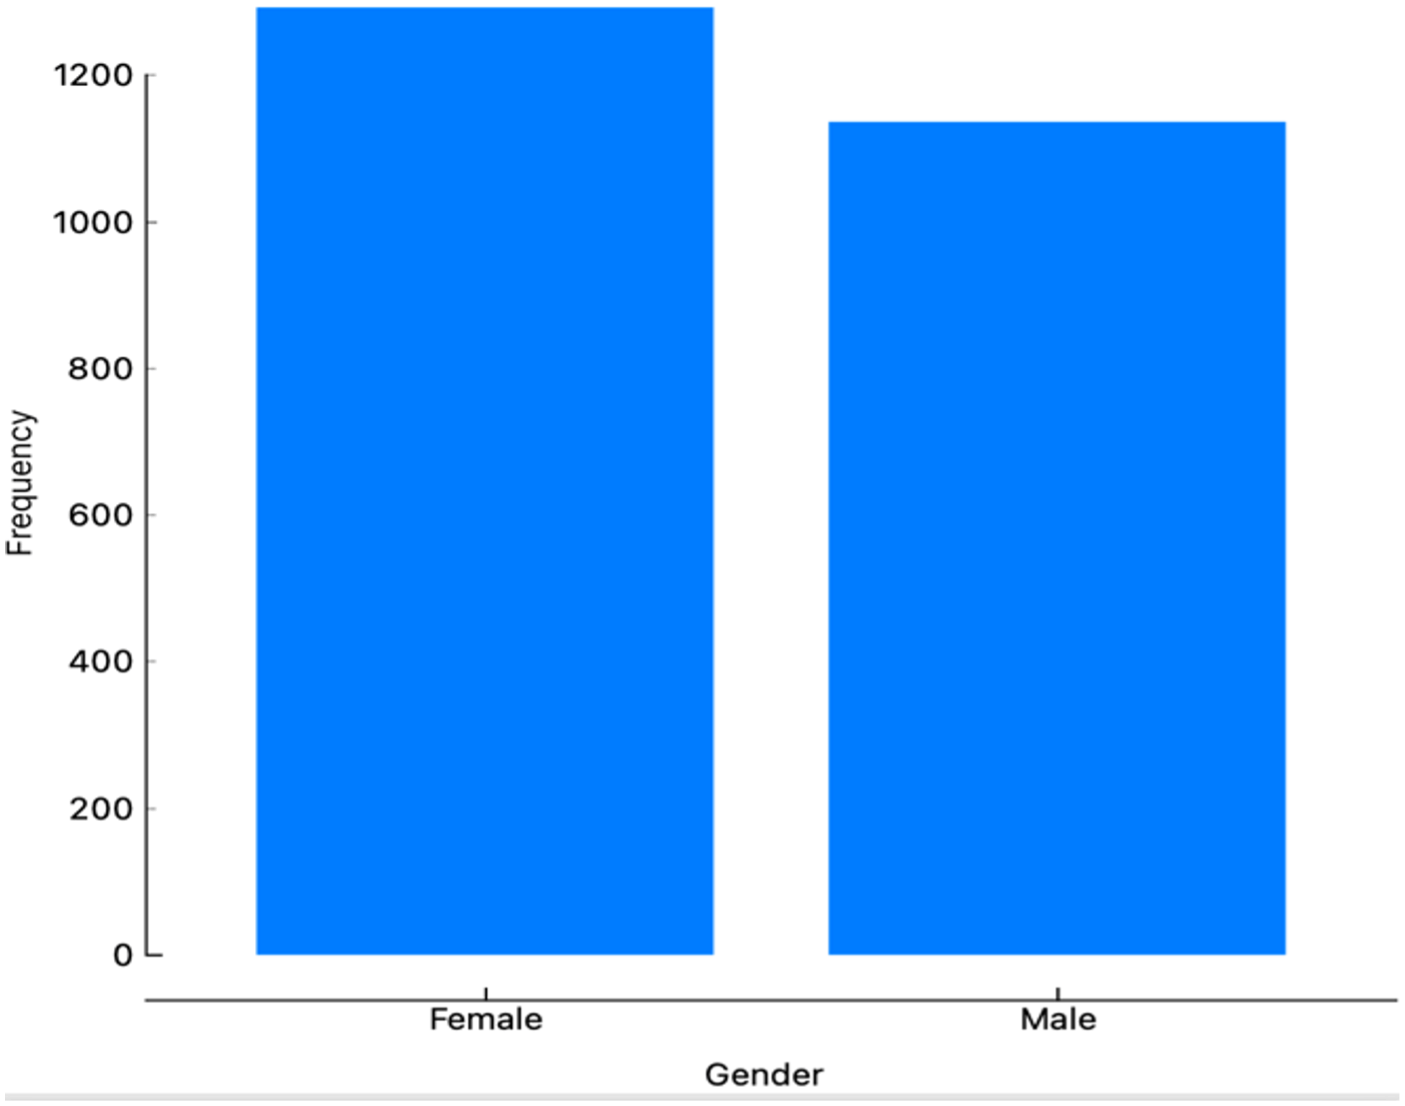
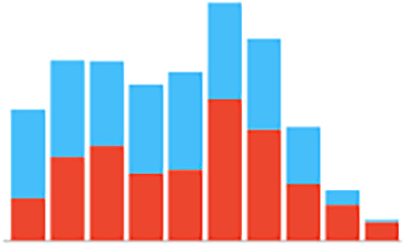
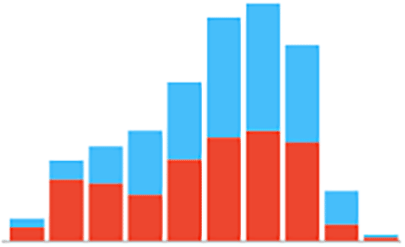
Several Orange classifiers were used to predict the incidences of DKA among a pediatric cohort. Figure 1 illustrates the workflow performed in Orange. The workflow begins with imported data followed by outlier’s extraction. After the extraction, we balanced the data using the data sampler widget. The data is inserted into the six classifiers and evaluated by Area under the curve (AUC) level (test and score widget). A total of 1536 patient data points were imported into the program. Data showed an 82% imbalance. To overcome this imbalance, a data sampler tool in the Orange program was used. Moreover, Python was additionally used as another oversampling technique which showed similar performance results to the Orange data sampler tool with the Random Forest being the best predicting model with an AUC higher than 0.9. Female and male distribution are approximately equal as shown in Table 2 and Figure 2. Incidences of DKA distribution were normalized after applying the over sampling technique as shown in Figure 3. For age, the youngest patient was 2 years old and the oldest was 18 years old with a mean of 12 years old. For the HbA1c the maximum level was 16.3 and the minimum was 4 with a mean of 9.99 as shown in Table 2. To test the prediction performance on our data, we used six classifiers which are Random Forest, AdaBoost, CN2 rule inducer, kNN, Gradient Boosting and Decision Tree. Through the test and score feature we evaluated the classifiers prediction performance through cross validation technique and the AUC score as it is a highly reliable method to evaluate the performance. The result showed that Random Forest had the highest performance result with an AUC score of 0.98 followed by AdaBoost and CN2 rule inducer with a score of 0.97 and 0.93, respectively As shown in Table 3. The confusion matrix for the performance of the Random Forest classifiers is shown in Table 4. The Random Forest classifier made 86.5 % (n=885) correct predictions, 27.16 % (n=33) false prediction for the no incidence of DKA and 88.6% (n=1077) correct prediction and 11.35 (n=138) false prediction for the incidence of DKA. Additionally, the HbA1c level was the most contributing attribute to the occurrence of DKA followed by the health education appointments as shown in Table 5. Furthermore, sex was the least contributing attribute (Table 5).
| Actual | Predicted | ||
|---|---|---|---|
| No | Yes | ∑ | |
| No | 885 | 330 | 1215 |
| Yes | 138 | 1077 | 1215 |
| ∑ | 1023 | 1407 | 2430 |
Recurrent admission of patients due to DKA can be prevented with proper education and targeted strategic programs.15,16 In this research, we focused on developing a prediction model which can detect high risk groups for DKA to decrease admission cost to the healthcare organization and prevent the readmission of patients. These predictions can inform better patient quality of life and help to develop better education programs for these patients. Our data showed an 82% imbalance. To overcome this imbalance, a data sampler tool in the Orange program was used. This program is used as a tool to oversample the DKA incidence and replicate the positive DKA instances to equalize it with the non DKA incidence. Moreover, Python was additionally used as another oversampling technique which showed similar performance results to the Orange data sampler tool with the Random Forest being the best predicting model with an AUC higher than 0.9. The ability of different machine learning prediction models to predict DKA incidence using data imported from the electronic medical records. We found that the HbA1c level was the most contributing attribute to the occurrence of DKA followed by the health education appointments. Although six attributes were used in this research, other similar studies have used other clinical attributes such as the fasting blood glucose, HbA1c, vital signs, injection therapy vs pump therapy. It also included sex, race and ethnicity, BMI, healthy diet, smoking status.10,17 However, not all of these attributes can be found in the electronic medical records such as race and ethnicity, smoking status, healthy diet in our study. Our data is consistent with others.8–11 Similar research has been conducted previously which explored similar models and their performances on predicting DKA. All demonstrated an AUC level of 0.7 and higher.10,17,18 On the other hand, the highest AUC level scored in the current was by the Random Forest model with a score of 0.97 followed by AdaBoost and CN2 rule inducer with a score of 0.95 and 0.92 respectively. Lastly, although this research showed promising results in the prediction performance, it had some limitations which could be improved in future studies. To refine the prediction model additional clinical attributes should be included such as the fasting blood glucose, BMI, and medication adherence and type of treatment.
DKA is considered to be a serious complication of diabetes which can be prevented with proper education and targeted strategic health care delivery. We aimed to create a predicting model for diabetic ketoacidosis among pediatric cases. Therefore, a real dataset was collected from Fahad Medical City health information system in Riyadh, Saudi Arabia. Several machine learning models have been used such as Random Forest (RF), Decision Tree (DT), kNN, Gradient Boosting (GB), CN2 rule inducer and AdaBoost. Furthermore, several preprocessing and data sampling techniques were applied. We found Random Forest model achieved the highest performance with the AUC of 0.98. Furthermore, HbA1c was the most contributing factor to the prediction model. Further research is required to refine the prediction model with additional clinical attributes such as the fasting blood glucose, BMI, medication adherence and type of treatment. Moreover, it is required to test the model’s performance with the multi-center balanced patient’s sample.
Waad Eid: conception and design of the paper and data analysis
Hana Alharthi: conception and design of the paper, data analysis, critical and final revision of the article
Nida Aslam: Data analysis and model framework.
Irfan Ullah Abdur rab: Data analysis and model framework.
Alaa Madani: acquisition of data.
| Views | Downloads | |
|---|---|---|
| F1000Research | - | - |
|
PubMed Central
Data from PMC are received and updated monthly.
|
- | - |
Provide sufficient details of any financial or non-financial competing interests to enable users to assess whether your comments might lead a reasonable person to question your impartiality. Consider the following examples, but note that this is not an exhaustive list:
Sign up for content alerts and receive a weekly or monthly email with all newly published articles
Already registered? Sign in
The email address should be the one you originally registered with F1000.
You registered with F1000 via Google, so we cannot reset your password.
To sign in, please click here.
If you still need help with your Google account password, please click here.
You registered with F1000 via Facebook, so we cannot reset your password.
To sign in, please click here.
If you still need help with your Facebook account password, please click here.
If your email address is registered with us, we will email you instructions to reset your password.
If you think you should have received this email but it has not arrived, please check your spam filters and/or contact for further assistance.

Comments on this article Comments (0)