Keywords
Web system, dashboard, SIG, Datamart, Looker Studio.
This article is included in the Software and Hardware Engineering gateway.
Nowadays, companies face continuous changes, which force them to be more versatile by managing large volumes of data, which do not always become relevant information for decision making. Therefore, the objective of this research is to implement a management information system to improve administrative management in micro and small businesses.
it was developed under the approach of the agile methodology “SCRUM” following its 5 phases; In addition, the visual basic programming language in ASP.NET was used for the development of the source code and Microsoft SQL Server 2019 and its extensions: Ma-nagement Studio for data processing, “Integration Services” for the migration to the new dimensional model, Reporting Services for reports and Looker Studio for dashboards.
The implementation of a management information system based on a dashboard allowed managers to obtain relevant information quickly and easily, optimizing decision-making times. In addition, the system allowed for homogeneous comparisons by level, which made it easier to identify deviations in commercial goals and the implementation of corrective actions such as adjustments in goals, changes in productivity, among others. Another result was the visualization of the monthly behavior of the financial system, which helped management structure short, medium and long-term strategies; in addition to the export of reports for “offline” analysis, which facilitates the work of employees in the field.
This allows reducing the time invested in generating reports, improving the efficiency and precision of the analysis. In addition, it has facilitated the identification of opportunities for improvement in administrative and commercial management, specifically in average productivity and the weighted average rate per advisor.
Web system, dashboard, SIG, Datamart, Looker Studio.
Currently, companies face continuous changes, which force them to be versatile, to reinvent themselves and to manage large volumes of data that are not always relevant information for decision making; This is when micro and small companies in the financial sector find themselves at a point where the interpretation, analysis and application of information is essential to keep up with the competitive and globalized world.1 In this context, the technological tools that emerge every day help in everyday processes, allowing the integration, optimization and automation of processes to meet the objectives of organizations, generating significant changes and benefits.2 One of these tools is Management Information Systems, which in recent years have been the subject of much research to apply them in various fields, being considered a powerful option to create competitive advantages, increase organizational capacity in the face of change, reduce time in making decisions and obtaining accurate information.3
In previous times, micro and small companies in the microfinance sector managed their data on paper, an overwhelming situation for the documentary staff who had to generate reports, which is why companies found themselves in the need to systematize the processes.4 Management information systems provide advantages to obtain valuable, reliable, updated information, and can be applied in different functional areas of the organization.5 In addition, it allows improving information control, provides support for operational processes, and makes correct decisions in any area in which they operate.6
In this sense, this management information system is an interesting proposal to improve administrative management, since it consists of recording data more efficiently, minimizing errors, saving time on manual work, reducing costs, and resolving customer queries faster.3 In addition, GIS allows the generation of reports automatically with relevant information, informing in a summarized and graphical way the current situation of the organization, obtaining a decision source that allows implementing strategies to lead the market.7
The implementation of a management information system is an important tool in the business world, and it has a positive impact on information analysis and decision making.8 However, there is a sector that still does not use this tool due to lack of knowledge about how to develop them and how to take advantage of their benefits, either at the enterprise level or in the cloud.9 It is likely that research is needed to explore the impact of this tool on administrative management and decision-making at the level of micro and small businesses, focusing on rural and municipal savings banks.10
This research aims to explore and publicize the impact of implementing a management information system as a strategic tool to improve administrative management and enhance decision making in MYPES11; quickly and efficiently managing the large volume of information generated by companies, reducing time when providing relevant and reliable information to make decisions, leading to multiple analyzes and reports with the information obtained, even reducing costs in labor or paperwork.12 Therefore, the objective of this research is to implement a management information system to improve administrative management in a rural bank, such is the case of the savings and credit company “Los Andes SAC” based in Lima.
The contribution of this research when implementing a management information system is to improve administrative management, minimizing errors due to manual work, automating the registration of information, reducing time when generating reports and analyzing accurate information for decision making.13 In addition, it contributes to innovation since it plays a key role when introducing and promoting new technologies, allowing resources to be used efficiently.14
If we relate other research with the same topic that we are presenting, with the purpose of analyzing and comparing; We find the following study15 where it determines that the Jardín Azuayo Savings and Credit Cooperative lacks relevant information for making business decisions, which is why it proposes the development of a management information system based on the definition of key performance indicators, with the It makes up for the absence of information and helps generate knowledge. On the other hand, we have another investigation16 that seeks to solve the lack of truthful and quality information in the Portoviejo savings and credit cooperative, specifying that this is the indispensable basis in decision-making when granting loans, for This proposes the development of a web data management system that guarantees the integrity, accuracy and relevance of the information. Finally, in this research17 they seek to solve the lack of control in administrative management in the Savings and Credit Cooperative “Por el Pan y el Agua” through the implementation of a web application for the internal management of the cooperative, this application manages to control the administration, organization and availability of information efficiently and effectively.
In this section, we detail the methods used in the development and operation of our software; which has been designed to enhance decision-making in micro and small businesses.
Basic programming language in ASP was used .NET for source code development and Microsoft SQL Server 2019 and its extensions: Management Studio for data processing, Integration Services for migration to the new dimensional model, Reporting Services for reports and Looker Studio for dashboards.
We worked with the agile SCRUM methodology, following the 5 phases into which this methodology is divided.18
2.2.1 Home
In this phase, the vision statement of the system was made, explaining the need of the company and the objective of the project. Also, the charter was drawn up, which contains a statement of the objectives and expected results. Additionally, the collaboration plan and roles were drafted, detailing the people participating in the research; The epics, the description of the users involved, the risks and completion criteria were written (Figure 1).

2.2.2 Planning and estimation
In this phase, the user stories, lists of requirements (Product Backlog), the stacks of the 4 sprints were created where the requirements that the team will develop and the project planning were recorded (Figure 2).

This is the stage in which we translate the core of the business and transfer it to the system so that they respond according to the needs of the organization. If something is not well defined, we could be developing something that is not needed and that will not be used, which is why it is important going through several reviews, prototyping and requesting all conformities from the areas involved.
2.2.3 Sprint implementation
In this phase, the initiation minutes for each phase, pending list and sprint planning, database design, dashboard design, prototype implementation and obtaining the final dashboard were developed.
In the case of the database, a star-type dimensional model has been chosen where gt_saldos represents the fact or Fact table (A) and the tables with initials “ge_” (B) represent the dimensions (Figure 3A).
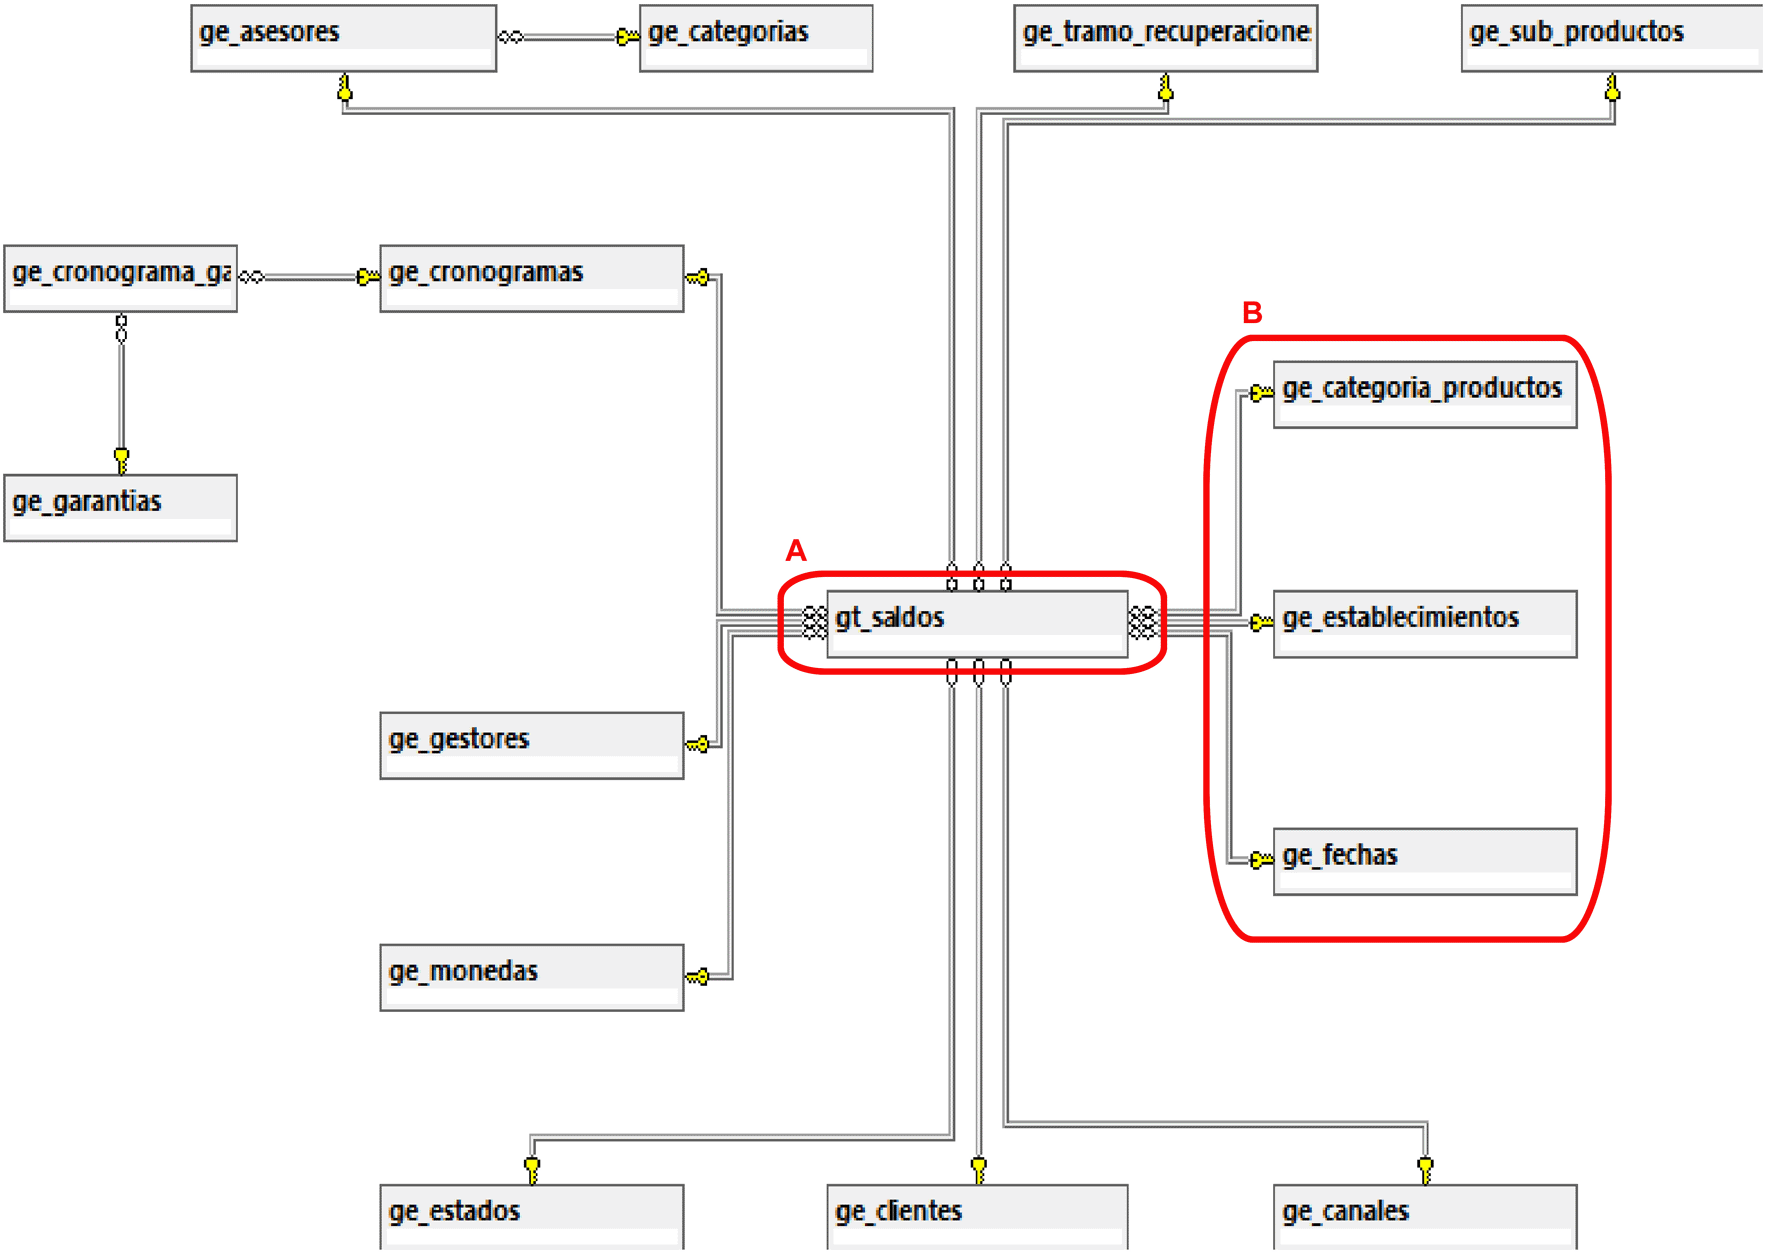
We identify which is the main table “A” and highlight 3 of the main dimensions as an example “B”.
2.2.4 Review and retrospective
burndown chart was made for each sprint (Figure 4).

2.2.5 Launch
In this phase, the deliverables and closing minutes of each phase were sent (Figure 5).
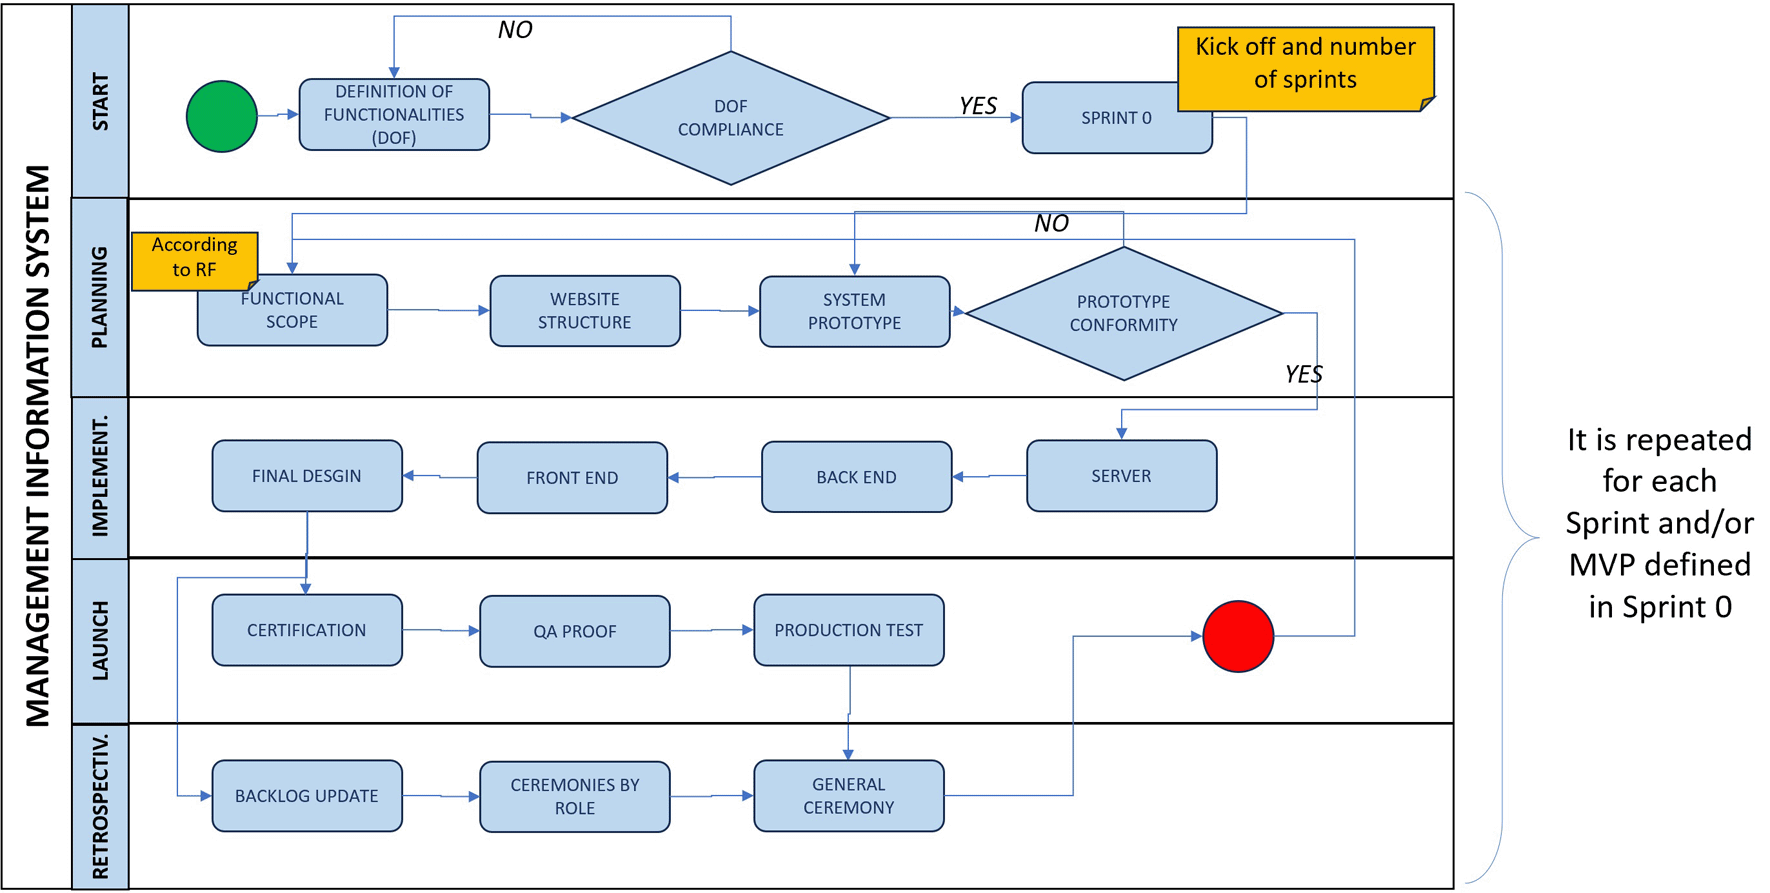
This computer tool has characteristics that differentiate it from existing solutions:
• Focused on the microfinance system: our software is designed specifically for micro and small companies in the financial sector, adapting to specific requirements to improve decision making in administrative management, adapting to their workflows.
• Tailored customization: users can easily customize the reports they really need to access, allowing queries, filters at the row and column level, showing detailed information to obtain reports adapted to the needs of companies, which makes it in a versatile solution.
By explaining the method and unique features, we provide a clear model for the development and implementation of our IT tool in microfinance institutions, promoting its replicability and usefulness.
In this section, we present the results of the learning outcome scores, the understanding aspect, and the user experience aspect.
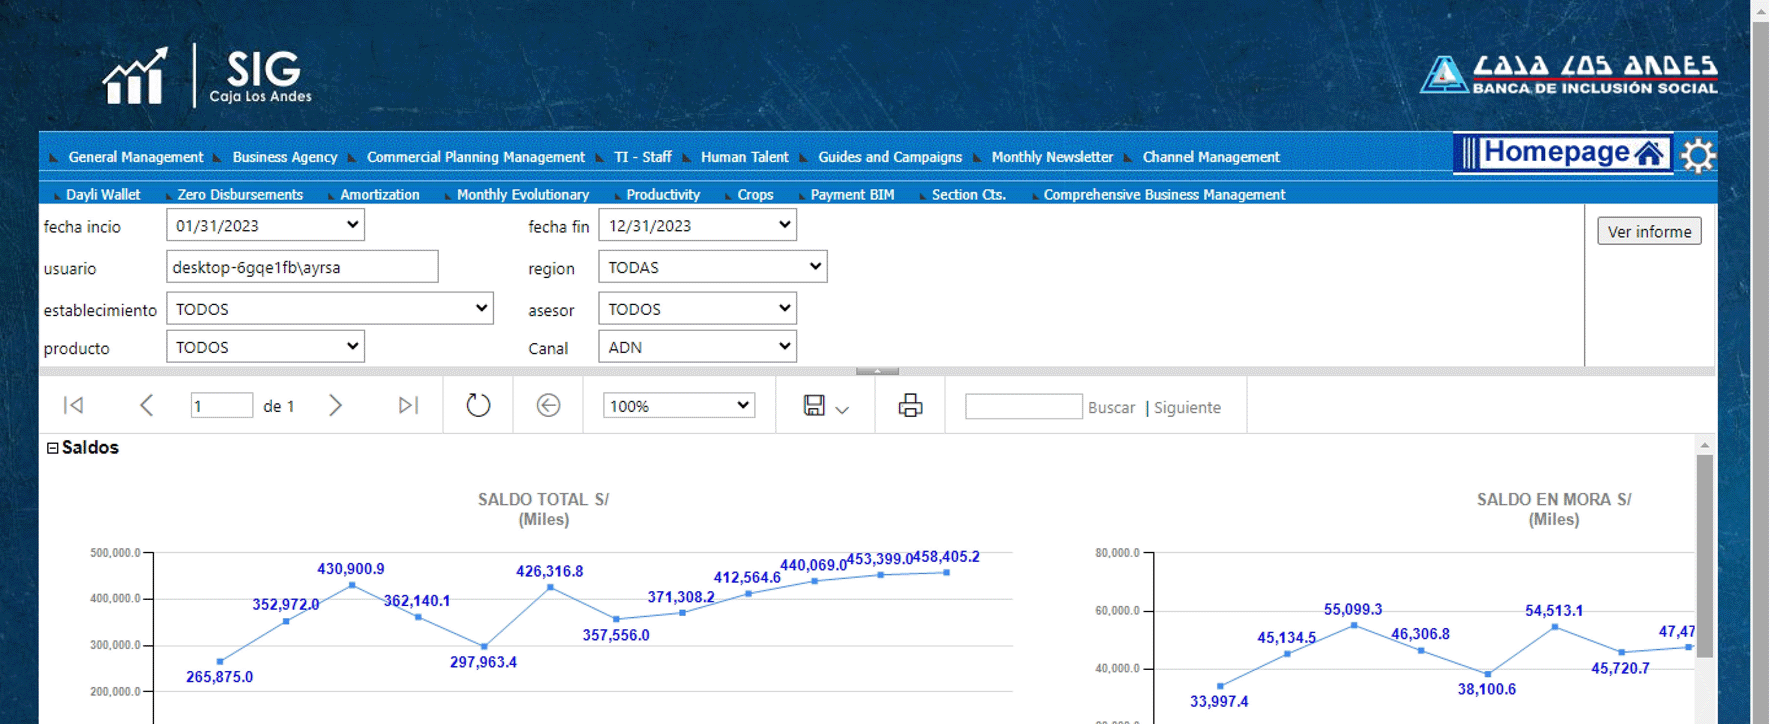
Figure 6 shows the main menu interface that was built in Looker Studio, which is a tool that turns your data into clear reports and dashboards.19 In this interface you can view the portfolio stock on the day of consultation and the variations in placements (credits) and deposits (savings). Additionally, a line graph is included that represents the trend of these indicators in the last twelve months. The general menu always remains visible showing the divisions that make up the company and in each division the relevant reports for each of them have been grouped; It is worth mentioning that this dashboard may vary in content and design according to the requirements of each division.
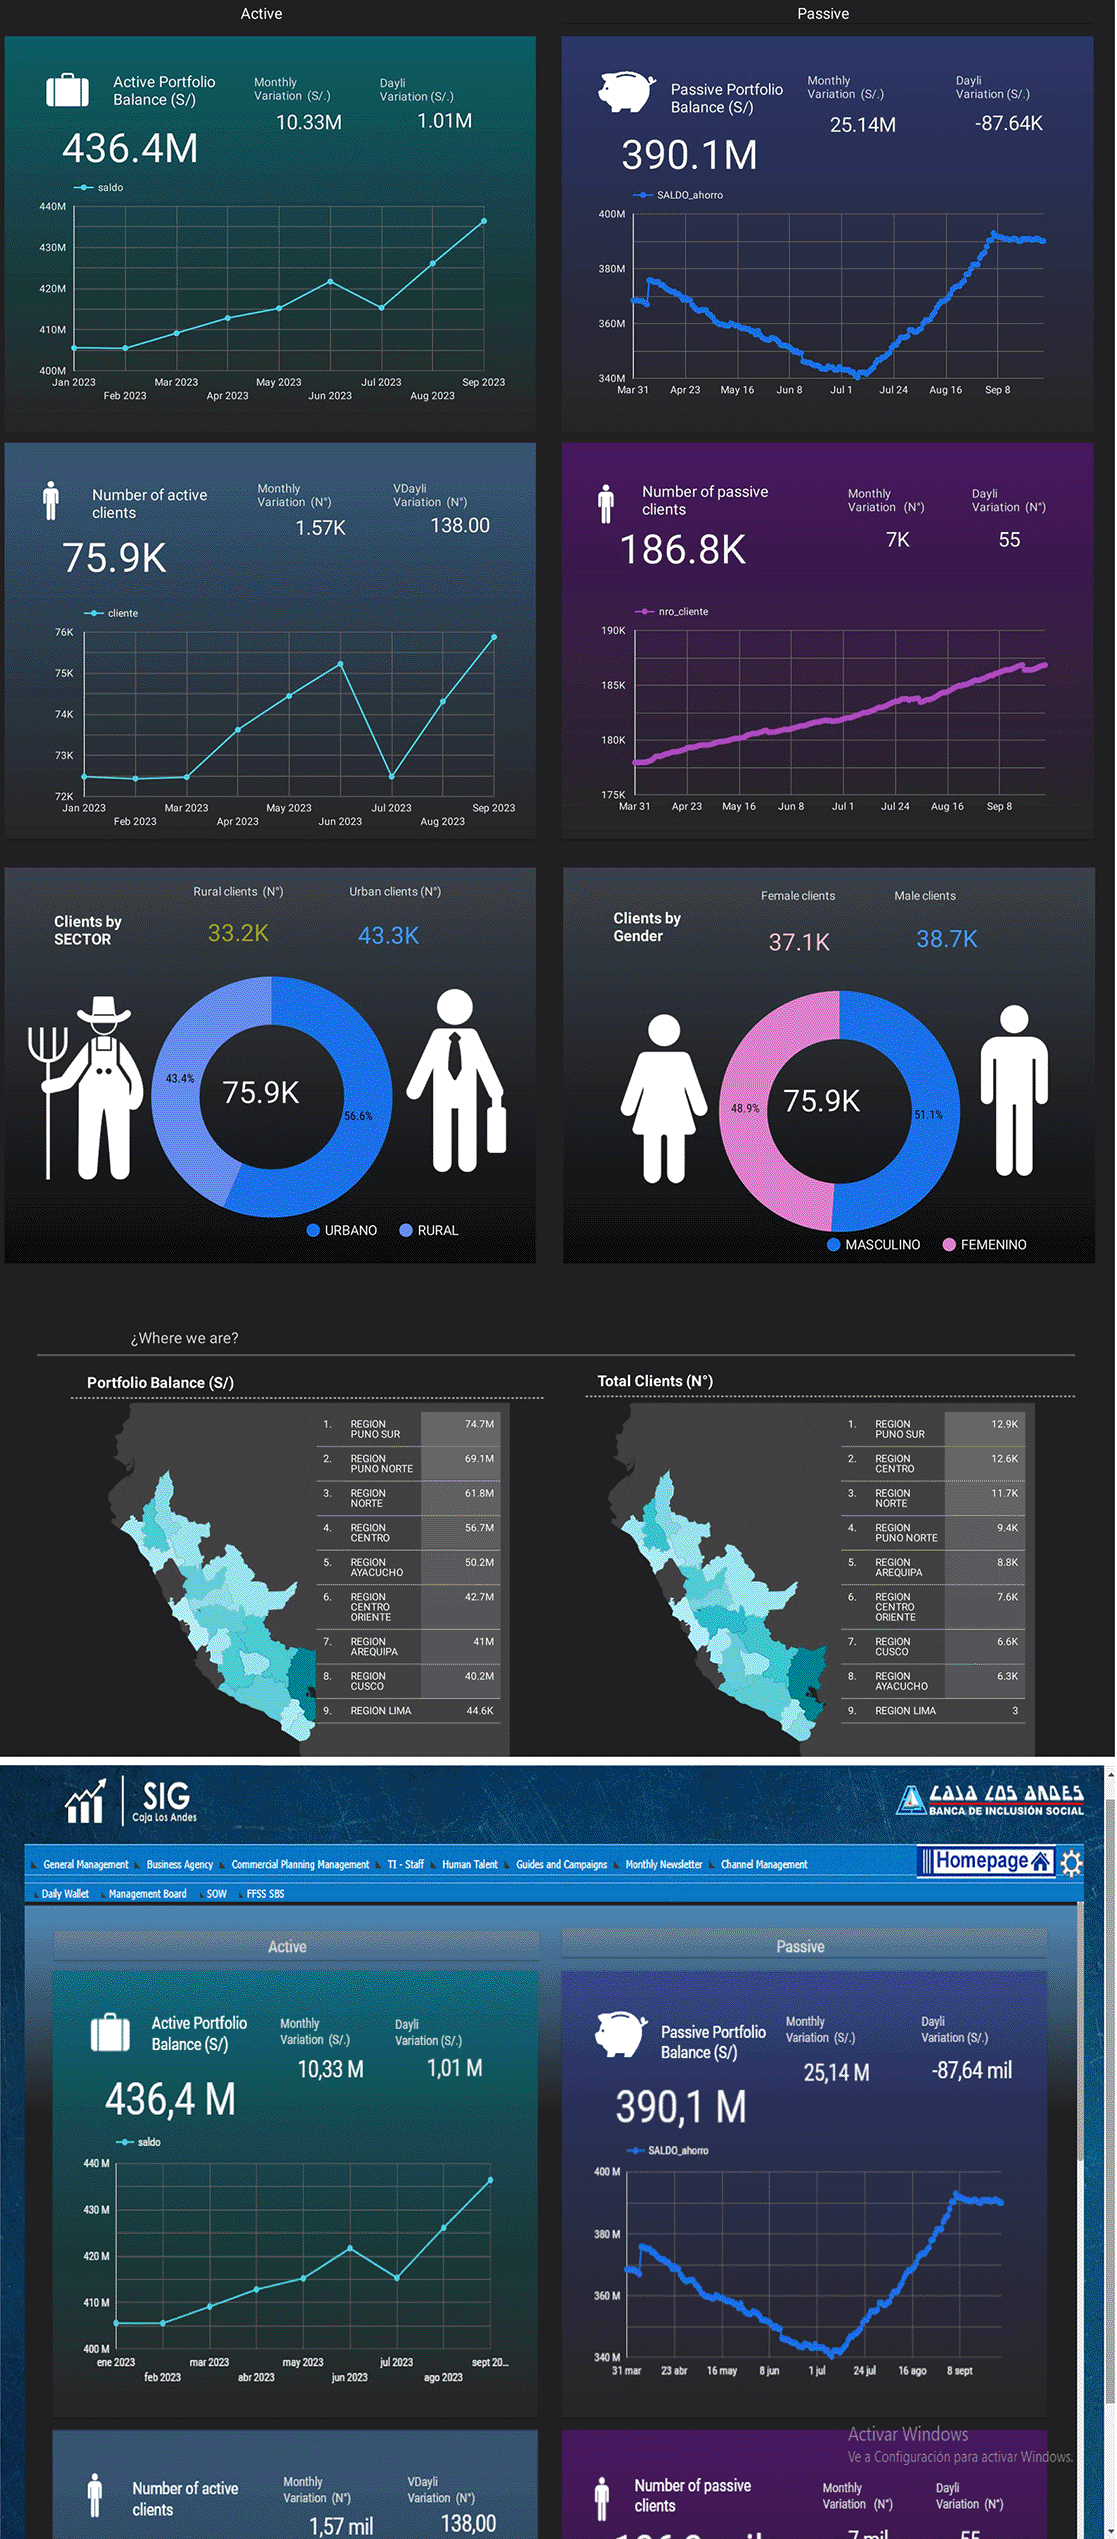
The important thing was not only to define the key indicators, but also to show their movement over time to help predict behavior patterns. The prototype shows the Dashboard embedded within the main GIS form, specifically in the “General Management” section.
3.1.1 Input
3.1.2 Output
Figure 7 shows one of the most consulted reports of the daily portfolio, located within the Business Management division, in which we can see the details of the placements by region, and with the drill down, by office and by advisor; The drill down also works for the columns, in a first view we see the stock and if we activate the option (+) we can see the variations. The report allows queries of previous dates and filters by placement channel or sales force, maintaining the structure of the report after applying the filters. Additionally, the company’s Business Management division has other reporting options such as zero disbursements, amortizations, monthly evolution, productivity and harvests.
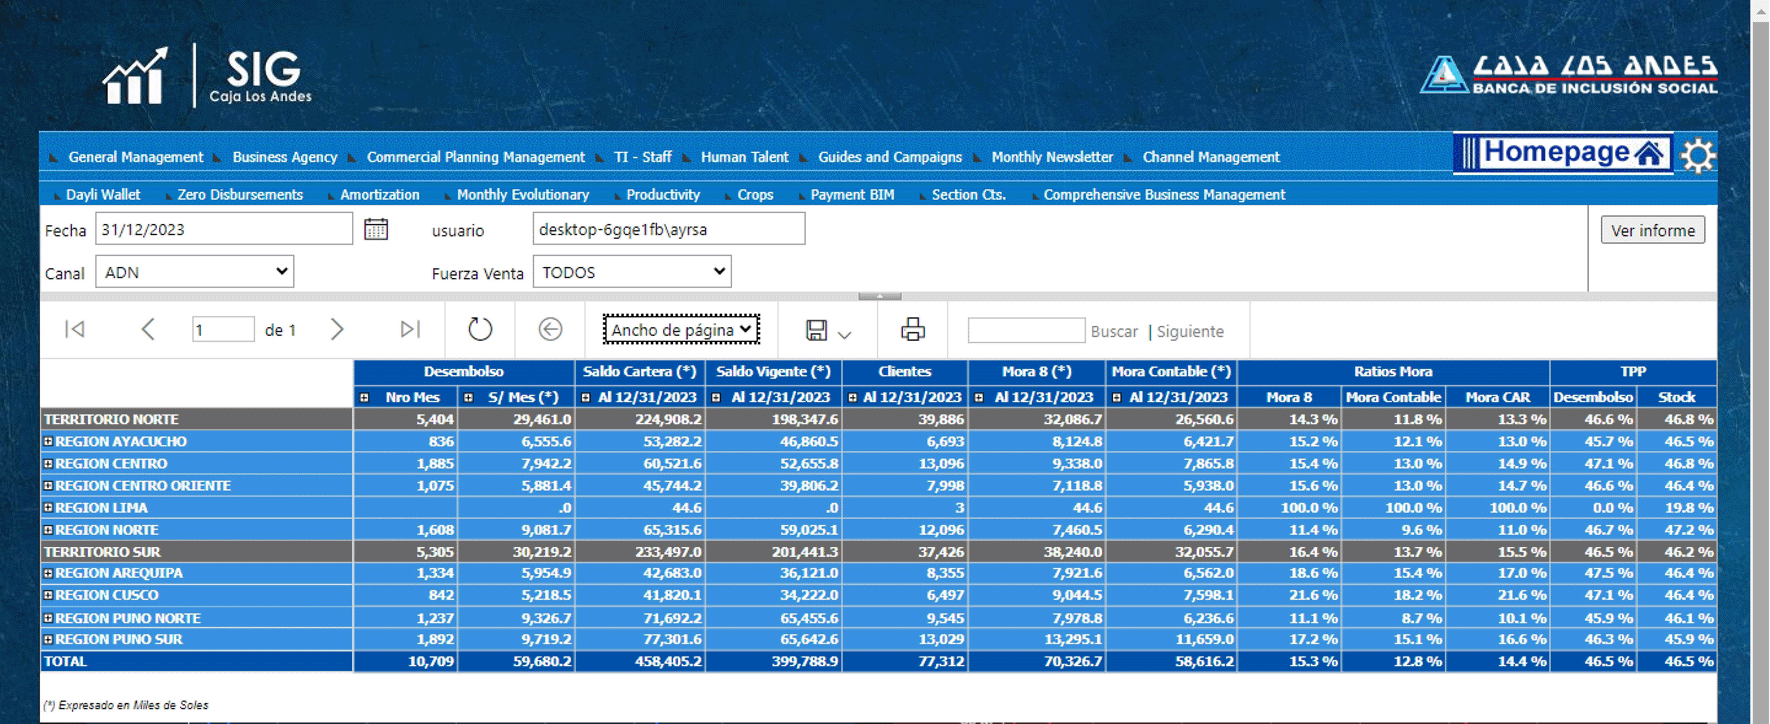
The image represents what the report should look like already integrated into the system.
3.2.1 Input
3.2.2 Output
Figure 8 shows the structure of the monthly evolutionary report, which is within the Business Management division. In this report we are going to visualize the same commercial variables of the Daily Portfolio report, with the difference that is shown graphically and in an initial period of 6 months; The report allows you to change the start and end date to compare more months, in addition to filtering by region, office, advisor, channel, establishment or product.
3.3.1 Input
3.3.2 Output
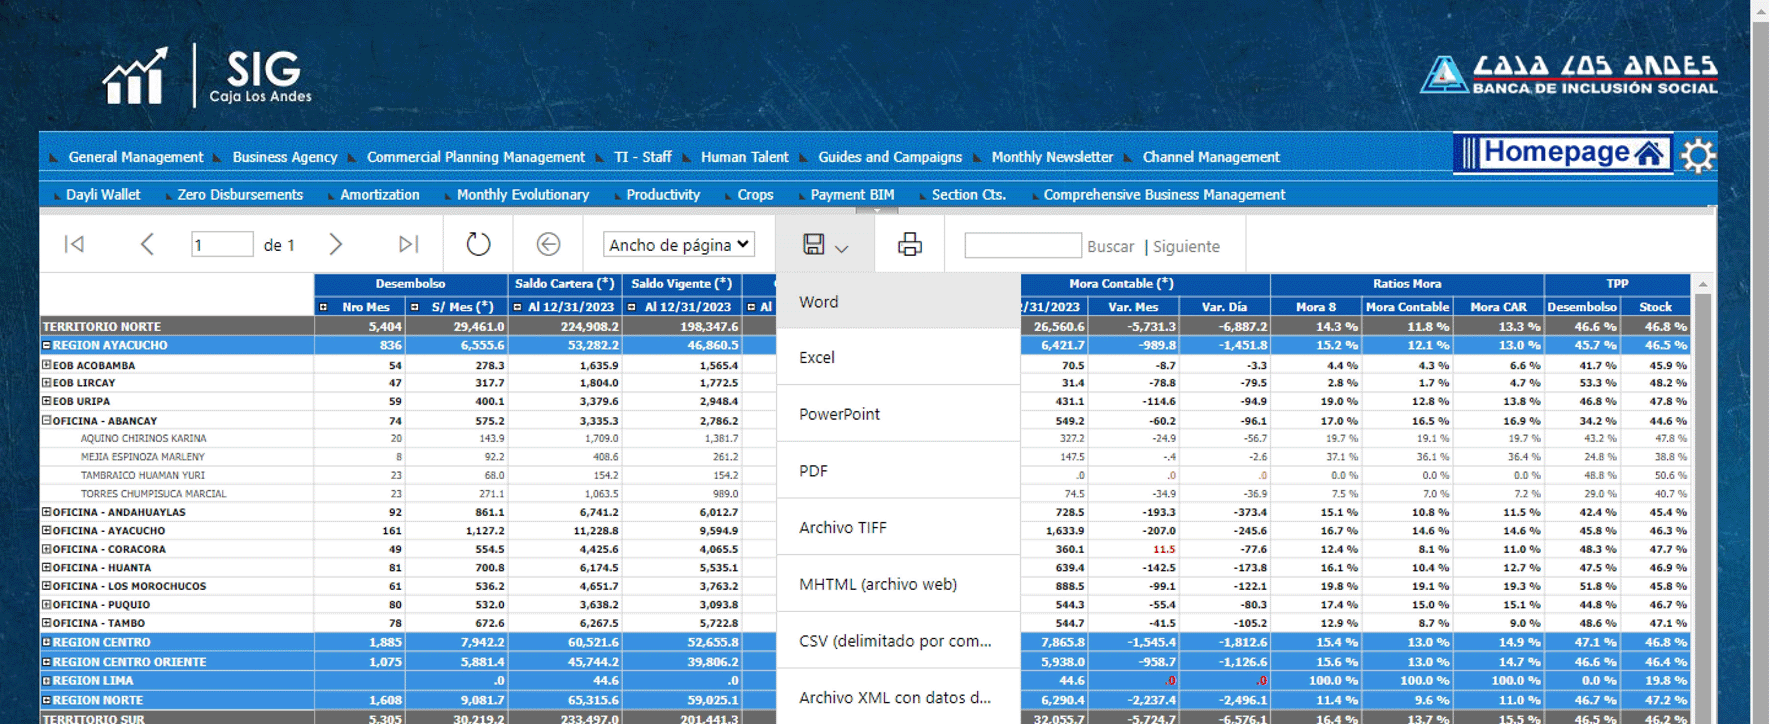
Figure 9 shows the options available to export information from both a graph and a report. Options are XML, CSV (comma delimited), PDF, MHTML (web file), Excel, TIFF File, and Word; The described options are enabled for all main menu options, plus this functionality keeps the grouping components in the target format.
3.4.1 Input
3.4.2 Output
Figure 6 determines how we can optimize times by obtaining relevant information for the company without the need to perform specific searches, this is because the dashboards built in looker studio have the particular characteristic of obtaining information from the data and centralizing the indicators to know the situation at the beginning of the day. This agrees with what he indicates20 in his research, where he explains the importance of implementing a dashboard in companies to identify key indicators, risk factors and make strategic decisions in order to obtain optimal results that guarantee the competitiveness of the company. Which is reflected in the 78.1% reduction in time in analysis and generation of reports. It also agrees with7 where it is mentioned that dashboards are tools that allow you to view relevant information, have a clear perspective of the current situation of an organization, facilitating decision making. Finally, this also agrees with21 where it indicates that dashboards are a powerful tool for managing information, allowing you to know the current situation of companies and allowing reports to be more efficient, placing the institution in a better position compared to its competitors. generating competitive advantages.22
In Figure 7, through reporting services, the ability of the system to be able to make homogeneous comparisons by level is demonstrated, which makes it possible to determine deviations in regions, offices and/or advisors at the date of consultation and carry out corrective actions that help maximize results before the end of the month, information which was previously processed manually, taking longer to generate data and with a greater probability of error; This agrees with23 those who analyze how information technologies can be associated with production processes to improve labor productivity, becoming a transformative element. In the same way24 specify how administrative management processes are improved through the implementation of a web system, which contributed to the increase in sales and the reduction of time in the rental and reservation processes, streamlining the analysis of useful information for the decision making. Finally,25 they also make reference to the improvement of processes in their research by demonstrating that the non-use of information technologies limits the process of generating and disseminating information in SMEs and directly affects its quality.
In Figure 8, we determine how short, medium and long-term strategies can be structured with the help of an evolutionary report. This vision, accompanied by the seasonal behavior of the financial system, provides management with the ability to make effective decisions and to know in What time to launch aggressive or conservative campaigns to control results and achievement of objectives.26 This is supported by the study of Ref. 27 those who demonstrated the lack of management information systems that support decision-making in companies in the sector due to the lack of management indicators. Likewise, Ref. 25 in their research they analyze how SMEs can improve their competitiveness through improvements in decision-making by including information technologies in their internal processes. Finally, Ref. 28 their study shows how to define information quality criteria and the appropriate use of data in SMEs to clarify information management in decision-making to support business activities.
In Figure 9, the versatility of the system is determined to avoid dependence on connectivity to analyze the indicators, exporting any of the reports according to the need of the moment, we can access this information offline from any device and have the staff Dedicate yourself to the core of the business in the field without having to invest time in operational tasks in the office. As demonstrated in the study Ref. 27 where they show the need to carry out their research to develop a comprehensive proposal for linking GIS and management of indicators that supports decision making in a rural area of Ecuador. This also agrees with the statement made23 when specifying that emerging companies suffer from problems of access and generation of information since, due to their structure, they treat information in a basic way. Finally, Ref. 28 they analyze how small and medium-sized companies often do not give due importance to data analysis and the negative impact that this practice has on the development of their activities.
It is concluded that the implementation of a management information system to improve administrative management turned out to be a beneficial contribution in the treatment and analysis of information globally, which allowed the time dedicated to generating reports to be reduced by 21.2% in addition to reducing the error rate in manual records by 100%. This time savings provided the opportunity to improve business indicators through reports for decision making.
The first improvement is associated with the reduction of time invested in generating reports, which allowed more space for adequate analysis of the information, in addition to reducing the high probability of error due to manual data recording; it also allowed the self-generation of reports and visualization on a dashboard that allows identifying opportunities for improvement in administrative and commercial management in a more efficient and orderly way, making each member of the organization focus on their area.
Finally, the system has an additional advantage and that is that it handles the information securely, only controlling access to members of the organization and in accordance with the permissions that have been assigned to each user, ensuring that sensitive information is not filter through other channels.
The preparation and continuous training of the organization’s personnel is recommended for the correct use of the Management Information system. It is suggested to prepare an improvement plan to strengthen the system, or a maintenance plan in case an update to the reports is necessary. In addition, it is suggested to prepare a contingency plan for possible errors during the execution of the system.
Zenodo: DataDashboard, https://doi.org/10.5281/zenodo.10614354. 29
Data are available under the terms of the Creative Commons Attribution 4.0 International license (CC-BY 4.0).
Source code available from: https://github.com/eddie66618/sig.git (Software).
Archived source code at time of publication: https://doi.org/10.5281/zenodo.10614376. 30
License: GPL 3.0.
We thank Caja Los Andes for its strong support with this study and engineer Alex Pacheco from the Faculty of Engineering and Architecture of the Cesar Vallejo University for his methodological advice in this research.
| Views | Downloads | |
|---|---|---|
| F1000Research | - | - |
|
PubMed Central
Data from PMC are received and updated monthly.
|
- | - |
Is the rationale for developing the new software tool clearly explained?
Yes
Is the description of the software tool technically sound?
Yes
Are sufficient details of the code, methods and analysis (if applicable) provided to allow replication of the software development and its use by others?
Partly
Is sufficient information provided to allow interpretation of the expected output datasets and any results generated using the tool?
Partly
Are the conclusions about the tool and its performance adequately supported by the findings presented in the article?
Partly
Competing Interests: No competing interests were disclosed.
Reviewer Expertise: Management information systems, computer programming, emerging technologies of the information society
Is the rationale for developing the new software tool clearly explained?
Partly
Is the description of the software tool technically sound?
Partly
Are sufficient details of the code, methods and analysis (if applicable) provided to allow replication of the software development and its use by others?
Partly
Is sufficient information provided to allow interpretation of the expected output datasets and any results generated using the tool?
Partly
Are the conclusions about the tool and its performance adequately supported by the findings presented in the article?
Yes
Competing Interests: No competing interests were disclosed.
Reviewer Expertise: Business informatics
Alongside their report, reviewers assign a status to the article:
| Invited Reviewers | ||
|---|---|---|
| 1 | 2 | |
|
Version 1 21 Mar 24 |
read | read |
Provide sufficient details of any financial or non-financial competing interests to enable users to assess whether your comments might lead a reasonable person to question your impartiality. Consider the following examples, but note that this is not an exhaustive list:
Sign up for content alerts and receive a weekly or monthly email with all newly published articles
Already registered? Sign in
The email address should be the one you originally registered with F1000.
You registered with F1000 via Google, so we cannot reset your password.
To sign in, please click here.
If you still need help with your Google account password, please click here.
You registered with F1000 via Facebook, so we cannot reset your password.
To sign in, please click here.
If you still need help with your Facebook account password, please click here.
If your email address is registered with us, we will email you instructions to reset your password.
If you think you should have received this email but it has not arrived, please check your spam filters and/or contact for further assistance.
Comments on this article Comments (0)