Keywords
Nociception, anti-nociception, normalized pulse volume, objective pain monitoring
Quantifying pain and the balance between nociception and anti-nociception (NANB) in sedated patients is challenging. Traditional opioid titration methods overlook individual differences, while existing indices like the Noxious Stimulation Response Index (NSRI) lack correlation with effect-site concentration (Ce). The Normalized Pulse Volume (NPV), used in polygraphs, has potential for pain quantification but is underexplored. This study aimed to assess NPV’s efficacy as a pain monitoring tool compared to Ce and to explore its potential in various clinical settings.
The study included 39 patients undergoing surgery under total intravenous anesthesia from July 2013 to May 2014. Selection criteria were an American Society of Anesthesiologists physical status classification system (ASA score) of 1 or 2 and surgeries with minimal fluid resuscitation or blood loss. Exclusion criteria were significant posture changes, massive hemorrhage, and high perfusion index variation. NPV and Ce were measured using the Masimo SET adult SpO2 sensor.
Out of 39 patients, 9 were excluded. NPV at recovery of spontaneous respiration (RoR) was 2.62 (95% CI: 2.26–2.98) with a coefficient of variation (CoV) of 36.3%, while total Ce was 1.48 ng/ml (95% CI: 1.14–1.84) with a CoV of 62.4%. NPV showed a narrower CoV than Ce (p < 0.05, 1.93*10−5), indicating less variability. NPV outperformed Ce in predicting RoR, suggesting a more accurate reflection of NANB balance. Its superiority in stable measurement underlines its potential as a reliable pain indicator. The study’s limitations include temporal differences in NPV and Ce calculations, affecting comparative analysis.
NPV demonstrates promise as an objective, reliable indicator of pain or NANB, showing a strong correlation with Ce. Its application could improve pain assessments in clinical settings, optimizing patient care and analgesic administration. Future research should integrate NPV with other vital signs for a comprehensive pain monitoring system.
Nociception, anti-nociception, normalized pulse volume, objective pain monitoring
Objective quantification of pain, or more specifically the balance between nociception and anti-nociception (NANB), has long been a challenging task, especially in sedated or anesthetized patients.1 The absence of a universally accepted, objective pain monitoring system renders titration of analgesics, particularly opioid analgesics, highly challenging in diverse clinical settings—ranging from the operating room under general anesthesia to intensive care units, and extending to special populations like pediatrics, geriatrics, unconscious patients, non-native speakers, and those undergoing various forms of local anesthesia such as epidural, spinal, and nerve block procedures.2–5
Traditionally, the titration of opioid analgesics was empirical; however, several contemporary medical facilities now rely on drug pharmacokinetic simulations to estimate the effect-site concentration (Ce).6–9 While these simulations provide a standardized approach, they often overlook individual variations in drug sensitivity, body composition, and distribution volume. Furthermore, intraoperative fluid resuscitation or blood loss can introduce additional variables that the simulations may not account for. This can inadvertently compromise patient experience, leading to either inadequate analgesia or excessive drug effects, such as respiratory depression with opioids or local anesthetic systemic toxicity.
While attempts have been made to numerically quantify pain or NANB, such as the Noxious Stimulation Response Index (NSRI) and the Surgical Pleth Index (SPI), their adoption in clinical practice remains limited.10–13 Notably, despite the potential advantages of these indices, previous studies have not compared them against the established standard of Ce. This may partly explain their limited widespread acceptance. Moreover, the accuracy and relevance of these indices in the face of hemodynamic events have been debated, further impeding their universal adoption.14–21
One notable parameter is the normalized pulse volume (NPV), which represents the ratio of the pulsatile to non-pulsatile component in pulse oximetry. Historically used in polygraphs,22,23 recent research has shown its potential to reflect mental stress. This parameter has also been explored in contexts like peripheral nerve block success and fluid volume assessment.24–26 However, its utility as an indicator for pain or NANB quantification remains largely unexplored.
Therefore, our study aimed to delve deeper into the realm of objective pain monitoring, exploring the efficacy, limitations, and potential of existing and emerging technologies.
While the challenges and limitations of current pain monitoring systems have been recognized, the potential use of NPV as a marker for the NANB during sedation or anesthesia remains largely unexplored. NPV represents the ratio of the pulsatile (AC) component to the non-pulsatile (DC) component in pulse plethysmography. Historically, this ratio has been used in fields such as physiological psychology, where it is known to decrease with psychological stress, and is thus applied in tools such as polygraphs. In anesthesiology, companies such as Masimo have utilized this measure as the Perfusion Index (PI) to assess circulatory plasma volume. This suggests that under conditions where changes in circulatory plasma volume are minimal, NPV could potentially serve as a reliable indicator of physical stress.
Several studies have observed changes in blood flow in areas targeted by local anesthetics such as epidural, spinal, and nerve blocks, with some research tracking these effects using NPV or PI. However, the application of NPV as a measure of analgesic efficacy under general anesthesia has not been explored. Although some evidence suggests that NPV might better reflect vascular resistance and sympathetic nerve α action than other parameters, its exclusion from initial parameters in tools such as the Surgical Stress Index (SSI) indicates that its potential in this realm is yet to be fully realized.
Given this background, our study hypothesized that NPV accurately reflects the NANB. We aimed to validate the utility of NPV as a novel indicator for the balance of nociceptive stimulation and analgesic efficacy. Additionally, our research explored the relationship between NPV and Ce, which is the standard titrating protocol. Furthermore, by utilizing multiple wavelengths, spanning both infrared and visible light, we strived to refine NPV measurements, ensuring its applicability even under challenging clinical scenarios such as severe anemia, hypovolemia, extreme peripheral vasoconstriction, varying skin pigmentation, and external light interference.
In essence, our goal was to ascertain the validity of NPV in quantifying pain or NANB and to elucidate the relationship between NPV and Ce in a clinical setting.
The design and protocols were reviewed and approved by Tokyo Metropolitan Bokutoh Hospital Ethics Committee the local ethics committee in March 2017, under reference number 29-11.
For the analysis of the relationship between NPV and the Ce, we recruited 39 patients scheduled to undergo surgery under total intravenous anesthesia between July 2013 and May 2014 [Table 1-3].
The inclusion criteria were as follows: patients with an ASA score of 1 or 2, indicating healthy individuals or those with only mild systemic diseases. Only patients undergoing surgeries where there would be no changes in the position of the surgical field relative to the sensor, minimal fluid resuscitation or blood loss, and no concomitant use of epidural, spinal, or nerve block anesthesia were included.27–33 At our institution, this primarily pertained to otolaryngology and dental and oral surgeries.
The exclusion criteria were as follows: patients undergoing surgeries that might involve significant posture changes or that have the potential for massive hemorrhage. Cases with high perfusion index variation (PVI > 25) or low perfusion index (PI < 1) during induction were excluded.34–44 Cases with insufficient data sets or outliers were also excluded. Of the 38 initially recruited patients, 29 patients are included as 9 were excluded based on the above criteria: 3 due to an insufficient data set, 3 with a high PVI at extubation, and 3 with a low PI at induction.
Patients recruited for this segment of the study were equipped with the Masimo SET® Pulse Oximetry adult SpO2 adhesive sensor (Masimo Corporation, Irvine, CA, United States of America) to measure NPV, in addition to routine monitoring. Anesthesia was induced using a bolus of fentanyl and a continuous infusion of remifentanil and propofol, ensuring that the Bispectral Index™ (BIS™, Medtronic, Minneapolis, MN United States of America) remained between 40 and 60. Fentanyl was titrated to approximately 1 ng/ml towards the end of the operation, with remifentanil adjusted accordingly.45
A respiratory rate of eight breaths per minute was maintained until the recovery of spontaneous respiration (RoR). Both NPV and Ce for fentanyl and remifentanil were recorded upon RoR. The estimated Ce was derived using the built-in pharmacokinetic simulations—Shafer model for fentanyl and Minto/Schnider model for remifentanil—provided by the Fortec ORSYS perioperative patient information system (Philips, Netherlands). The total Ce was adjusted considering remifentanil’s greater potency, in alignment with the previous study. The coefficient of variation (CoV) for both NPV and total Ce was evaluated.
Patients were instrumented with the Masimo RainbowSET® Technology adhesive sensor on their fingertips. Continuous recordings were conducted in conjunction with other vital signs from the time of entry to the operating room. The Ce of the drugs was calculated using the built-in functions of the Philips Orsys anesthesia chart, employing the Shafer method for fentanyl and the Minto/Schnider method for remifentanil. Fentanyl was titrated to achieve an estimated Ce of 1 ng/ml at the end of surgery. We ensured the absence of respiratory depression from sedatives or muscle relaxants. The recovery of spontaneous respiration was defined at 8 breaths/minute, and at this juncture, we compared the NPV with the estimated Ce. For this comparison, the respiratory depressive potency ratio between fentanyl and remifentanil was set at 1:2, based on previous research findings,45 and the sum of the effective site concentration of remifentanil and 0.5 times the effective site concentration of fentanyl was recorded (henceforth referred to as CE).
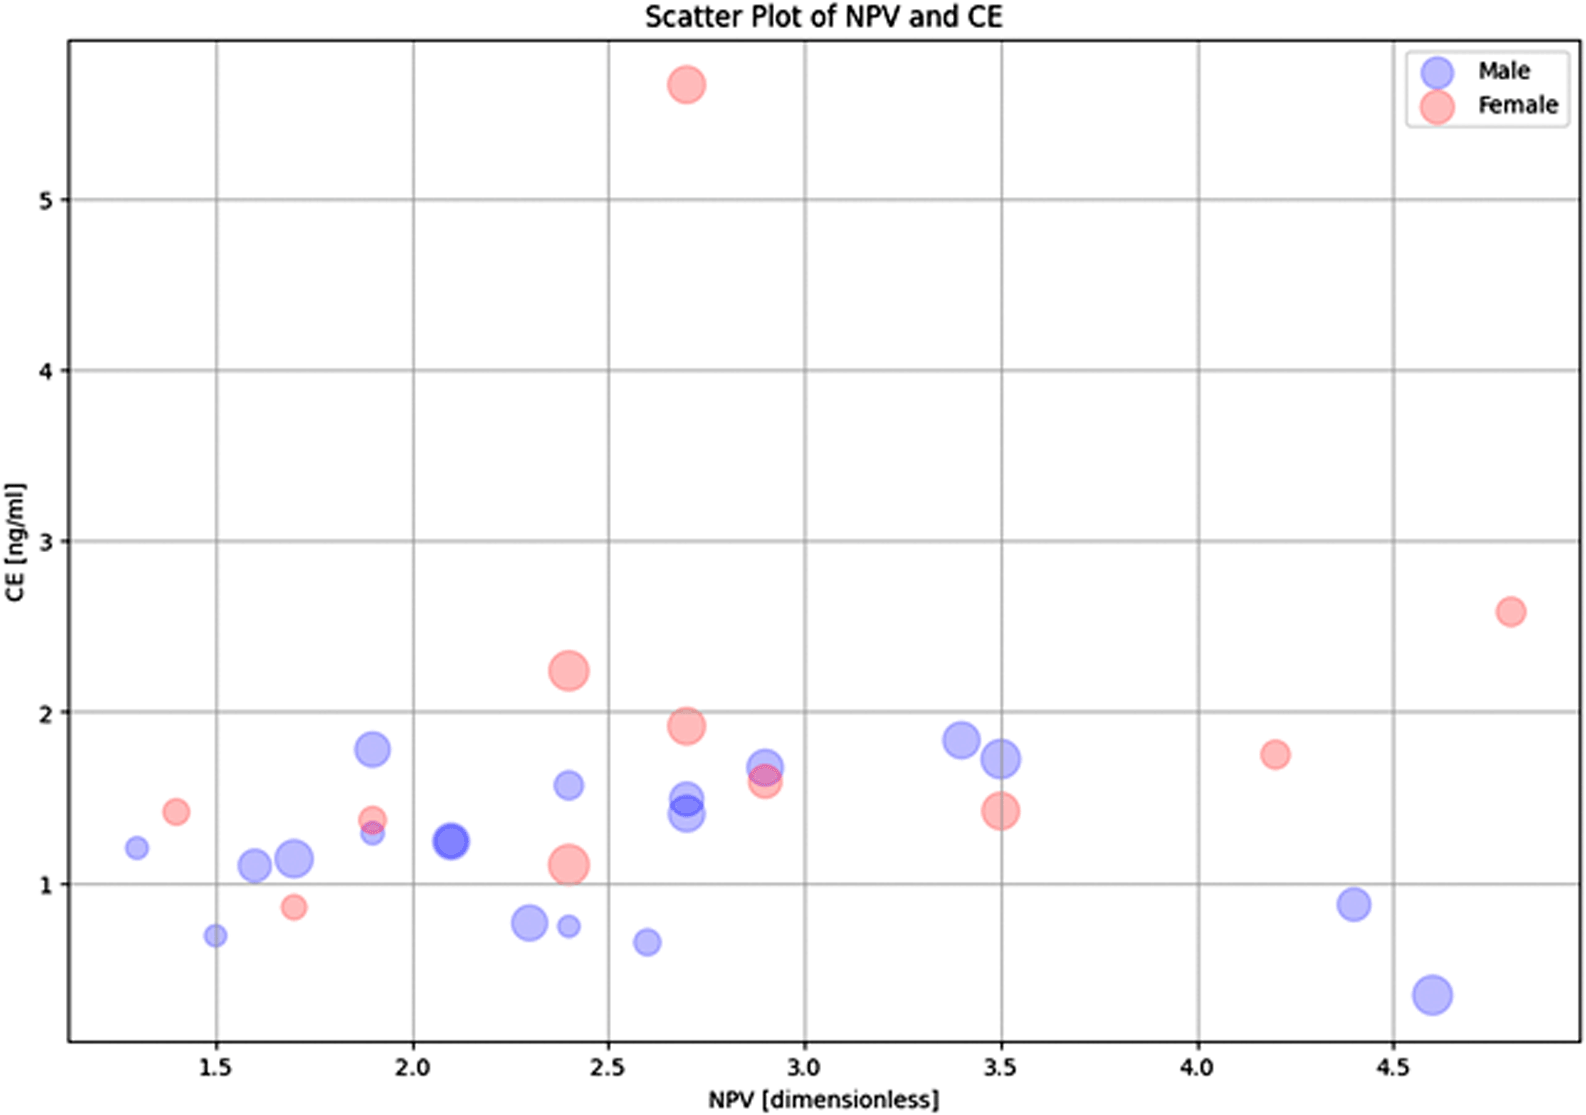
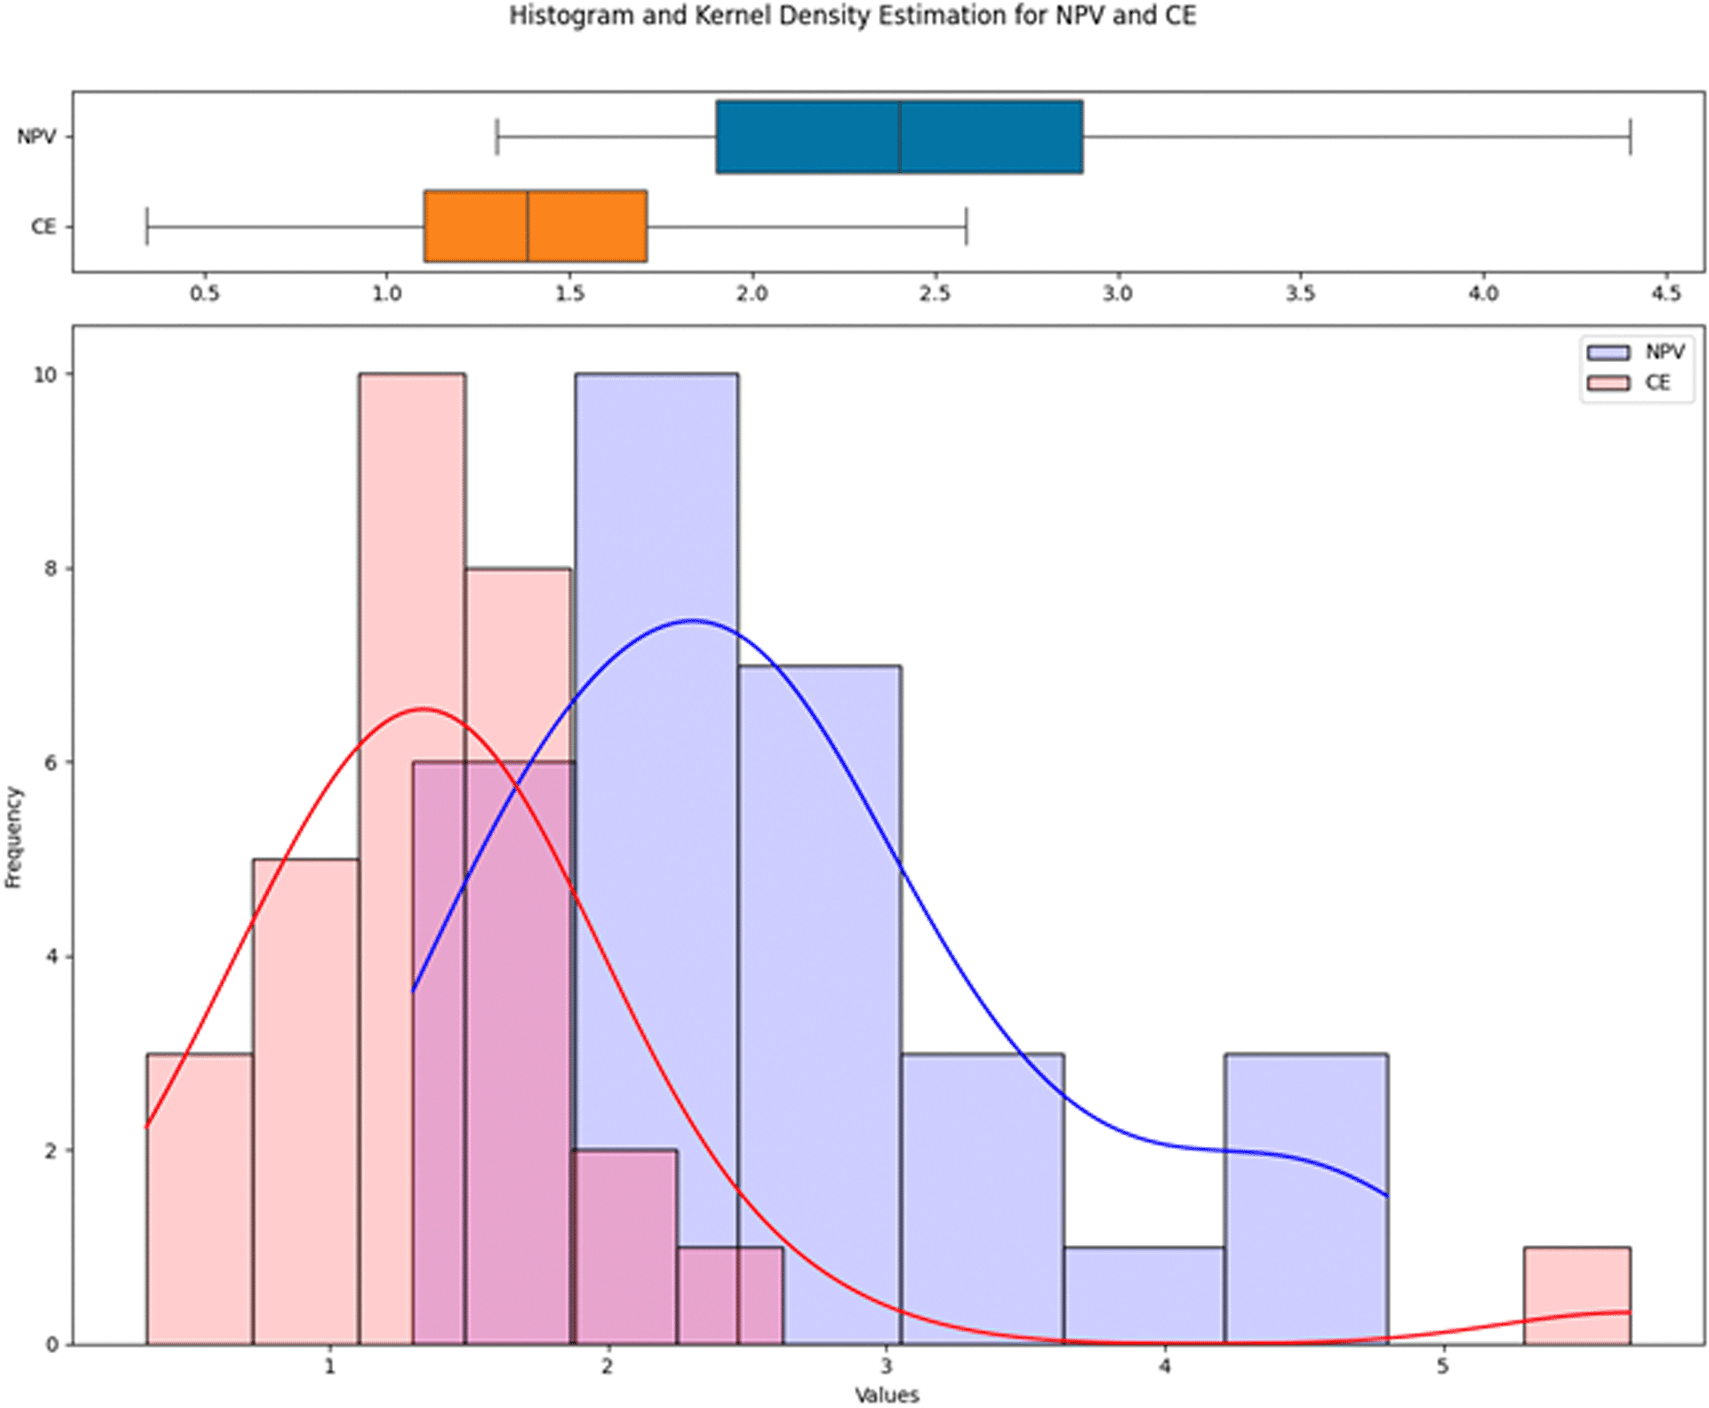
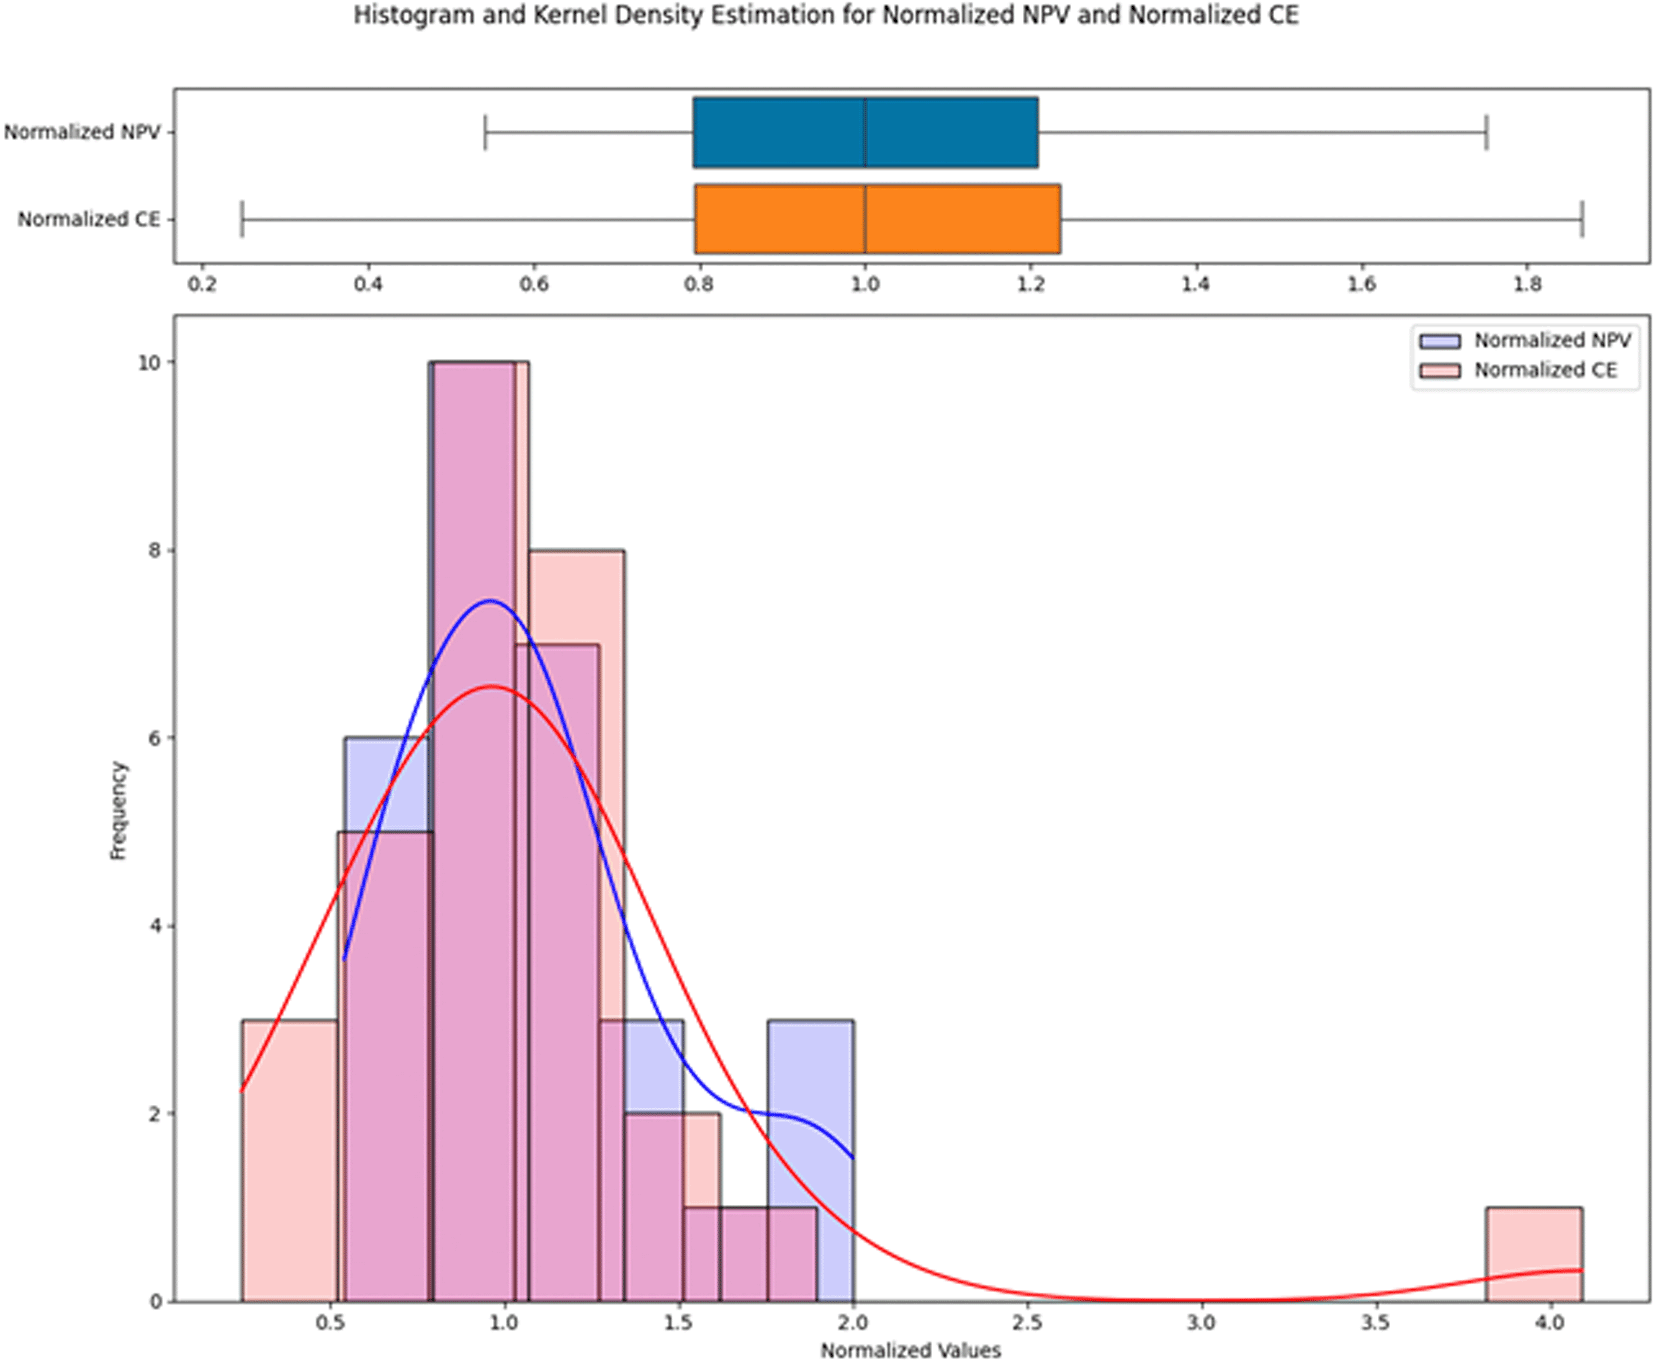
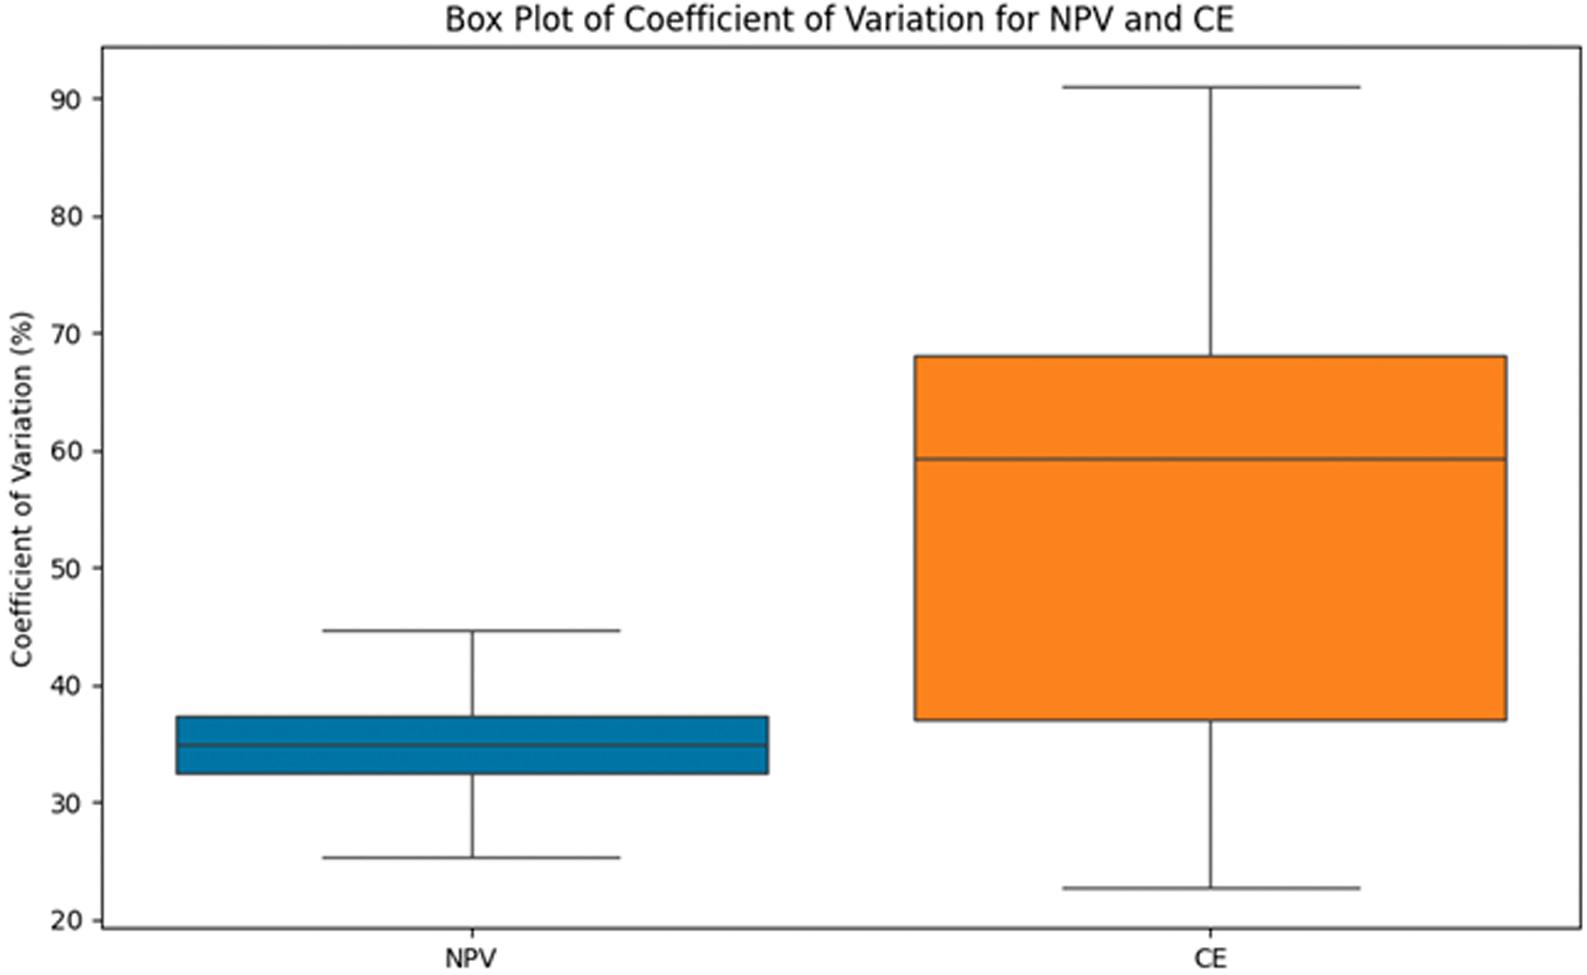
Multivariate outlier detection by Mahalanobis distance revealed no case corresponding to outliers as the critical value for the Chi-square distribution with 95% confidence was 5.99. Demographics of the included cases are shown in Tables 1, 2, and 3. NPV on RoR was 2.62 [dimensionless number] with a 95% confidence interval of 2.26–2.98, and a CoV of 36.3%. Conversely, CE on RoR was 1.48 [1.14–1.84] [ng/ml], with a CoV of 62.4% [Figure 1]. The Z test and the test for CoV showed that NPV on RoR was narrower than CE with a significance level of < 0.05 (1.93*10−5) [Figures 2–4]. In the bootstrapped distribution, the mean and median coefficients of variation for CE were higher than those for NPV, indicating greater relative variability. The confidence interval for NPV was relatively narrow, indicating that the estimation of the coefficient of variation is stable. Alternatively, the confidence interval for CE was wide, indicating a significant uncertainty in the estimation of the coefficient of variation. Although there were areas where the confidence intervals overlapped, differences in the central values were evident. These findings suggest that CE is more variable than NPV [Figure 5].

CE: Weighted Sum of Estimated Effect Site Concentration of Fentanyl and Remifentanil; NPV: Normalized Pulse Volume.

CE: Weighted Sum of Estimated Effect Site Concentration of Fentanyl and Remifentanil; NPV: Normalized Pulse Volume.

CE: Weighted Sum of Estimated Effect Site Concentration of Fentanyl and Remifentanil; NPV: Normalized Pulse Volume.

CE: Weighted Sum of Estimated Effect Site Concentration of Fentanyl and Remifentanil.
The presence of pain is harmful and associated with both all-cause and cancer-related mortality.46–50 Conversely, narcotic analgesics used for pain relief have a negative impact on cancer progression and survival.51,52 Moreover, drug abuse is a social issue.53–55 Therefore, there is a great social demand for the proper use of analgesics and the quantification of pain, or NANB, as the basis for the use of analgesics, as well as the quantification of NANB and other sensory information.56,57
A range of potential bioindicators for quantifying and othering pain include autonomic parameters such as electromyography, heart rate variability, and skin conductance,58 as well as biomarkers in psychiatric disorders, including neuroimaging, metabolite levels, and gene expression changes.59 Other potential bioindicators include functional near-infrared spectroscopy (fNIRS) machine learning,60 and mechanistic, translational, and quantitative pain assessment tools.61 Brain-based biomarkers for pain, particularly those identified through neuroimaging and machine learning, have also been proposed.62 However, the lack of validated objective markers for nociception and pain remains a challenge.63
The NPV demonstrated a superior predictive capability for the RoR, compared with the CE. In the context of assessing NANB, the NPV provided a more accurate reflection than drug simulation techniques. This suggests a stronger correlation between NPV and the balance of noxious stimuli and analgesia.
Building on these findings, there is potential to develop a multimodal approach that integrates the strengths of NPV with other measurements. Such a holistic approach could further enhance the accuracy and reliability of pain assessments in diverse clinical settings.
It is important to note that while NPV is calculated on a beat-to-beat basis, CE is computed only every minute. This temporal discrepancy might influence the comparative analysis between NPV and CE.
Our team is keen on advancing this research by testing the efficacy of a pain monitoring system that employs NPV as its primary parameter, combined with other vital signs. Such a comprehensive instrument could offer a more nuanced and accurate pain assessment in clinical settings, further optimizing patient care and ensuring optimal analgesic administration. As this study was conducted with only one focus, RoR, it is necessary to study the predictive effect of stimuli that change over time.64
This design and protocols were reviewed and approved by Tokyo Metropolitan Bokutoh Hospital Ethics Committee the local ethics committee in March 2017, under reference number.29–11 Written consent to participate in the study was obtained from the participants at the anaesthesiology pre-operative consultation, not on the day of surgery, and it was explained that there would be no disadvantage in withdrawing. The entire study was conducted in adherence with the Declaration of Helsinki.65
OT: Conceptualization, Data curation, Formal Analysis, Methodology, Writing – original draft, Writing – review & editing
YO: Writing – original draft, Writing – review & editing
Normalized pulse volume as a superior predictor of respiration recovery and quantification of nociception anti-nociception balance compared to opioid effect site concentration: A prospective, observational study GitHub-https://github.com/bougtoir/npv_nanb
This project contains the following underlying data: main data file with age, gender (NPV ad Ce npv_2023_.csv), original consent form in Japanese (npv_nanb_consent_form.doc), translated consent form in English (npv_nanb_consent_form_en.doc), participant information sheets (npv_profile_.csv), STROBE Statement—Checklist of items that should be included in reports of cohort studies (strobe_checklist_npv.doc), and Jupyter notebook which includes codes to reproduce results (npv_2023.ipynb).
Data are available under the terms of the Creative Commons Zero “No rights reserved” data waiver (CC0 1.0 Public domain dedication) (http://creativecommons.org/publicdomain/zero/1.0/).
We thank Iwamuratea and Chiron for their assistance with environment management.
We also thank Onishi Kotoha and Onishi Ione for their assistance. This study would not have been possible without their assistance.
We would like to thank Editage (www.editage.jp) for English language editing.
| Views | Downloads | |
|---|---|---|
| F1000Research | - | - |
|
PubMed Central
Data from PMC are received and updated monthly.
|
- | - |
Is the work clearly and accurately presented and does it cite the current literature?
No
Is the study design appropriate and is the work technically sound?
No
Are sufficient details of methods and analysis provided to allow replication by others?
No
If applicable, is the statistical analysis and its interpretation appropriate?
No
Are all the source data underlying the results available to ensure full reproducibility?
No source data required
Are the conclusions drawn adequately supported by the results?
No
References
1. Sawada Y, Tanaka G, Yamakoshi K: Normalized pulse volume (NPV) derived photo-plethysmographically as a more valid measure of the finger vascular tone.Int J Psychophysiol. 2001; 41 (1): 1-10 PubMed Abstract | Publisher Full TextCompeting Interests: I am employee of GE HealthCare, manufacturer of SPI.(I confirm that this potential conflict of interest does not affect my ability to write an objective and unbiased review of the article.)
Reviewer Expertise: Patient monitoring
Is the work clearly and accurately presented and does it cite the current literature?
Partly
Is the study design appropriate and is the work technically sound?
Yes
Are sufficient details of methods and analysis provided to allow replication by others?
Yes
If applicable, is the statistical analysis and its interpretation appropriate?
Yes
Are all the source data underlying the results available to ensure full reproducibility?
Yes
Are the conclusions drawn adequately supported by the results?
Yes
Competing Interests: No competing interests were disclosed.
Reviewer Expertise: No new data collection was required, and this paper describes the main idea of this study to the minimum necessary. On the other hand, as noted in the comments above, additional information would have enhanced the quality of this paper.
Alongside their report, reviewers assign a status to the article:
| Invited Reviewers | ||
|---|---|---|
| 1 | 2 | |
|
Version 1 27 Mar 24 |
read | read |
Provide sufficient details of any financial or non-financial competing interests to enable users to assess whether your comments might lead a reasonable person to question your impartiality. Consider the following examples, but note that this is not an exhaustive list:
Sign up for content alerts and receive a weekly or monthly email with all newly published articles
Already registered? Sign in
The email address should be the one you originally registered with F1000.
You registered with F1000 via Google, so we cannot reset your password.
To sign in, please click here.
If you still need help with your Google account password, please click here.
You registered with F1000 via Facebook, so we cannot reset your password.
To sign in, please click here.
If you still need help with your Facebook account password, please click here.
If your email address is registered with us, we will email you instructions to reset your password.
If you think you should have received this email but it has not arrived, please check your spam filters and/or contact for further assistance.
Comments on this article Comments (0)