Keywords
Chronic Kidney Disease, Stem Cell, Diabetes, Exosome, Wharton’s Jelly
Diabetes typically leads to repercussions such as chronic kidney disease (CKD), a worldwide health problem. Dialysis is typical for severe renal function loss (eGFR 15), but complications continue to exist. Chronic dialysis shortens life expectancy, and the wait for a transplant can be long, resulting in significant mortality. Human umbilical cord-derived Wharton’s jelly mesenchymal stem cells (hWJ-MSCs) have shown potential in regenerative healthcare for kidney repair, with unique capacities in restoring function and repairing damaged kidneys in animal models of chronic renal failure. The need to advance alternative medicines, such as regenerative medicine, in addressing crucial concerns in CKD care is stressed. We present the first case report in humans of a 70-year-old male with stage V chronic kidney disease caused by type 2 diabetes mellitus who received allogenic hWJ-MSCs and exosomes. The procedure includes the intravenous infusion of 100 million stem cells and 100 billion exosomes, which proved to be safe with no side effects. The renal profile improved significantly between the first and fourth months after infusion, according to assessments comprising lab results and the KDQOL-36TM questionnaire. Human umbilical cord Wharton’s jelly-derived mesenchymal stem cell implantations proved safe and effective in treating CKD.
Chronic Kidney Disease, Stem Cell, Diabetes, Exosome, Wharton’s Jelly
Diabetes is a significant public health issue in both developed and developing countries (de Boer et al. 2020; Sun et al. 2022). Type 2 diabetes mellitus (T2DM) accounts for over 90% of the global diabetes burden (Sun et al. 2022; Shaw, Sicree, and Zimmet 2010; Chen, Magliano, and Zimmet 2011). The global diabetes population has more than doubled in the last 20 years, owing to the obesity epidemic, which has resulted in a nearly tripling of obesity since 1975 (Manne-Goehler et al. 2016; Koye et al. 2018; Bentham et al. 2017). Obesity prevalence in children, adolescents, and adults has increased in every country throughout this time period (Bentham et al. 2017). Diabetes has an anticipated global prevalence of 11% among adults aged 20 to 79 in 2021, which is expected to rise to 12% by 2045 (Sun et al. 2022). Diabetes prevalence was similar in men and women in 2021, growing steadily with age, higher in urban (12%) than rural (8%) locations, and higher in high-income (11%) and middle-income (11%) countries compared to low-income countries (6%). Notably, the International Diabetes Federation (IDF) published a report in 2021 indicating that the number of people with diabetes globally and per IDF region in 2045 (20-79 years) will increase by 46% globally, 24% in North America and the Caribbean, 13% in Europe, 27% in the Western Pacific, 50% in South and Central America, 134% in the Middle East and North Africa, and 68% in South-East Asia (Figure A) (International Diabetes Federation 2021).
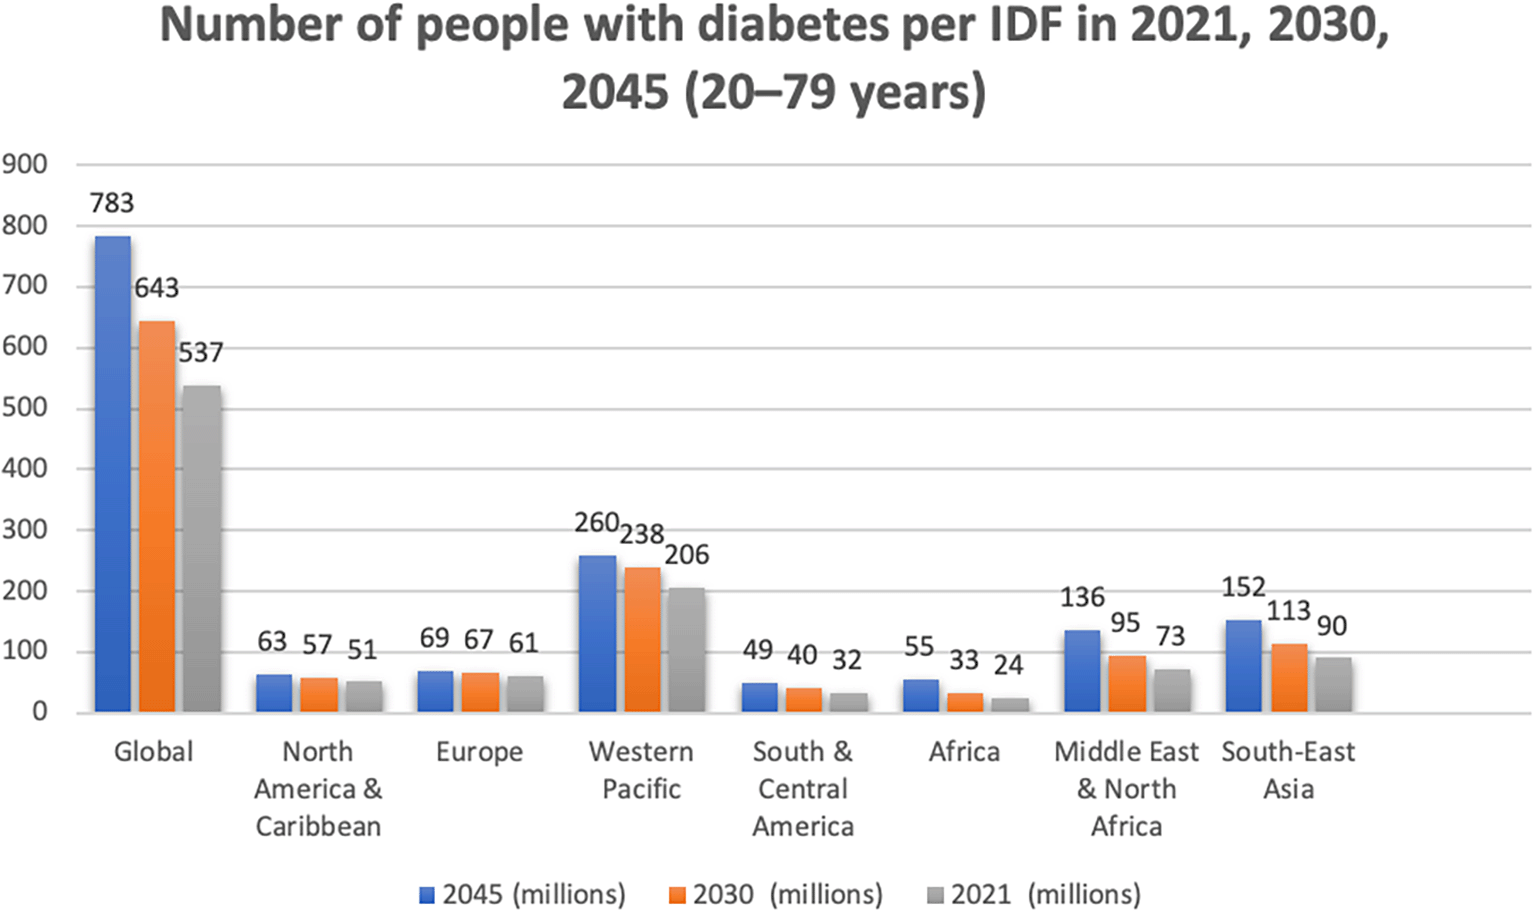
This global picture depicts the diabetes occurrence starting from 2021, 2030 and an estimated projection by 2045. The numbers were acquired from International diabetes federation (IDF) atlas handbook and histograms were created in the excel. The project contains the image file and IDF Diabetes Atlas 10th edition 2021.xlsx file.
Diabetes mellitus has been recognized as the major risk factor for CKD in developed nations, as evidenced by epidemiological studies. In the United States, the prevalence of CKD stages 3-4 among diagnosed diabetics was 24.5% from 2011 to 2014, 14.3% among prediabetics, and 4.9% among nondiabetics (Stempniewicz et al. 2021). A meta-analysis of 82 global studies (Hill et al. 2016) found a link between diabetes mellitus and the incidence of CKD. Diabetes mellitus has a well-established effect on renal function as well as the onset and progression of CKD, also known as diabetic kidney disease (DKD) (de Boer et al. 2020). DKD is usually characterized as the presence of chronic kidney disease (CKD) in a diabetic person with continuously (at least 3 months) elevated urinary albumin excretion (albumin-to-creatine ratio [ACR] 30 mg/g) and/or low estimated glomerular filtration rate (eGFR 60 mL/min/1.73 m2). With a lower GFR and rising albuminuria, the risk of unfavorable outcomes, including death and ESKD, rises. Individuals with a GFR less than 30 mL/min/1.73 m2 (i.e., CKD stage 4-5) are especially vulnerable to all types of albuminuria (Levin et al. 2013). Diabetic kidney damage occurs in approximately fifty percent of T2DM patients and one-third of T1DM individuals throughout their lifespan. It is one of the most common, expensive, and time-consuming long-term consequences of diabetes (Sun et al. 2022). Approximately 20% of T2DM patients have an eGFR of 60 mL/min/1.73 m2, and 30-50% have increased UACR. After a median follow-up of 15 years, 28% of participants in the UK Prospective Diabetes Study had an eGFR of 60 mL/min/1.73 m2, and 28% had albuminuria (Retnakaran et al. 2006). If T2DM occurs between the ages of 15 and 24 years, the probability of developing moderate albuminuria is about 100% (Zimmet et al. 2014).
Clinical guidelines propose treating numerous risk variables at the same time to enhance kidney outcome in T2DM, which is consistent with the multifaceted etiology of DKD. These therapies include lifestyle interventions such as a balanced diet and physical activity to lose weight, smoking cessation, and pharmaceutical glucose, blood pressure, and lipid management (Eckardt et al. 2018).
Angiotensin-converting enzyme (ACE) inhibitors and angiotensin receptor blockers (ARBs) are particularly suggested for blood pressure control, as these RAAS inhibitors have shown reno-protective characteristics and their capacity to lower blood pressure. Few clinical trials have recently reported the new medication classes which may aid in glucose-lowering such as sodium-glucose cotransporter-2 inhibitors (sGLT2i). These new-generation medicines have been found to enhance the renal functions in patients of T2DM (Muskiet, Wheeler, and Heerspink 2019).
Furthermore, since 1980, the advancements in treatment modalities have been beneficial in reducing the average annual drop in renal function of DKD patients by 65% (Barrera-Chimal et al. 2022).
The possibility of DKD development and cardiac diseases is very relatable and substantial. In the cases of DKD, steroidal mineralocorticoid receptor antagonists (MRAs), which include spironolactone and eplerenone, have been utilized previously. These MRAs possess anti-inflammatory and anti-fibrotic capabilities and aid in reducing albuminuria. The main highlight of using these MRAs is to moderate the decline in kidney function (Agarwal et al. 2021). However, the possible hormonal side effects and the increased risk of hyperkalemia from using these drugs undermine their use. In recent times, the concept of regenerative therapies has provided a shred of more significant evidence in managing CKD induced by diabetes. By inhibiting various pathogenic processes and promoting pro-regenerative mechanisms, stem or progenitor cell therapies provide a substitute treatment modality for controlling complicated disease processes (Xu, Liu, and Li 2022).
Mesenchymal stem cells (MSCs) have shown distinctive promise due to their simple accessibility from adult tissues and varied modes of action, including releasing paracrine anti-inflammatory and cytoprotective contents. Numerous experimental studies have used autologous or allogeneic MSC origins (e.g., placenta, amniotic, umbilical cord, bone marrow, adipose, tooth pulp) to treat DKD. Animal model results demonstrate a potential for systemic MSC infusion to regulate DKD development favorably. However, only a few early-phase clinical trials have started, and efficacy in humans has yet to be established (Sávio-Silva et al. 2020). To some extent, we present the first case study in which umbilical cord Wharton’s jelly derived MSCs and exosomes were administered to a patient with CKD stage V caused by T2DM with a follow-up period of 4 months.
We present a case study of a 71-year-old American white male previously diagnosed with stage V CKD. He had type 2 diabetes mellitus, which had been affecting his kidneys for more than three years, with an estimated glomerular filtration rate (eGFR) of ~ 11, blood urea nitrogen (BUN) of 115 mg/dL, and creatinine (Cr) of 5.1 mg/dL. He was treated with allogenic hWJ-MSCs and exosome administration protocol. This protocol involves the implantation of 100 million hWJ-MSCs and 100 billion exosomes intravenously. A premedication regimen consisting of a Myers cocktail (multivitamins, vitamin C, and B complex) was also administered. The Myers cocktail is administered when the patient arrives at the clinic, and about 45 minutes after the MSCs are administered directly, the IV is pushed together with the exosomes.
The protocol administration product was purchased from the Biogenesis laboratory located in Ensenada, Baja California. This facility is registered with the Federal Committee for Protection from Sanitary Risks (COFEPRIS). The certificate of analysis (COA) was also obtained before purchasing the product. Before the procedure, the patient was guided about the procedure, and a signed informed consent form was also acquired. The patient’s baseline medical history, physical exam, laboratory tests (renal function tests; RFTs), blood pressure, pulse rate, body temperature, oxygen saturation, and chest auscultation were recorded. The parameters mentioned above, excluding RFTs, were continuously monitored during the infusion, every 15 minutes during the first hour, and hourly during the subsequent three hours after the administration. This approach was utilized to observe any possible treatment-related or unrelated side effects.
The patient was thoroughly attended for after-infusion adverse events to anticipate the overall safety of the treatment. These reactions include self-limiting fever, rash, chest pain, vomiting, allergic reaction, nausea, difficulty breathing, and hives. All occurrences were captured over an 8-hour observation period. Following this observation, he could leave the Case Report Forms (CRFs) if no adverse occurrences (AE) unfolded. The primary objective of this study was to forecast and assess the safety and efficacy of the product infusion on his renal profile. A questionnaire (Kidney Disease and Quality Of Life; KDQOLTM-36) was used to assess his quality of life with renal disease both before and after stem cell therapy.
To the best of our knowledge, the patient has self-reported a diagnosis of hypertension. In the context of other medical conditions, the patient has disclosed a history of gout and sleep apnea. Regarding surgical history, the patient reports three prior surgical procedures: (1) Nasal surgery in the mid-90s, (2) cyst removal from the wrist in 2002, and (3) Uvulopalatopharyngoplasty (UPPP) in 2007. In terms of social history, the patient is a non-smoker. However, the patient acknowledges consuming alcohol, approximately one drink per week. There is no reported family history of diabetes mellitus or renal dysfunction.
The patient was assessed for his renal quality by kidney disease quality of life -36 questionnaire (KDQOL-36TM) and his results were compared with reference to before and after stem cell therapy (1st and 4th month follow-up).
In this case study, laboratory reports and questionnaire data about kidney disease and quality of life (KDQOL-36TM) were recorded before and after 100 × 106 hWJ-MSCs and 100 billion exosome treatments. Both data sets, quantitative (from laboratory reports) and qualitative (from questionnaire), were analyzed using the Statistical Package for Social Sciences (SPSS Inc., Chicago, IL, USA) version 26. The graphical visualization of the means of before and after MSCs was accomplished using the R package ggplot2 because it is declaratively and efficient in creating data visualization based on The Grammar of Graphics. The two-sample paired t-test was applied to test the significant difference between before and after MSC treatment at a 5% significance level. The frequency (n) and percentage (%) were computed from the qualitative data collected through the questionnaire (KDQOL-36TM) filled by the patient before MSCs, after one month of MSC transplantation, and after four months of MSC treatment. Multiple bar charts were also generated to show the consistent improvement in the patient’s quality of life due to the MSC transplantation.
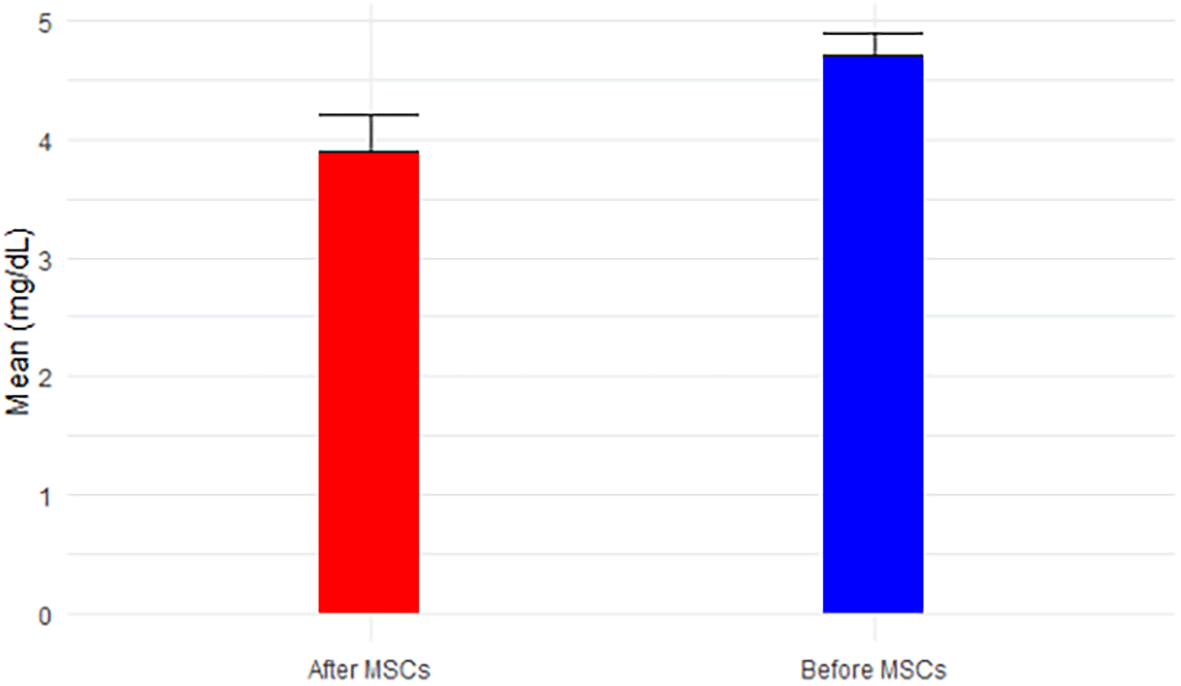
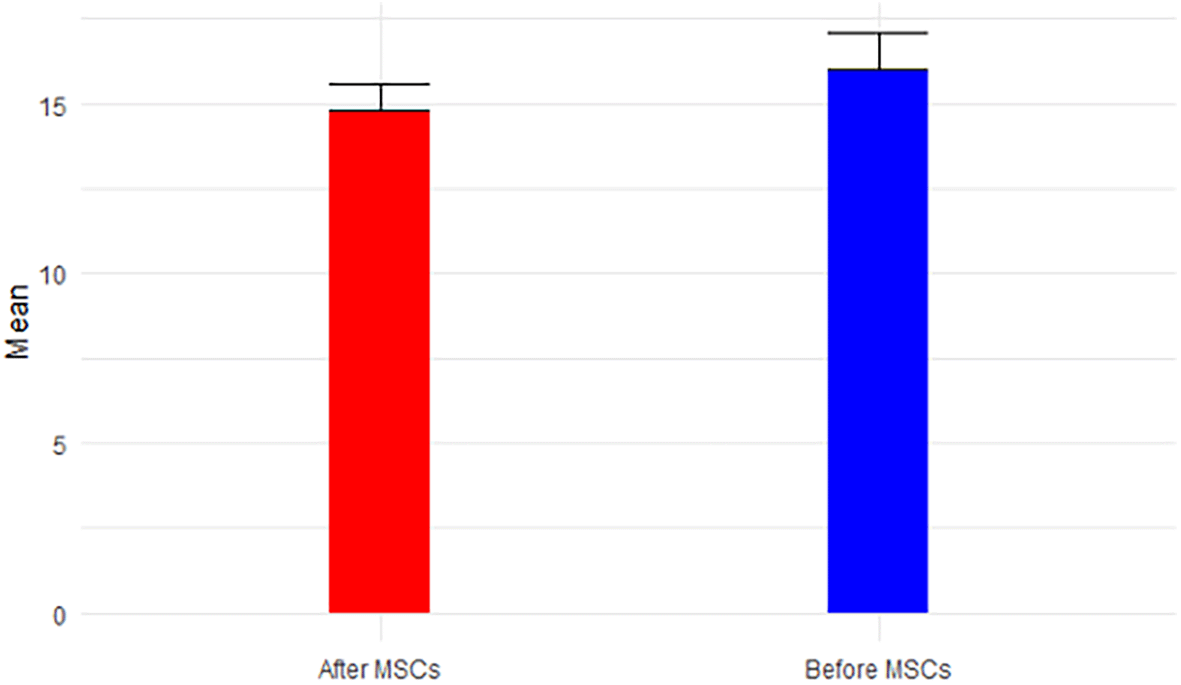
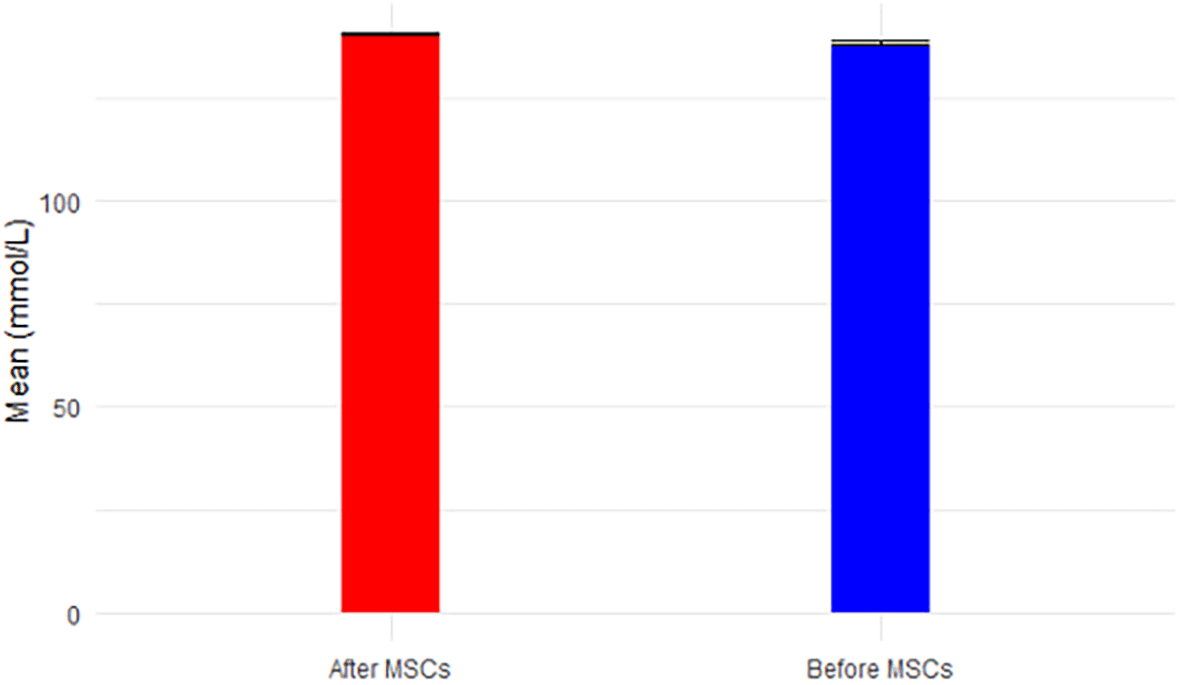
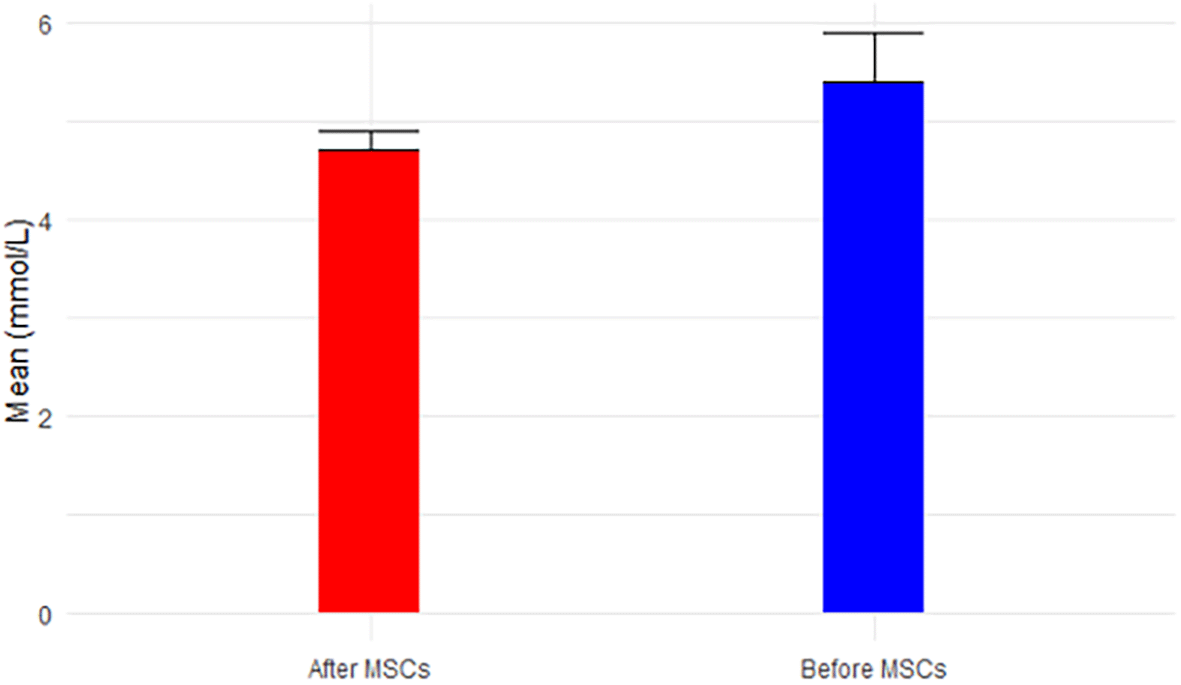
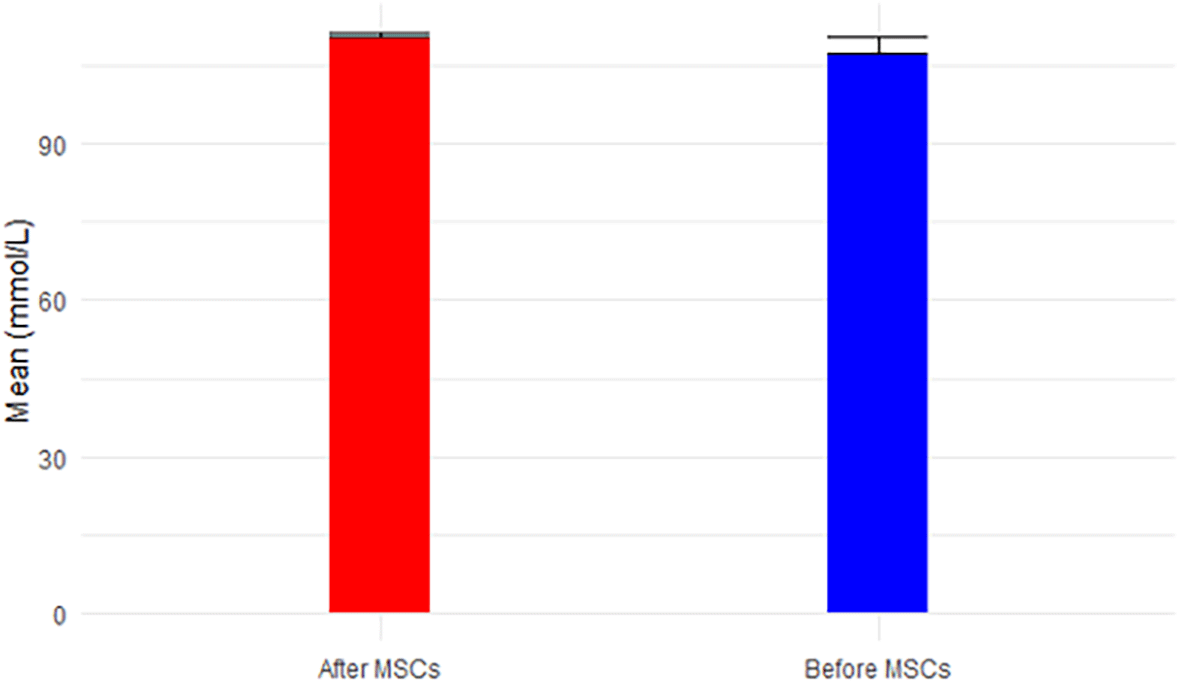
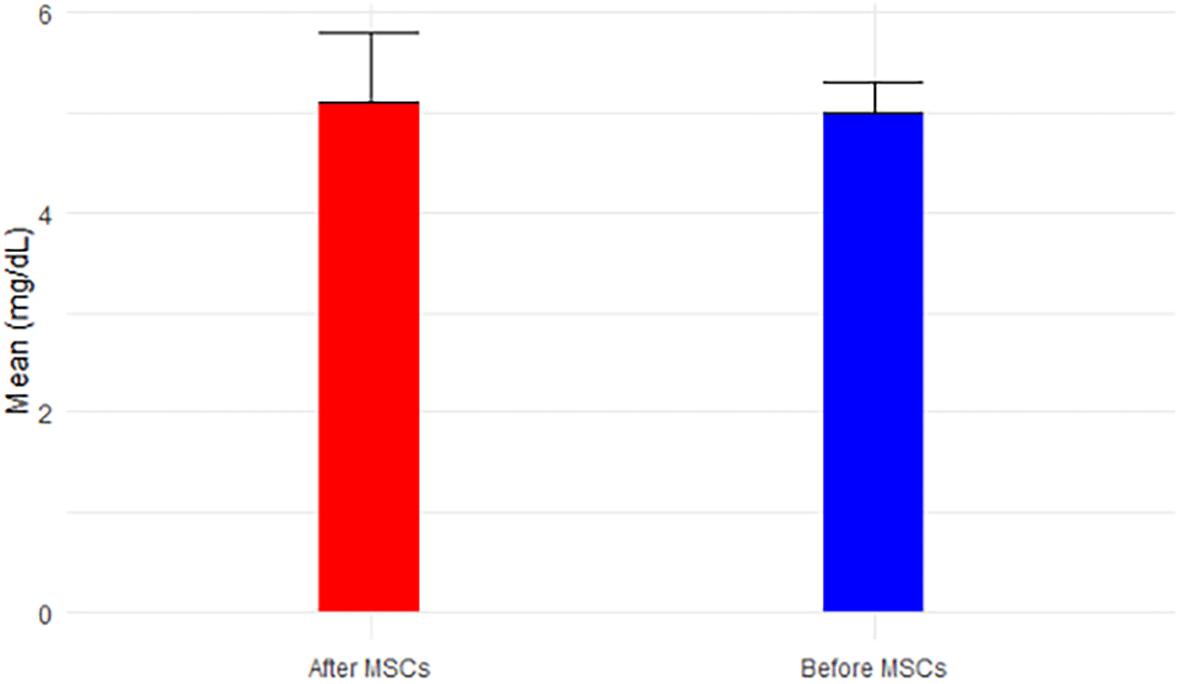
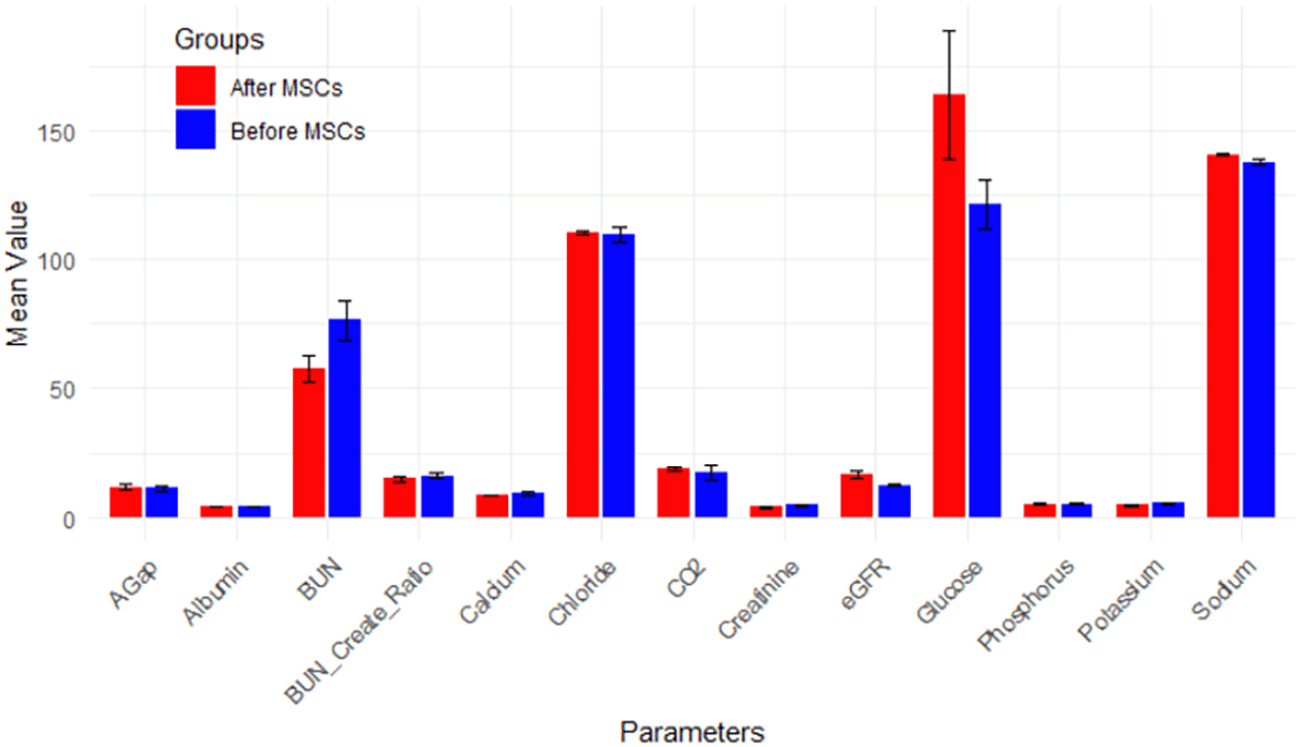
The patient was advised to keep his routine, which included exercise and food, and to report any unexpected reactions he experiences in the next 90 days. The subject underwent the treatment only once, and thankfully, the surgery was safe and did not result in any adverse effects following stem cell transplantation; as we all know, an allergic reaction is one of the most concerning outcomes of MSC intravenous injection. At a 4-month follow-up, hWJ-MSCs implantations improved kidney functioning significantly. The individual was advised to disclose his clinical biochemical analysis whenever he received it during the next 90 days or so. Fortunately, we were able to contact him. Table 1 summarizes his baseline and outcome data at various time intervals. Table 2 provides a comprehensive overview of descriptive statistics, encompassing sample size (n), mean, standard deviation (SD), standard error of mean (SE), 95% confidence interval for mean, minimum, and maximum observations for essential biomarkers such as eGFR, Calcium, Glucose, BUN, Creatinine, BUN/Creatinine Ratio, Sodium, Potassium, Chloride, CO2, AGap, Phosphorus, and Albumin. The means, accompanied by error bars for all parameters, are graphically depicted in Figure 14 to illustrate the efficacy of hWJ-MSC treatment. Meanwhile, Table 3 outlines the results of paired t-tests, evaluating the significance of differences before and after MSCs treatment at a 5% level of significance.
| Parameter | Normal ranges | Results | Follow-up time points (hWJ-MSCs infusion on 1st July 2023) | After 3 doses of Lokelma (10 mg/dose) | |||||
|---|---|---|---|---|---|---|---|---|---|
| Pre-Procedure | July 10, 2023 | July 27, 2023 | August 10, 2023 | August 25, 2023 | October 16, 2023 | October 23, 2023 | October 31, 2023 | ||
| eGFR | CKD (I-V)* | 11 | 22 | 20 | 17 | 19 | 11 | 14 | 15 |
| Calcium | 8.4 – 10.2 mg/dL | 9.1 mg/dL | 8.4 | 8.5 | 8.7 | 8.3 | 8.5 | 8.4 | 7.9 |
| BUN | 6-24 mg/dL | 115 mg/dL | 39 | 36 | 56 | 58 | 71 | 64 | 76 |
| Creatinine | 0.66-1.25 mg/dL > men | 5.1 mg/dL | 2.9 | 3.13 | 3.6 | 3.39 | 5.13 | 4.28 | 4.1 |
| BUN/Creatinine ratio | between 10:1 and 20:1 | 22.5 | 13.45 | 12 | 15.56 | 17 | 14 | 15 | 18.54 |
| Albumin | M: 3.5-5.3 mg/dL; F: 3.8-5.2 mg/dL | 5.0 g/dL | 4.2 | 4.3 | 4.5 | 4.2 | 4.4 | - | 4.3 |
| Glucose | < 117 mg/dL | - | 141 | 329 | 171 | 164 | 119 | 102 | 131 |
| Sodium | 136-144 mmol/L | 139 mmol/L | 141 | 139 | 140 | 140 | 139 | 142 | 141 |
| Potassium | 3.7-5.1 mmol/L | 6.1 mmol/L | 4.1 | 4.1 | 4.7 | 4.3 | 5.5 | 4.6 | 5 |
| Chloride | 97-105 mmol/L | 119 mmol/L | 112 | 105 | 109 | 110 | 108 | 113 | 113 |
| Phosphorous | 3.0-4.5 mg/dL | - | - | 3.5 | 5 | 7 | - | - | |
| CO2 | 23-29 mmol/L | 8 mmol/L | 19 | 23 | 18 | 19 | 18 | 18 | 16 |
| AGap | 4-12 mEq/L | 12 | 10 | 13 | - | - | - | 12 | |
| HbA1c | < 5.7% | 6.5% | - | - | - | - | - | - | 6.9% |
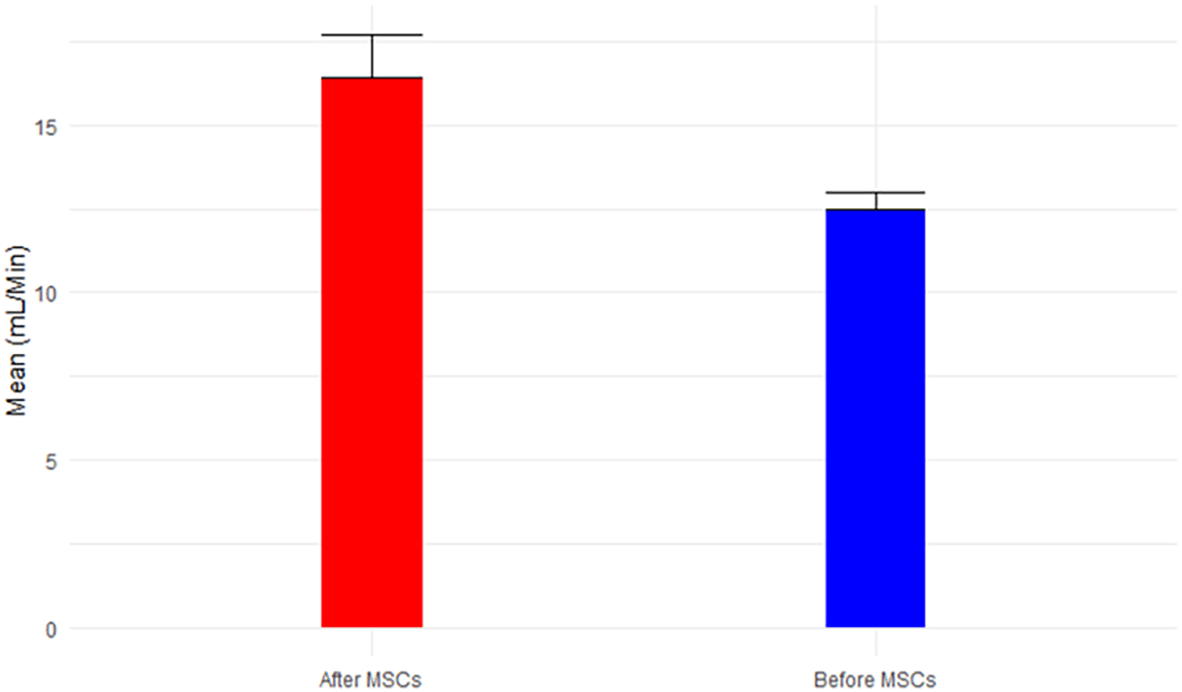
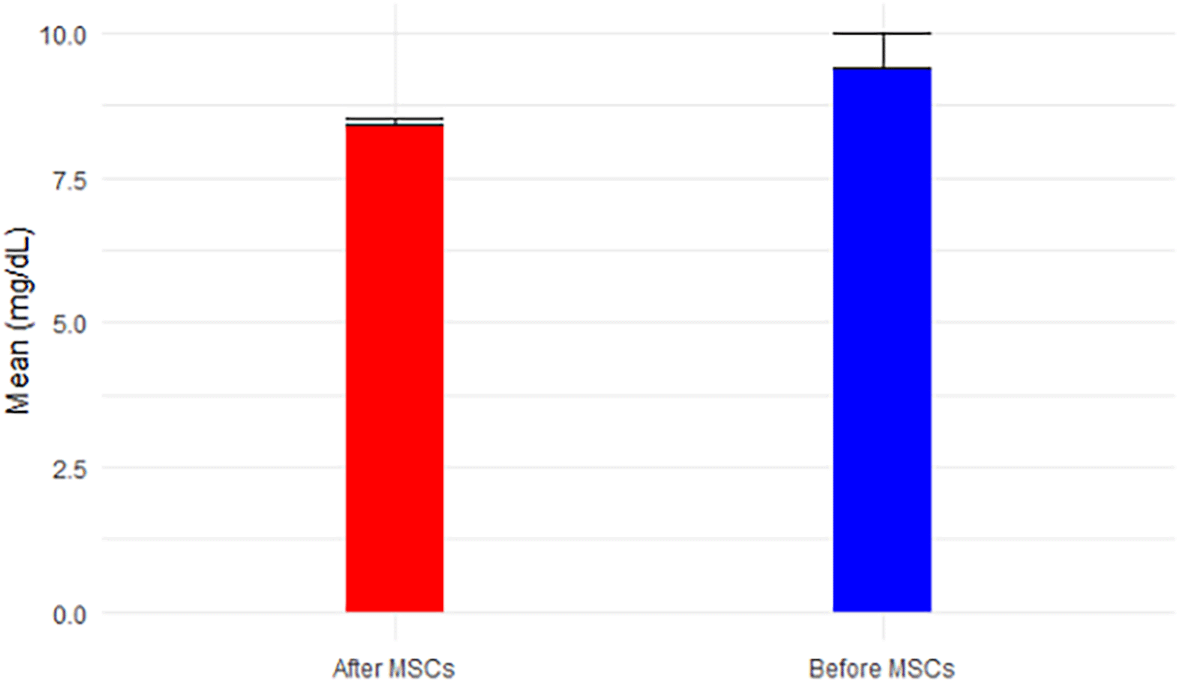
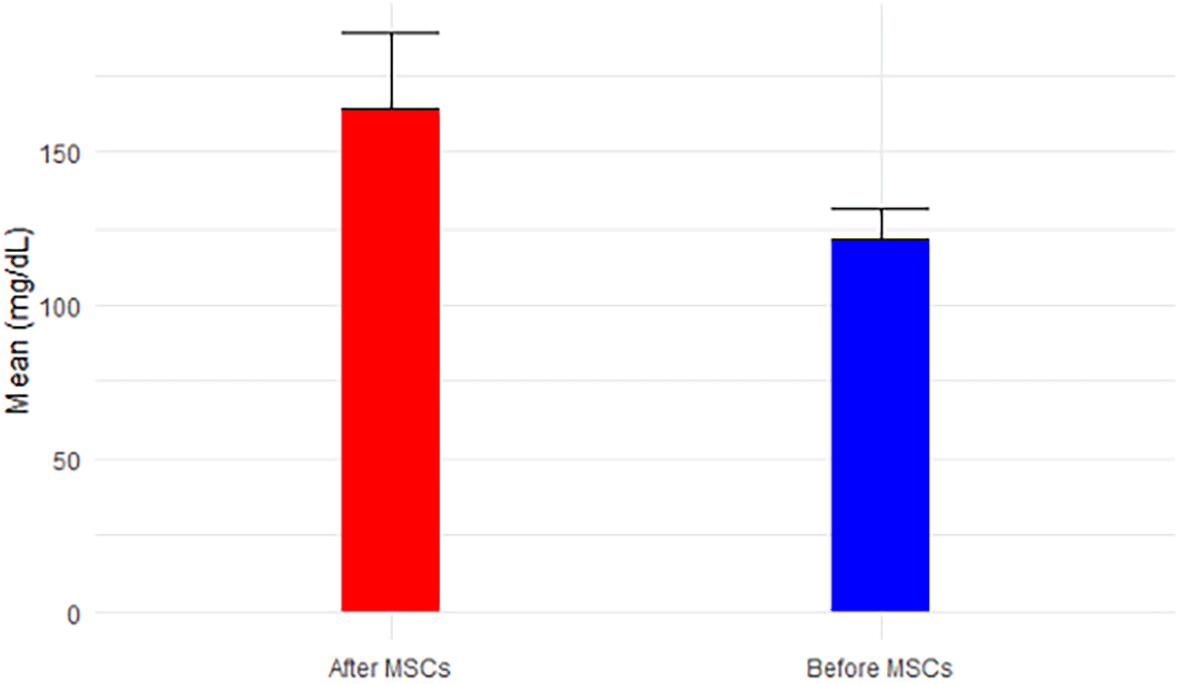
Analyzing the results from Tables 2 and 3 reveals the following insights: eGFR, a key indicator of kidney function, exhibited a mean increase from 12.50 mL/min before MSC treatment (Stage V) to 16.4 mL/min after MSCs treatment (p-value = 0.054 > 0.05). This places the mean eGFR within the range for Stage IV (GFR = 15-29 mL/min), transitioning from Stage V (GFR < 15 mL/min), as depicted in Figure 1. Calcium levels, both before (9.4 ± 1.7) and after treatment (8.4 ± 0.2), remained within the normal range, showcased in Figure 2. However, glucose levels experienced a non-significant increase from 121.38 mg/dL to 163.8 mg/dL post-treatment (p-value=0.146 > 0.05), surpassing the normal range of glucose levels (<117 mg/dL), as illustrated in Figure 3.
While BUN exhibited a non-significant decrease from 76.40 mg/dL to 57.5 mg/dL post-MSC treatment (p-value=0.141 < 0.05), approaching the normal range of 6-24 mg/dL over the short follow-up period, Figure 4 portrays this trend. Creatinine, demonstrating a significant decrease (p-value=0.080 < 0.05) from 4.7 mg/dL to 3.9 mg/dL post-MSC treatment, remained above the normal range (0.66-1.25 mg/dL for men), depicted in Figure 5. BUN/Creatinine ratios stayed within the normal range of 10:1 to 20:1 for both time points, illustrated in Figure 6.
Sodium levels increased significantly post-MSC transplantation (p-value=0.032 < 0.05), maintaining a range within normal levels (136-144 mmol/L), as shown in Figure 7. Potassium levels, while decreasing post-MSC treatment, remained within the normal range of 3.7-5.1 mmol/L, as illustrated in Figure 8. Chloride levels were abnormal both before (109.4 ± 8.3) and after treatment (110 ± 2.9), given the normal range of 97-105 mmol/L, illustrated in Figure 9. CO2 levels, although increasing post-MSC treatment, remained below the normal range of 23-29 mmol/L, as shown in Figure 10. Anion Gap (AGap) levels did not exhibit a significant difference between the two time points, illustrated in Figure 11. Phosphorus levels remained within the normal range (3.0-4.5 mg/dL) for both time points, portrayed in Figure 12. Albumin levels, with a reference range for men (3.5-5.3 mg/dL) and women (3.8-5.2 mg/dL), were (4.2 ± 0.4) before SCT and (4.3 ± 0.1) after MSC treatment, shown in Figure 13.
No statistics were computed for Osmolality, Hemoglobin A1C%, Iron total, and Saturation due to limited data availability. The statistical results offer crucial insights into the impact of MSC treatment on various biomarkers in CKD patients, revealing significant improvements in eGFR, BUN, and Creatinine levels. However, normalization was constrained by the very short follow-up period. Furthermore, certain parameters, including glucose and CO2, exhibited significant changes post-treatment but remained outside the normal range. Three questionnaires collected at different time points aimed to assess the patient’s kidney disease condition and quality of life after MSC transplantation. Limited data collected using KDQOL-36TM and the statistical analysis results presented in Table 4, along with their graphical representation in Table 5 (Exteded data), provide valuable insights into the impact of MSC transplantation on the quality of life of a patient with CKD at different time points.
Before MSC treatment, the patient reported poor general health, significant limitations in moderate activities, climbing stairs, and accomplishment of work or other activities, both physically and emotionally. After one month of MSC treatment, a remarkable improvement is observed, with the patient reporting excellent health, no limitations in activities, and a reduction in pain interference with normal work. The positive trend continues after four months, with the patient maintaining improved health perceptions and minimal interference with social activities. Additionally, emotional well-being shows positive changes, including reduced feelings of frustration and burden, and improved energy levels. The patient also reports less interference with various aspects of life, such as work, travel, and personal appearance. These findings collectively suggest that MSC transplantation contributes positively to the patient’s quality of life, addressing both physical and emotional aspects of CKD. The outcomes underscore the potential efficacy of MSCs in improving health-related aspects and enhancing overall well-being in CKD patients.
MSCs have a unique ability to self-renew and differentiate. These cells can differentiate into osteoblasts, chondrocytes, adipocytes, myoblasts, and neuronal cells (both in vitro or in vivo), which highlights their broader therapeutic potential and applications. They can be obtained from the origins like bone marrow, umbilical cord, umbilical cord blood, periosteum, muscle, thymus, skin, and adipose. The umbilical cord comprises the development of stem cells, which then migrate during embryo development. Umbilical cord-derived stem cells have been recognized as the most convenient origin due to less-ethical concerns. Wharton’s jelly is a continuous skeleton made up of interwoven collagen and tiny fibers that wrap the umbilical cord and contain many myofibroblast-like mesenchymal cells (Han et al. 2013). Umbilical cord MSCs offer multiple benefits, suggesting they could be a valuable source of allogeneic MSCs for cellular treatment, as evidenced by worldwide trends in MSC clinical studies. hUC-MSCs have numerous advantages over bone marrow MSCs, including a wide diversity of sources, ease of procurement, strong proliferation ability, low immunogenicity, and fewer bioethical problems. As a result, hUC-WJ-MSCs are a suitable alternative for bone marrow MSCs. The optimization of hUC-MSC in vitro isolation and growth and the investigation of their biological features pose essential conditions for their application (Figure 16). Umbilical cords come off after birth, enabling easy access to cells, lowering the possibility of contamination, offering no ethical concerns, and being high in MSCs. Additionally, unlike bone marrow MSCs, hUC-MSCs lack fibroblast characteristics and have zero likelihood of growing solid tumors (Peired, Sisti, and Romagnani 2016).
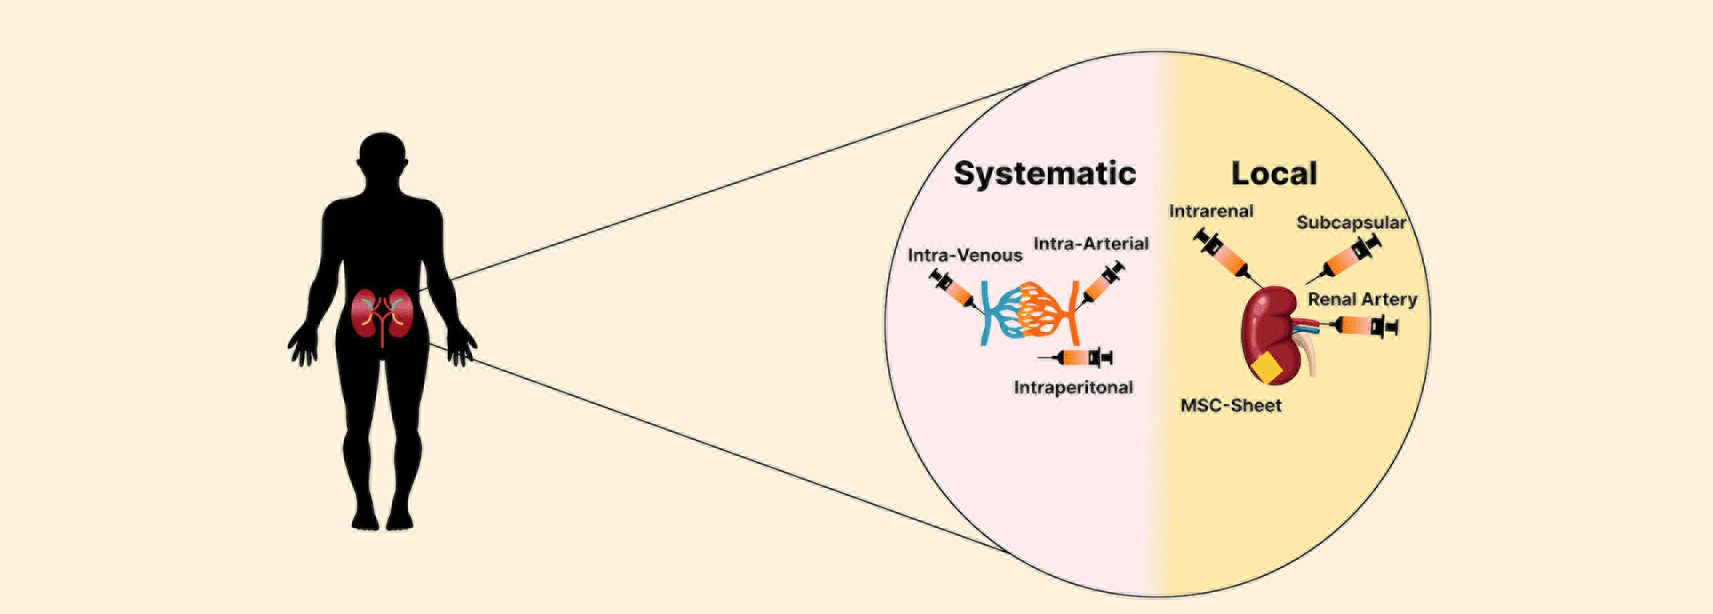
We found 473 preclinical research focusing on the therapeutic effects of MSCs in renal disease published between 2004 and 2023. In these investigations, MSC injection can be classified as systemic or local to the kidney (Figure 15). The intravenous approach is the most accessible method of MSC transplantation. This approach resulted in MSC distribution, predominantly in the lungs, spleen, liver, bone marrow, thymus, kidney, skin, and malignancies (Nakamizo et al. 2005).
Recently, MSCs have been investigated in two clinical trials for DKD. The first human clinical study (NCT01843378) was launched in 2016. This prospective, randomized control clinical trial adopted double blinding, dose escalation, and a sequential method to evaluate the safety and efficacy of the administered product, mesenchymal precursor cells (MPCs), in 30 DKD patients. The patients were given their allotted dose of either MPCs or a placebo (Packham et al. 2016).
Likewise, a second clinical trial, The Novel Stromal Cell Therapy for Diabetic Kidney Disease (NEPHSTROM), was completed in 2023. This phase 1b/2a clinical investigation was conducted across three European sites. Details on this trial can be found at (NCT02585622). Table 6 outlines the basic information of these two trials, including the administration product, route of injection, sample size, potential outcomes, etc. (Perico et al. 2023).
| Ref | MSC source | Age (y) | DM type | Sample size | Dose distribution | No. of injections | Injection method | Results | Phase | Adverse events (n) | Follow up (m) |
|---|---|---|---|---|---|---|---|---|---|---|---|
| Allogenic Trials | |||||||||||
| (Packham et al. 2016) | BM-MPC | Placebo: 74:8±7:9, Lower dose: 70:5 ± 7:4, Higher dose: 64:8 ± 10:1 | T2DM | 30 | Lower Dose: 150 × 106/kg; Higher dose: 300 × 106/kg | One dose | IV | ↔ eGFR, albuminuria ↔ Lipid profile ↔ Blood pressure ↔ Serum C-reactive protein, TNF-α ↓ Serum IL-6 | I/II | None | 12 |
| (Perico et al. 2023) | BM-MSC | Placebo: 54-66, ORBCEL-M: 66-73 | T2DM | 16 | 80 × 106 cells | One dose | IV | ↔ eGFR, ↓ annual mGFR decline in groups. ↔ UACR, ↔Safety, = blood glucose; HbA1c; serum total cholesterol; serum triglycerides; and serum C-reactive protein, ↑ sTNFR1, NGAL, sVCAM-1, Tregs | 1b/IIa | None. | 18 |
| Autologous Trials | |||||||||||
| N/A | BM-MSC | 25-60 | N/A | 7 | 2 × 10⁶ cells/kg | One dose | IV | No treatment-related adverse events were observed during the experimentation phase. In addition, after the 18 months follow up no statistical significance was observed in eGFR (p = 0.10) and SCr (p = 0.24) compared to baseline. In conclusion, subjects with CKD showed a safety profile and tolerability in the one-dose administration of autologous BM-MSCs. | I/II | None | 18 |
Another clinical trial enrolled seven patients with CKD stage IV and administered autologous MSCs at a dose of 2 × 10⁶ cells/kg. These stem cells were obtained through their bone marrow biopsies. The participants underwent follow-ups for one, three, six, twelve, and eighteen months, adhering to stem cell therapy. The radioactive isotope (a scanning technique) was utilized to measure changes or fluctuations in the glomerular filtration rate (GFR). However, no publications are present till the date (NCT0219532). The brief data is reported in the Table 6. The global prevalence of CKD is increasing, owing primarily to an increase in atherosclerosis and type 2 diabetes. A decrease in kidney regeneration capacity defines CKD. Numerous in vivo investigations in CKD animal models show that cell-based therapies have beneficial therapeutic effects. Notably, MSCs produce a variety of growth factors and cytokines that influence encircling parenchymal cells, resulting in tissue regeneration (Figure 16). MSCs have been shown in preclinical models of CKD to preserve renal structure and function since their administration preserved renal function and decreased renal injury in numerous mouse models of diabetic kidney disease, unilateral nephrectomy, and chronic allograft nephropathy. The ability of MSCs to modulate immune cells via paracrine interactions now explains their therapeutic promise. MSCs have been administered successfully in CKD experimental models, including diabetes, hypertension, and chronic allograft nephropathy in recent years (Sávio-Silva et al. 2020). Similarly, Exosomes are rich in microRNAs (miRNAs), which play critical roles in immunoregulation, cell function regulation, and homing pathways.
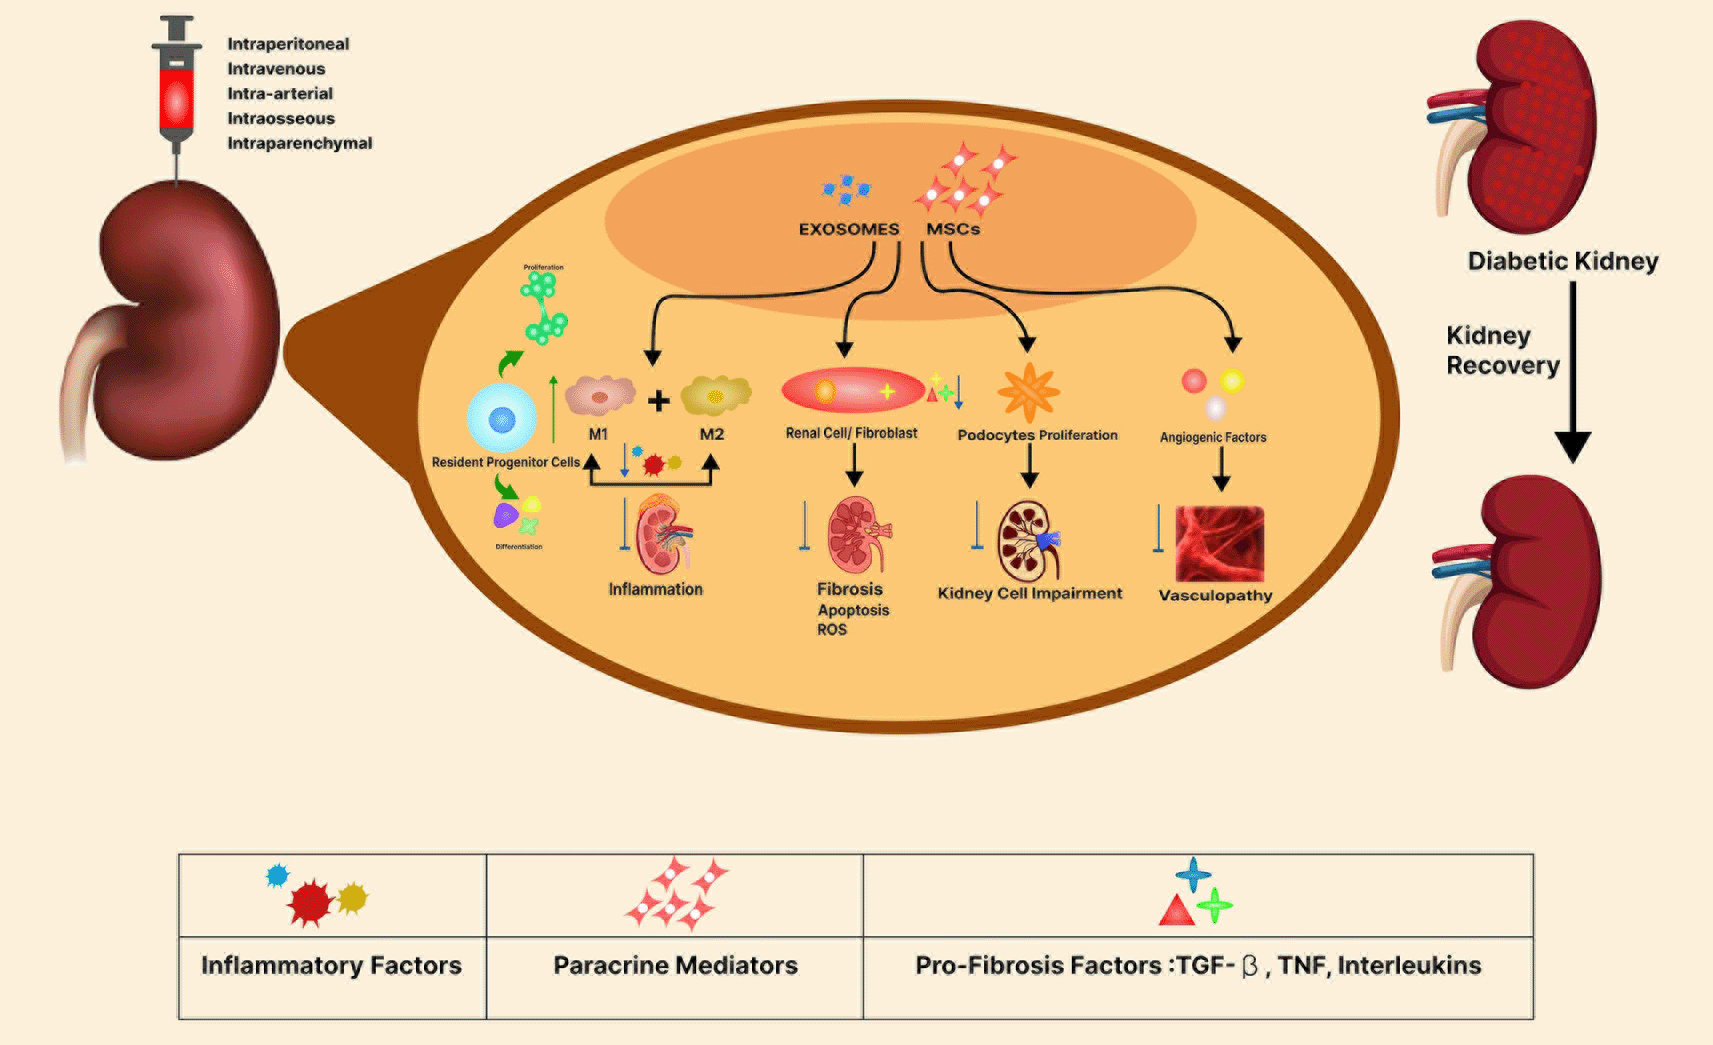
A previously conducted study looked into the methods by which hUC-MSC-derived exosomes reduce inflammation and improve damage repair in diabetes-induced CKD development. HUC-MSC-derived exosomes reduce inflammation, decrease the NLRP3 signaling pathway, and improve kidney injury in both in vitro podocyte cells and diabetic rats. Exosomes may offer a promising cell-free therapy method for DKD, according to the study, which identifies miR-22-3p as a critical role in this process (Wang et al. 2023). Therapies or treatments that would help to prevent the progression of diabetic kidney failure to End Stage Renal Failure (ESRF) would be extremely beneficial in both clinical and economic terms. Allogenic MSCs have anti-inflammatory, immunomodulatory, and paracrine attributes, making them a potential candidate therapy for chronic medical conditions (Figure 16).
This is the first human case study that utilized allogeneic human umbilical cord Wharton’s jelly-derived mesenchymal stem cells and exosomes to treat chronic kidney disease stage V caused by type 2 diabetes with a short follow-up period of 4-months. The case was explored to assess the safety and efficacy of a single infusion of hWJ-MSCs and Exosomes intravenously. The infusion was well tolerated, and the patient reported no adverse events. The theoretical concerns of allogeneic cell therapy include allergy risks from excipients such as fetal calf serum and immunogenic responses to human antigens (donor HLA) were not observed. The absence of acute immunological responses to unmatched allogeneic hWJ -MSCs and exosomes is of particular significance, especially for patients who might consider kidney transplantation in the future. Repeated administration of this protocol may improve eGFR or other renal functionalities. Future studies may evaluate the safety, tolerability, and efficacy of single and repeat dosages of MSCs.
The patient’s renal health witnessed a remarkable turnaround following stem cell therapy. Despite initial challenges, such as a decline in eGFR, elevated BUN, Creatinine levels, and an unfavorable BUN/Cr ratio, the subsequent improvement highlighted the potential effectiveness of stem cell treatment in addressing and reversing kidney-related issues. This positive response suggests the promising impact of stem cell therapy on renal function, emphasizing its potential as a valuable intervention for individuals facing similar complications. Initial symptoms, such as impaired typing speed and speech difficulties, vanished, indicating a positive response to the stem cell intervention. The overall well-being of the patient seemed promising. Throughout the patient’s health journey, a decline in eGFR prompted the individual to engage in self-medication with torsemide, resulting in dehydration and kidney stress. Subsequent medical advice led to using Lokelma, which positively impacted potassium levels. This incident highlights the risks associated with unsupervised health management, stressing the importance of avoiding self-medication in conventional and regenerative medicine. Despite facing challenges, the patient’s overall quality of life has improved, with a renewed focus on diabetes management and renal health. The adoption of insulin and additional measures helping him in regaining control over blood glucose levels. Thus, we concluded that the potential of allogenic hWJ-MSCs and exosomes could be a possible treatment option for such kind of diseases. Future research should delve into the mechanisms of MSCs in CKD, exploring factors like disease stage, repeat dosages, injection methods, and other variables.
There are a few limitations to our case study. First, we studied only one patient, and it is a small sample size to predict the statistically significant effects on renal function. Second, the 16-week follow-up period used to analyze the long-term effects of a single infusion is insufficient for evaluating a chronic condition with complicated variability and progression. Lastly, more lab profiles are needed to make a full assessment of the patient’s health status easier. The study also recognizes the patient’s participation in self-medication practices, introducing potential confounding factors that could influence the observed outcomes. Recognizing and overcoming these limitations is critical for a nuanced interpretation of the study’s findings, and it highlights the need for additional research with more extended follow-up periods and a larger dataset.
The study evaluated the safety and possible efficacy of a single intravenous dosage of hWJ-derived MSCs and exosomes in a person with Type-2 diabetes-induced chronic kidney disease (CKD), a major global health concern. In the renal profile, the operation was well tolerated and proved to be beneficial. However, the study has a few flaws, the most notable of which is the very short follow-up period. This limitation makes it difficult to thoroughly understand the long-term impact and sustainability of the reported effects.
No data associated with this article.
Figshare: Case report- Allogenic Wharton’s jelly mesenchymal stem cell and exosome therapy are safe and effective for diabetic kidney failure. https://doi.org/10.6084/m9.figshare.25532989.v1
The project contains the following underlying data:
Table 5: Graphical Representation of the KDQOL-36 TM questionnaire after MSCs Transplantation. This table presents the statistical analysis of the questionnaire that is commonly used to assess the overall quality of life of renal disease patients. The bar chart depicts the outcome of mesenchymal stem cell transplantation with before, 1st month and at 4th month follow-up.
Data are available under the terms of the Creative Commons Attribution 4.0 International license (CC-BY 4.0).
The authors appreciated Mr. Munim Qazi for providing great help with the figures in this manuscript.
| Views | Downloads | |
|---|---|---|
| F1000Research | - | - |
|
PubMed Central
Data from PMC are received and updated monthly.
|
- | - |
Is the background of the case’s history and progression described in sufficient detail?
Partly
Are enough details provided of any physical examination and diagnostic tests, treatment given and outcomes?
Partly
Is sufficient discussion included of the importance of the findings and their relevance to future understanding of disease processes, diagnosis or treatment?
Partly
Is the case presented with sufficient detail to be useful for other practitioners?
No
Competing Interests: No competing interests were disclosed.
Reviewer Expertise: Veterinary Medicine, Physiology, Hematology, Neuroscience, Mesenchymal Stem Cells, Chronic Kidney Disease, Endoplasmic Reticulum Stress
Is the background of the case’s history and progression described in sufficient detail?
Partly
Are enough details provided of any physical examination and diagnostic tests, treatment given and outcomes?
No
Is sufficient discussion included of the importance of the findings and their relevance to future understanding of disease processes, diagnosis or treatment?
Partly
Is the case presented with sufficient detail to be useful for other practitioners?
No
References
1. Thompson M, Mei S, Wolfe D, Champagne J, et al.: Cell therapy with intravascular administration of mesenchymal stromal cells continues to appear safe: An updated systematic review and meta-analysis. EClinicalMedicine. 2020; 19. Publisher Full TextCompeting Interests: No competing interests were disclosed.
Reviewer Expertise: Nephrology, CKD, AKI, Diabetes, Stem cells
Alongside their report, reviewers assign a status to the article:
| Invited Reviewers | ||
|---|---|---|
| 1 | 2 | |
|
Version 1 24 Apr 24 |
read | read |
Provide sufficient details of any financial or non-financial competing interests to enable users to assess whether your comments might lead a reasonable person to question your impartiality. Consider the following examples, but note that this is not an exhaustive list:
Sign up for content alerts and receive a weekly or monthly email with all newly published articles
Already registered? Sign in
The email address should be the one you originally registered with F1000.
You registered with F1000 via Google, so we cannot reset your password.
To sign in, please click here.
If you still need help with your Google account password, please click here.
You registered with F1000 via Facebook, so we cannot reset your password.
To sign in, please click here.
If you still need help with your Facebook account password, please click here.
If your email address is registered with us, we will email you instructions to reset your password.
If you think you should have received this email but it has not arrived, please check your spam filters and/or contact for further assistance.
Comments on this article Comments (0)