Keywords
Household, Resilience, Determinants of resilience, Food Insecurity, Shock, Stress
Household, Resilience, Determinants of resilience, Food Insecurity, Shock, Stress
Food security is a multidimensional concept that is currently the political, economic, and social agenda of development. Its emergence dates back to some 50 years ago, in the 1970s, during 1996 world Food Summit (FAO, 2003). Currently, it is claimed that it has more than 200 definitions and many indicators of measurement (Maxwell and Smith, 1992). Definitions and conceptualizations of food security have undergone a series of modifications. However, food security is commonly understood as a condition where all people at all times have physical, economic, and social access to sufficient, safe, and nutritious food that helps to lead an active and healthy life (FAO, 1996). Basically, it can be conceptualized and examined at multiple levels (Anon, 2015).
Food insecurity and undernourishment remained a burning development agenda in an ever uncertain world. A significant proportion of the world population is suffering from increasing hunger. In the year 2019, more than 820 million people were suffering from hunger (FAO et al., 2019). Its severity increasing over time, 828 million people were hunger in the year 2021, 924 million people were food insecure. Even an expected 670 million people will still be suffering hunger in the 2030 (FAO, 2022). Among 795 million food insecure people in 2015 worldwide, Africa comprises 28.05%, however, Sub-Saharan Africa constitute 95% of food insecure people in the whole Africa (USDA, 2022). Increasing climate change and resulting drought, successive shocks due to COVID-19 pandemic and war between Ukraine and Russia raised food insecure people to 123 million in 2022 (Baptista et al., 2022) take attributes for increased food insecurity problem in SSA.
Food insecurity is a historical human challenge in Ethiopia since 1970s (Devereux, 2000; Kaluski et al, 2001; FAO, 2010). However, food insecurity and malnutrition are still a primary concern of Ethiopia. Currently, an estimated 20.1 million people need humanitarian food support, 7.4 million children and women were undernourished, malnutrition 41 percent of children between 6-59 months undernourished (WFP, 2023). For this, conflict during 2020-2022 in the northern part and associated displacement and historic drought in years 2020-2023 in the south and southeast part of the country has attributed to growing food insecurity (WFP, 2023; FWS NET, 2023). Hunger and malnutrition mainly caused by a combination of conflict and drought. Globally, conflict takes biggest driver of malnutrition where 70% of world hunger and food insecure people are found in areas affected by war and violence like; conflict of Ukraine and Russia, and conflicts in the northern part of Ethiopia (WFP, 2023). Climate change induced shocks (drought) are another important contributor next to conflict that destroy lives (human, crop and livestock), and decline people’s ability to feed them. Global market failure also caused raise to fertilizer price and declined food production and resulted in food price inflation. In Africa, population pressure, diminishing landholding size and farm productivity, limited adoption of technology, recurring droughts, conflict, rising food prices, and epidemics affecting humans and cattle considered as factors that attributed for food insecurity problem in Africa (FAO, 2015; Meskerem and Degefa, 2015). On the other hand, Ethiopia's food insecurity issue is linked to the country's increased reliance on rain-fed agriculture, drought, population pressure, and irregular rainfall (MoARD, 2009). Particularly, southern parts of Ethiopia are also encountering food insecurity in the form of chronic and seasonal forms despite its suitable and diverse agro-ecology. The area is highly exposed to soil erosion due to its mountainous topography. Particularly, the study area Chencha district is highly threatened by different forms of soil erosion (sheet, rill and gully) (CWARDO, 2014). The area is highly vulnerable to long-term seasonal food insecurity that lasts from April to May, and September to November (Tadesse et al., 2019; Abera et al, 2019). Declining landholding size, population pressure, drought, crop disease and pests, livestock and human disease, seasonal fluctuation, and resulting erratic rainfall are major causes of food and livelihood insecurity in the area (Engdawork, 2012; Shambel, 2017). To withstand this challenge, people practice income diversification, cultivating endogenous drought-resistant crops (Enset and Qoltso), weaving, and rural-urban migration (Abera, 2014; Abera et al., 2019). But it lacks empirical studies conducted on the status and determinant factors affecting household capacity to withstand food insecurity shocks and stresses (resilience).
Resilience is an important development discourse which has emerged as a novel and quickly expanding development topic in the past few decades (Bahadur et al, 2015; Winderl, 2014). It is defined as the capacity of a system to resist, absorb, accommodate to and recover from the effect of the livelihood shocks and stresses without being incurring irreversible damage on the structure and functions of a system (Olamide Bisi-Amosun & Lafayette, 2019). Resilience is a multidisciplinary concept, but, for the first time the work of Alinovi et al. (2009) has applied the concept in the context of food security analysis. However, its application depends on unit of analysis, type of shock, answering the question of resilience of what and resilience to what (Alinovi et al., 2009). Resilience of households to food insecurity depends on livelihood options available (assets, activities, services) to the household and its ability to manage. Unlike vulnerability, resilience analysis focus on measuring capacity of households to withstand and recover from expected shocks and stresses (Alinovi et al., 2009).
However, resilience concept in food security study is newly emerging (Alinovi et al, 2009) and conceptualized as ability of household to maintain certain level of wellbeing (food security) in face of shocks and stresses. Basically, resilience analysis employs two data types; time series longitudinal data (longitudinal dynamics) and cross-sectional data (a static or current time) or a point in time data (Alinovi et al, 2009; Alinovi et al., 2010; Ciani & Romano, 2013; Adane, 2018 and Gebrerufael, 2019). However, analyzing longitudinal dynamics of resilience faces challenges of availability and access of time series data. As a result, very insignificant studies have used longitudinal data for resilience analysis (Alinovi et al., 2010; Mulat and Negussie, 2013). However, majority of resilience studies employ cross-sectional one time data (static data) (Carter et al., 2006; Keil et al., 2008; Adane Atara, 2018; Gebrerufael, 2019; Debebe, 2021). Using four building blocks, Alinovi et al. (2010) found that households' resilience to food insecurity varied among different sub-regions. Another study at Kenya using longitudinal from 2005-06 years data found large-holders are most resilient while pastoralist livelihood groups were found least resilient (Alinovi et al., 2010). While Ciani & Romano (2013) found smallholders and agricultural wage workers were less resilient than other livelihood groups in Nicaragua. The resilience study at Boricha woreda Sidama region found 61% of respondents as non-resilient and inter-livelihood zone variation (Adane Atara, 2018). Whereas Gebrerufael (2019) confirmed that half of the households in Ahferom woreda in the Tigray region were resilient, and the remaining half were non-resilient to food insecurity.
In a comprehensive evaluation of relevant empirical literature, the majority of studies focused on the ability of agriculture-based livelihood systems. This study, however, concentrated on assessing the resilience capacity of households that employ traditional weaving and spinning as a source of income for their livelihood. Though it is the most well-known alternative livelihood option in the country after agriculture, little research has been done on the benefits of weaving or its drawbacks. In Chencha district, the designated research area, the current study is novel because resilience studies there are the first of their sort. The current study examines the determinant factors of weaving-based households' resilience to food insecurity in the Chencha District using the revised version of the Alinovi (2010) resilience paradigm. Conceptualizing and analyzing household resistance to food insecurity within the context of sustainable livelihood thinking has also been shown to be an interesting approach. It differs from previous empirical research, though, in that it (1) examines how livelihood diversification affects household resilience and (2) concentrates on looking at weaving as a means of enhancing household resilience against food insecurity.
Informed written consent from respondents was obtained in order to conduct the data collection process for interviews, focused groups, and surveys. Ethical approval was granted by the Academic Commission of Addis Ababa University (approval number: 029/01/2023) on October 20, 2023. The Institutional Review Board (IRB) has three members: Amare Bantider (PhD), Adimasu Zerihun (PhD), and Teshome Tafese (PhD).
The study was conducted in Chencha district aiming to identify the determinants of household resilience to food insecurity shocks. The district is one of the ten woredas found in Gamo zone, Southern Ethiopia. The area is astronomically located between 6° 8’ 55” and 6° 25’ 30” North latitude and between 37° 29’ 57” to 37° 39’ 36” East Longitude with an elevation ranging from 1180 to 2732 meters above sea level. It is located about 521 kilometers South of Addis Ababa, the capital of Ethiopia and 37 kilometers away from Arba Minch, the administrative town of Gamo zone. The area has two agro-ecological zones, Dega (Highland) and Woyne Dega (midland) that account 82% and 18%, respectively. Currently, the district is shared by 33 kebeles and 3 transition towns (Figure 1). The district’s Agriculture and Natural Resource Office reports shown that the area is classified as 65% mountainous, only 13% plane, 5% gorges, and 17% sloppy lands (Essa, 2019). It is bordered by Arba Minch Zuriya woreda in the South and Southeast; Mirab Abaya in the East; the newly separated Kogota district in the North and Dita in the West. The district is one of the densely populated areas of the region with a 144, 918 people on 20,290 hectares of land with a population density of 388 persons per a square kilometer (CSA, 2011). From this, female population account 54.9 % of the population. The area receives bi-modal rainfall in the two production seasons of Tseday (spring) February to April and in the Meher (summer) production seasons in the months of June to September.
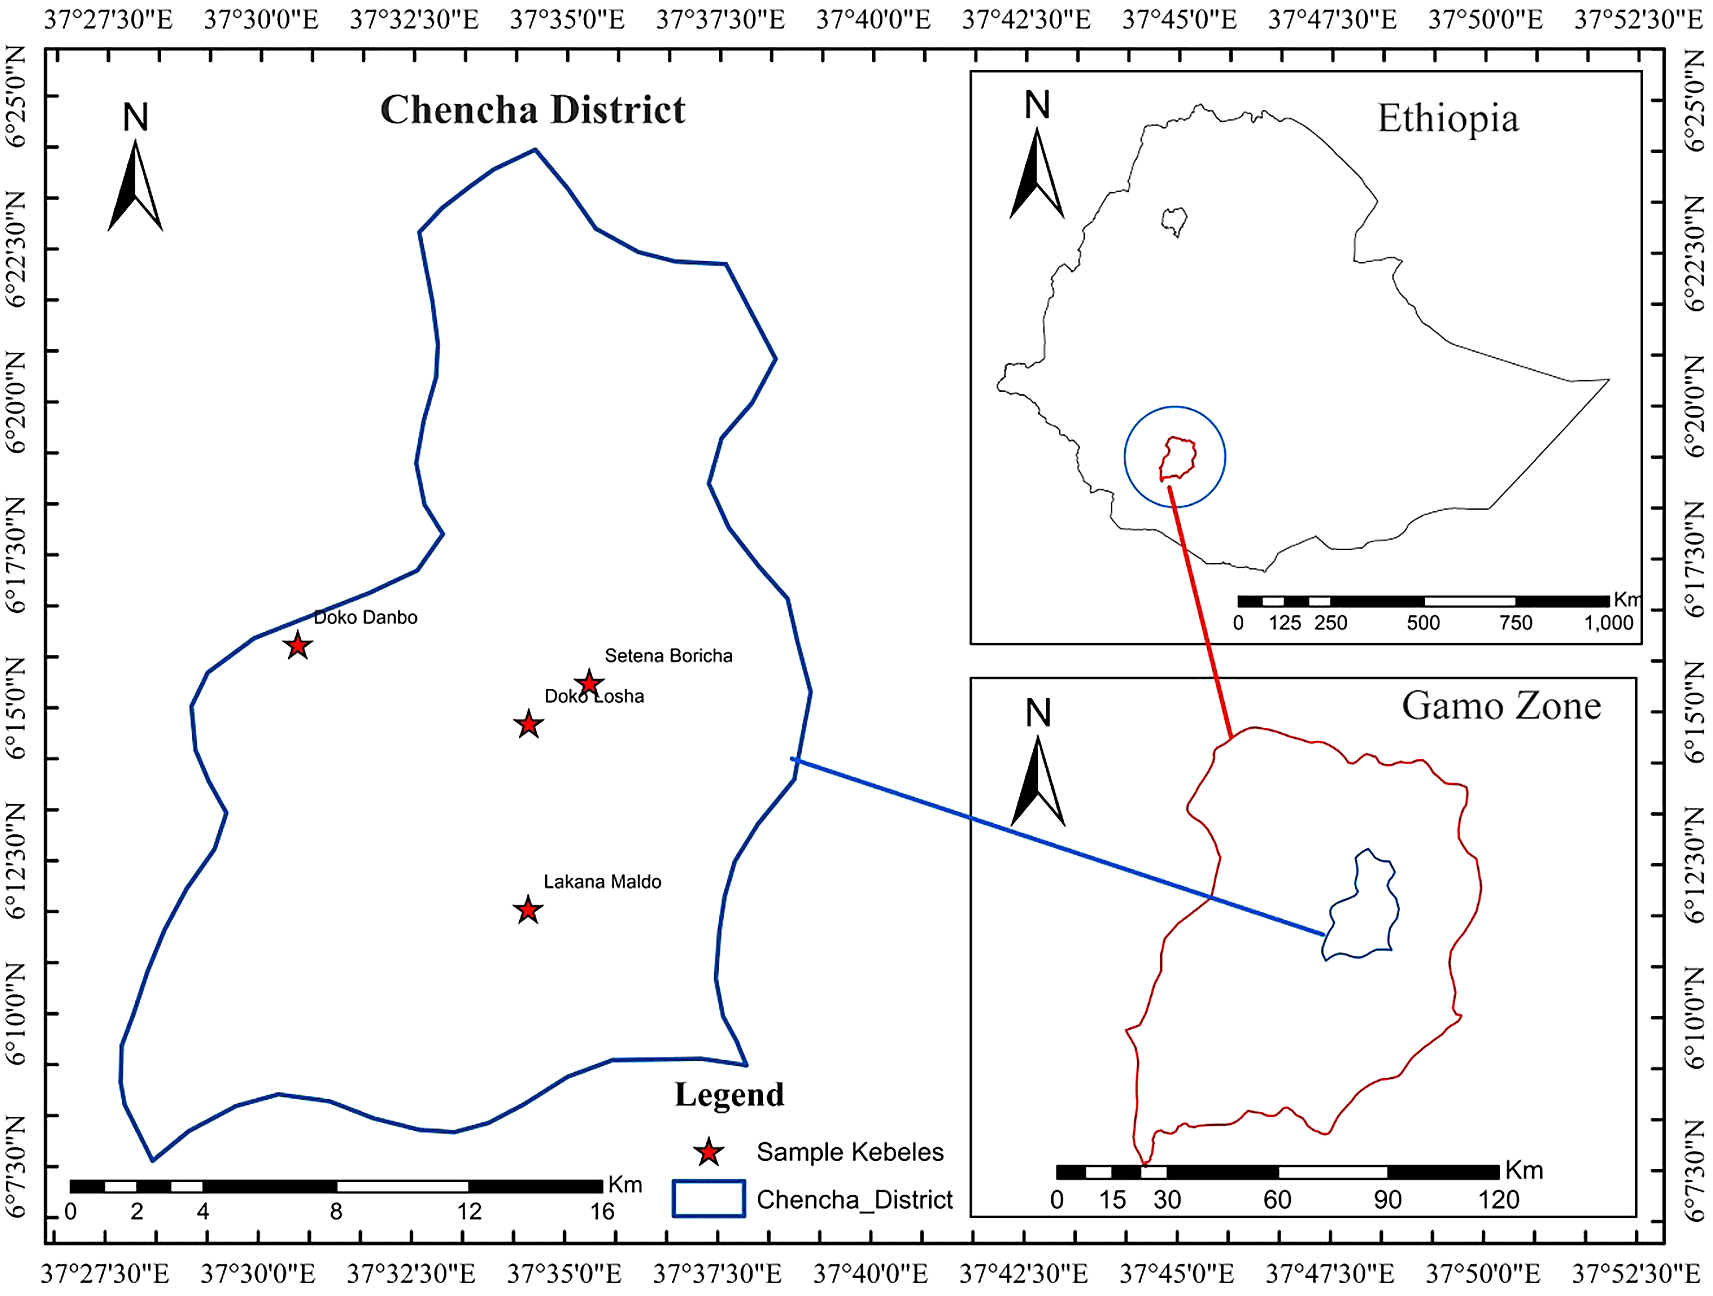
Source: Ethiopia Mapping Agency 2007 Shape file.
Rain-fed subsistence agriculture is the main means of people livelihood. However, the area faces food shortage of 3-6 months in a year (CWARDO, 2014). This could be attributed to the high population growth, declining landholding size, severe land degradation due to continuous cultivation and steep slope, erratic rainfall, drought, crop disease and pest infestation, food price inflation, and weak market linkage due to road access problem. Due to shortage of grazing land; livestock holding and production pattern was also very minimal and homestead based. As a result, the people in the area are prone to both chronic and seasonal food insecurity. However, people adopt different types of mechanisms to withstand livelihood stress and shock. These include; livelihood diversification (agricultural intensification and out of farm), Enset production, migration, weaving, support from GOs and NGOs. Based on this reason, this study was designed to examine how resilient (withstand, react to, respond to and recover from) the households are to food insecurity causing shocks, and identify determinant factors that affect household resilience to various food insecurity inducing shocks and stresses. Households were used as a target group or unit of analysis who practice weaving as their livelihood income sources.
Both qualitative and quantitative data were employed in this investigation. To better understand the nature of livelihood conditions, food security, external shocks and pressures, and household resilience to food insecurity, quantitative and qualitative data from primary and secondary sources were acquired. Households, key informants, and focus group discussants were among the primary data sources used. Secondary data were gathered from national statistical reports, annual office reports, published and unpublished documents on livelihood conditions, food security status, food insecurity causing shocks and stresses, coping strategies, and potential sources of household resilience to food insecurity and its determinants in the area.
Chencha district is one of the food insecurity stressed areas found in southern Ethiopia in general and Gamo zone in particular. Food insecurity is exacerbated by fragmented and small landholdings, deteriorating soil fertility owing to protracted repeated agriculture, high population density, recurrent drought, irregular rainfall, and other factors. As a result, chronic and seasonal food insecurity is a critical development challenge in the area. However, the area has long been praised for its ability to endure the country's historical food crisis shocks without resulting in life losses (Desalegn, 1996; Abera et al., 2019). However, the causes and key sources of its ability to endure food instability and famine have yet to be empirically supported. In the Chencha district, weaving and spinning considered as the second most important livelihood activity following small-scale agriculture which complement the food and income shortage households encounter due to very low agricultural production. Weaving and spinning are regarded as the second most significant livelihood activity in the area, behind small-scale agriculture, and help to supplement the food and income shortfalls that households face due to low agricultural production. As a result, this study was designed to investigate household resilience to food insecurity, with weaving-based households as a target group assuming weaving as an important livelihood income alternative and household resilience to food insecurity.
The study used a multistage sampling technique to choose the study district and sample households. In the first stage, the Chencha district was purposefully chosen where weaving is the most prevalent livelihood activity in the zone in particular and the country in general. In the second stage, four kebeles were selected where weaving is dominantly practiced by running scatter plot for all kebeles in terms of the numbers of households involved in weaving activity. In this regard, Doko Danbo, Doko Loosha, Lakana Maldo and Setena Borcha were selected as a sample kebeles. The sample respondents were chosen in the third stage using systematic random sampling techniques. Finally, the sample size of respondents was determined using the following formula proposed by Israel (1992):
Where,
N = the total population size,
n = the sample size and
e = the level of precision.
In this study, N = 2485 and e = 0.05 n = 303. Then, the representative sample respondents were identified based on probability proportion to population from four kebeles using systematic random sampling technique per each 8 household interval. The study data were collected in 2022 from 303 sample rural households, 20 in-depth key informants, 6 focus group discussions, and substantiated by field observations and secondary document analysis.
Types and methods of data collection
The study used cross-sectional data collection methods that included quantitative and qualitative data collection methods. This study relied on both primary and secondary data, which were quantitative and qualitative in character. As significant data gathering methodologies, household surveys, focused group discussions (FGD), key informant interviews, field observations, and secondary source analysis were used.
Key Informant Interview
Before conducting household surveys, intensive key informant interviews were employed with food security and early warning officers, health, education, social affairs, and natural resource management officers. Accordingly, 20 in-depth Key Informant Interviews (KII) were held with household heads, kebele leaders, experts in agricultural extension, natural resource management experts, health extension, food security and early warning, water supply, and job creation and enterprise at kebele, woreda, and zone levels. Basically, the issues elaborated include: livelihood income sources in the area; food supply and adequacy; shocks and risks; vulnerability contexts; access to and availability of basic livelihood options and services; and challenges.
Household survey
Household survey has been conducted using semi-structured questionnaires. It has addressed the demographic, socio-economic, livelihood strategies, food security, household access to assets and basic services, livelihood shocks and stresses, challenges and household resilience sources that affect livelihood conditions of the sample households. The survey process has been managed by using trained enumerators under close follow up of the researchers. The household survey data collection was done on March and April, 2022 G. C from 303 weaving-based households.
Focused Group Discussion (FGD)
Six Focus Group Discussions were held on March 10-20, 2022, to supplement the data acquired from the household survey, two in Doko Danbo and two in Doko Loosha kebeles and one each in Setena Boricha and Lakana Maldo kebeles based on population size. It contains 6-10 people who have extensive knowledge in the area's livelihood conditions and accompanying difficulties. Members of the group discussion comprised elders, women, and teenagers, taking into account the group's diversity and managing the participation of all members. The FGD addressed problems such as livelihood possibilities, constraints, food security conditions, livelihood shocks and stress, and potential sources of household resistance to food insecurity in the area.
Field observations
Transect walks were conducted throughout the research locations to observe people's livelihood patterns as well as the current opportunities and difficulties. Secondary data were gathered by analyzing numerous published and unpublished secondary documents. The household survey was conducted by researchers and professional enumerators.
Data analysis techniques
Data collected through household survey, focus group discussion, key informant interview and secondary document analysis were analyzed using relevant data analysis techniques. The main subject of this study, the household resilience to food insecurity problem majorly addressed with quantitative data collected through household survey. Thus, household resilience is examined through resilience analysis technique following RIMA-II approach (FAO &WHO, 2022). For this end, the data were analyzed by adopting quantitative data analysis model using multivariate analysis model. Among different multivariate analysis techniques, particularly principal component analysis method is applied. Various socio-economic explanatory variables (dummy, categorical and continuous) were used to examine their effects across the categories of household resiliencies (Tables 2, 3 & 4). Chi-square test is used to examine whether there exists meaningful difference among meaningful significant difference exists in various categorical variables across resilience categories of (non-resilient, moderately resilient, resilient and highly resilient categories). On the other hand, the existence of significant mean variation of continuous variables throughout the resilience categories was determined by using one-way ANOVA techniques.
On the other hand, qualitative data types collected through FGD, KII and field observation were analyzed by narrative inquiry, content analysis and interpretation. However, the detail of quantitative data analysis model was described in the following parts.
Techniques of determining household resilience to food insecurity
Household resilience conceptualized as the ability of a household to maintain a certain level of well-being (i.e., being food secure) by withstanding shocks and stresses and reorganizing while undergoing change so as to still retain essentially the same function, structure, and feedback (Alinovi et al., 2009; Daie & Woldtsadik, 2015). It can also be defined as a system's capacity to respond positively to surrounding changes, maintain, or improve function based on available options like assets, activities and services (Frankenberger, T., 2012). Household resilience is a complex system thinking that deals with vulnerability and changes considering households as basic components in a food system (Béné C.et al, 2016). In this regard, households are considered as main decision makers and main adaptive component having continuous interaction with its surrounding environment (Guyu & Muluneh, 2015; Dhraief et al., 2019). Regarding analytical techniques; resilience is a latent variable that cannot be directly observed. Hence, it is determined from covariate effects of hypothesized potential dimensions that are latent variables themselves (Alinovi et al., 2009). Following RIMA-II approach suggested by (FAO &WHO, 2022), household resilience to food insecurity was determined by covariates of eight components. These components include; access to Basic Services (ABS), Agricultural Assets (AA), Agricultural Technology and Practices (ATP), Income and Food Access (IFA), Non-agricultural asset (NA), Adaptive Capacity (AC), Social Safety Nets (SSN), and Stability (S). Final household resilience to food insecurity index was determined following a series of steps.
These include developing theoretical concept for understanding resilience, identifying and developing relevant variables, standardizing to allow comparison, weighting and aggregating the variables, and using uncertainty metrics to assess the robustness of the variables (Dhraief et al., 2019; FAO &WHO, 2022). The model for household resilience measurement can be expressed mathematically as:
Where RI is the resilience index, IFA is income and food access, ABS is access to basic services, AA is agricultural asset possession, NA is non-agricultural assets, ATP is agricultural technological and practices adoption, AC is adaptive capacity, SC is social capital, and S refers to household exposure to shocks or stability.
Despite resilience’s multidimensional application and its dynamic nature, there is lack of consensus reached among scholars on how to measure it (Maxwell et al., 2013; Dhraief et al., 2019). It can be measured employing quantitative or qualitative techniques (Nelli, N., 2011). However, the current study used quantitative methods through applying a series of multivariate techniques (principal component analysis and optimal scaling). Optimal scaling is used to transform dummy and categorical data to standard continuous forms for ease of principal component analysis.
Therefore, a two-stage factor analysis technique is used to determine the resilience index. First, an iterated principal component analysis (PCA) method is used to estimate an index for each component independently across a collection of observed variables. The interaction components that were calculated in the first stage are used as covariates in a PCA analysis to create the household resilience index in the second step. The components produced by Bartlett's (1937) scoring technique are then added up to form the resilience index, which is a weighted total. The weights correspond to the percentages of variation that each factor explains, as follows:
Where RI-Resilience index of the nth household, Wj-is the variance explained by factor j, and Fn is the factor retained based on eigenvalue greater than 1.
The compatibility of data for PCA analysis and sampling adequacy were checked by Bartlett’s test of Sphericity and Kaiser-Meyer-Olkin (KMO) criteria (Field, 2005). Accordingly, Bartlett’s test of Sphericity should be less than 0.05 (the cutting point), and Kaiser-Meyer-Olkin (KMO) tests of sampling adequacy should be equal to or above the recommended cutting point of 0.5. Resilience index scores range from negative to positive. However, there is a lack of consensus among the resilience literatures on using cutting points (Fikiru, 2016; Gebrerufael, 2019 & Debebe, 2021). In this regard, some categorize households into two; resilient (RI>0.000) and non-resilient (RI<0) (Gebrerufael, 2019; Debebe, 2021); others level them into four groups: non-resilience, moderately resilient, resilient, and highly resilient (Fikiru, 2016; Adane, 2018; Dhraief et al., 2019). This study categorized households into four groups following the suggestions by (Fikiru, 2016; Adane, 2018; Dhraief et al., 2019) namely; (1) non-resilient (RI≤0), (2) moderately resilient (0<RI≤0.50), (3) resilient (0.50<RI≤1.0), and (4) highly resilient (R>1.0). This helps us to make more descriptive comparisons among resilience groups rather than rough categorization into two groups.
Determinants of Household Resilience to Food Insecurity
Household resilience to food insecurity refers to a household's ability to maintain food security despite shocks, stresses, and changes, ensuring its function, structure, identity, and feedback. The options accessible to the household and its capacity to withstand risks determine how resilient it is to food insecurity (Daie & Woldtsadik, 2015). Determinant factors must be identified in order to improve households' resilience to food insecurity. Therefore, it is critical to pinpoint the resilience-determining variables in order to implement programming and policy changes.
Here the resilience level was used as a dependent variable with a negative to positive values. Based on the experiences of previous studies (Fikiru, 2016; Adane, 2019), the households were classified into four classes of resilience namely; Non-resilient (RI≤0.00), moderately resilient (0.00<RI≤0.50), resilient (0.50<RI≤1.00), and highly-resilient (RI>1.00). Since, the dependent variable has more than two outcomes, in our case four ordered outcomes. In this case, ordered probit regression model was most commonly recommended technique used with ordered classifications. Then, the differences across these categories can be affected by different explanatory variables at different levels. And the model was specified as follows;
Y = 1 if Y*≤0
Y = 2 if 0<Y* ≤0.50
Y = 3 if 0.50<Y* ≤ 1.0
Y = 4 if y>1.00
Where Y refers to the level of household resilience to food insecurity with an ordered outcomes of Y1 = Non-resilient, Y2=moderately resilient, Y3 = Resilient and Y4 = highly resilient. The Xij are the explanatory variables that are hypothesized to determine the household resilience status. The explanatory variables used in this model consist of dummy, categorical and continuous forms in their nature. And, β represents the parameters estimated and Uij is the disturbance term.
Before running the data analysis, the existence of bad correlation (multi-Collinearity) among potential explanatory variables should be tested using Variance Inflation Factor (VIF) for continuous variables and Contingency coefficient values for discrete variables. For acceptable multi-Collinearity test result, VIF should be less than 10. Similarly, in the case of discrete variables contingency coefficient value should be less than 0.75. The model fitness was also checked by using model fitting information (Nagelkerke pseudo R-square≥0.5 and significance of two log-likelihood chi-square). These confirm the existence of no strong association. The dependent and independent variables used in this model are described as follows.
Definition of variables and hypotheses
Following the clear discussion of analytical techniques used for investigating the determinants of household resilience status, it is imperative to describe the dependent variable and the potential explanatory variables used in the model. For this end, the identification of the dependent variable and its potential explanatory variables was done based on previous literature and the authors’ experiences regarding resilience analysis. The descriptions of dependent and explanatory variables are shown in Table 1 below.
As can be depicted in the Table 2 below, chi-square test is used to examine the statistical differences between household resilience across different socio-economic variables (dummy and categorical). Accordingly, the existence of statistical difference in terms of livelihood diversification categories was examined. In this regard, among non-diversified households only 15.9% were resilient to food insecurity at different levels. While 84.09% of the non-diversified (specialized at one livelihood option) households are non-resilient to food insecurity shocks. While about 58.42% of highly diversified households were found to be resilient to food insecurity at different levels. This may be explained by the fact that better household resilience to food insecurity requires greater household income diversification, and that there are significant differences in household diversification status among resilience categories (p = 0.000).
A chi-square test is performed to determine whether household food consumption scores (FCS) vary throughout household resilience categories. According to the findings, 87.5% of poor (food-insecure) households are not resilient to food insecurity. About 46.93% of acceptable (food-secure) households were resilient to food insecurity to varying degrees. The results showed that there are significant differences in household food consumption scores between the categories of household resilience (p = 0.001). In similar ways, there is a significant difference across resilience categories in terms of livelihood strategy combinations (p = 0.000). More than 50% of households that combined on-farm, off-farm, and non-farm livelihood activities were resilient to food insecurity at different levels. Thus, adoption of diversified combination of livelihood activity is suggested for attaining more resilient livelihood.
As can be observed from Table 3, the chi-square test is used if there are meaningful differences across household resilience levels in terms of various dummy variables. The result revealed the existence of a significant and meaningful difference across household resilience in terms of access to basic services like education, credit, FTC, and utilizing Development Agent (DA) services in the area. For instance, in terms of access to education, a relatively large proportion of non-resilient households have no education at all compared to their resilient counterparts. In the cases of access to credit, only 15.18% of the total respondents have access to credit in different sizes and forms. However, the majority 65.2% of credit users were among the resilient categories of respondents. In a similar manner, there is less access to FTC and DA service utilization among non-resilient households than among the resilient categories of respondent households. Accordingly, only 3.96% and 5.61% non-resilient households have access to FTC and DA services, respectively. The differences across resilience categories are significant at p = 1%.
| Explanatory factors | Category | Level of resilience to food insecurity | ||||||
|---|---|---|---|---|---|---|---|---|
| Non-resilient (n=179) | Moderately resilient (n=76) | Resilient (n=33) | Highly resilient (n=15) | Total (303) | χ2-Value (Df=3) | |||
| % | % | % | % | % | N | |||
| Access to education | Literate | 37.3 | 21.12 | 9.24 | 3.96 | 71.62 | 217 | 15.636*** |
| Illiterate | 21.78 | 3.96 | 1.65 | 1 | 28.38 | 86 | ||
| Access to credit | Yes | 5.28 | 5.61 | 2.64 | 1.65 | 15.18 | 46 | 14.409a ** |
| No | 53.8 | 19.47 | 8.25 | 3.3 | 84.82 | 257 | ||
| Utilize FTC services | Yes | 3.96 | 6.6 | 5.28 | 3.3 | 19.14 | 58 | 60.665** |
| No | 55.12 | 18.5 | 5.61 | 1.65 | 80.86 | 245 | ||
| Utilize DA services | Yes | 5.61 | 5.94 | 6.93 | 4.3 | 22.77 | 69 | 84.128*** |
| No | 53.47 | 19.14 | 3.96 | 0.66 | 77.23 | 234 | ||
| On-farm participation | Yes | 41.91 | 24.1 | 10.23 | 4.95 | 81.85 | 248 | 35.384*** |
| No | 17.16 | 0.33 | 0.66 | 0 | 18.15 | 55 | ||
| Off-farm participation | Yes | 10.89 | 2.97 | 3.96 | 2.31 | 20.13 | 61 | 15.544*** |
| No | 48.18 | 22.11 | 6.93 | 2.64 | 79.87 | 242 | ||
| Mobile use | Yes | 36.30 | 18.15 | 8.91 | 3.96 | 53.8 | 163 | 41.861a*** |
| No | 22.77 | 6.93 | 1.98 | 1 | 46.2 | 140 | ||
| Disability | No | 56.77 | 21.45 | 8.25 | 4.95 | 91.42 | 277 | 20.068a*** |
| Yes | 2.31 | 3.63 | 2.64 | 0 | 8.58 | 26 | ||
| Ill member in the family | Yes | 9.24 | 8.25 | 2.97 | 1 | 21.45 | 65 | 10.173a** |
| No | 49.83 | 16.83 | 7.92 | 3.96 | 78.55 | 238 | ||
| HH Read and write | Yes | 22.44 | 18.15 | 6.6 | 4.3 | 51.49 | 156 | 34.855*** |
| No | 36.63 | 6.93 | 4.3 | 0.66 | 48.51 | 147 | ||
| Govern’t salary or wage | Yes | 1.32 | 2.31 | 1.98 | 1.98 | 7.59 | 23 | 35.343*** |
| No | 57.75 | 22.77 | 8.91 | 2.97 | 92.41 | 280 | ||
| Transfers or assist | Yes | 1.98 | 2.97 | 2.97 | 1.98 | 9.9 | 30 | 35.324*** |
| No | 57.1 | 22.11 | 7.92 | 2.97 | 90.1 | 273 | ||
| Edir member | Yes | 49.83 | 24.75 | 10.56 | 4.95 | 90.1 | 273 | 16.289*** |
| No | 9.24 | 0.33 | 0.33 | 0 | 9.9 | 30 | ||
| Support in illness | Yes | 40.26 | 20.79 | 9.57 | 3.63 | 74.26 | 225 | 9.661** |
| No | 18.81 | 4.29 | 1.32 | 1.32 | 25.74 | 78 | ||
| Crop failure due to drought | Yes | 13.20 | 6.93 | 5.61 | 1 | 26.73 | 81 | 12.485** |
| No | 45.87 | 18.15 | 5.28 | 3.96 | 73.27 | 222 | ||
In general, the chi-square test result shown that there is a significant differences among the resilience categories of households in respect to access to education, household head ability to read/write or not, access to credit, utilization of FTC services and DA services, access to mobile, livelihood diversification status, access to government salary/wage, food consumption scores, livelihood diversification choices, on-farm participation and off-farm participation, availability of physical disability and ill members in the family, access to financial transfers in kind/cash, membership in Edir, whether the community was supportive or not in the cases of illness, and crop failure due to drought at probability of p<1 and p < 0.05 (Table 4).
| Covariates | Resilience status of households | ||||
|---|---|---|---|---|---|
| Non-resilient | Moderately resilient | Resilient | Highly resilient | Total | |
| Years of education | F=9.984 *** | ||||
| Mean | 4.425 | 6.289 | 7.970 | 9.733 | 5.54 |
| Std. Dev. | 0.367 | 0.564 | 0.856 | 1.269 | 5.131 |
| Total family size | F=12.070 *** | ||||
| Mean | 6.039 | 7.474 | 8.273 | 9.467 | 6.81 |
| Std. Dev. | 0.221 | 0.339 | 0.515 | 0.763 | 3.114 |
| Productive labor | F=4.710 *** | ||||
| Mean | 3.603 | 3.8182 | 3.667 | 5.667 | 3.78 |
| Standard Dev. | 0.154 | 0.237 | 0.359 | 0.533 | 2.101 |
| Landholding size | F=12.764 *** | ||||
| Mean | 0.879 | 1.280 | 1.535 | 2.070 | 1.109967 |
| Std Dev. | 0.068 | 0.104 | 0.158 | 0.234 | 0.9589455 |
| Annual non-food expense | F=12.371 *** | ||||
| Mean | 3651.397 | 5766.776 | 9907.576 | 13118.333 | 5332.01 |
| Std Dev. | 564.948 | 867.018 | 1315.764 | 1951.593 | 7973.948 |
| Annu Agri’ral Expend. | F=11.162 *** | ||||
| Mean | 1447.66 | 2305.07 | 4181.21 | 3600.00 | 2066.98 |
| Std Dev. | 1880.283 | 2096.271 | 6173.777 | 2736.786 | 2899.630 |
| Annual food Expense | F=4.149 *** | ||||
| Mean | 20903.36 | 30520.95 | 36784.61 | 26508.80 | 25322.80 |
| Std Dev. | 16638.175 | 46650.707 | 23416.231 | 23824.524 | 28650.440 |
| Total Livestock holding | F=10.176 *** | ||||
| Mean | 2.39 | 3.05 | 4.21 | 6.33 | 2.95 |
| Std Dev. | 2.368 | 3.028 | 3.257 | 7.257 | 3.175 |
| Weaving total | F=3.560 ** | ||||
| Mean | 27347.82 | 41153.95 | 25997.58 | 42900.00 | 31433.60 |
| Std Dev. | 25978.575 | 53248.758 | 25671.423 | 30909.569 | 35489.375 |
| Total hh income | F=8.696 *** | ||||
| Mean | 65760.65 | 102156.18 | 83146.97 | 171972.93 | 82041.16 |
| Std Dev. | 56933.240 | 125785.492 | 66035.654 | 165625.38 | 90743.005 |
| Food Consumption Score | F=56.649*** | ||||
| Mean | 47.8911 | 61.3816 | 84.6818 | 100.100 | 57.8663 |
| Std Dev. | 18.43766 | 22.93714 | 23.38830 | 17.60195 | 25.15162 |
| Dependency Ratio | F=4.231 *** | ||||
| Mean | 0.35597 | 0.45178 | 0.45032 | 0.41287 | 0.39309 |
| Std Dev. | 0.216204 | 0.226596 | 0.247094 | 0.195761 | 0.224965 |
A one-way ANOVA was employed to examine mean differences of various socio-economic characteristics of households. With regard to years of formal education, non-resilient households (m = 4.425) have relatively lower mean years of schooling than moderately resilient (m = 6.289), resilient (m =7.970), and highly resilient (m = 9.73) households. And, the difference is statistically significant at p = 0.000. Similarly, households with relatively higher mean family size, household productive labour, land holding size, non-food expenditure, agricultural expense, food expense, weaving income, total household income, and food consumption score have relatively higher household resilience attainment and the differences were significant at 1% and 5% (Table 4).
In addition to this, the post-hoc test is carried out to investigate if there are individual differences between groups. Accordingly, there exists group differences among non-resilient, moderately resilient, resilient and highly resilient groups in terms of years of household head years of formal education, total family size, number of working groups (Productive labour size), landholding size, annual non-food expenditure, annual agricultural expenditure, annual food expenditure, total livestock holding, weaving income, total household income from different sources, household diversification scores, food security status (using Food Consumption Score), and dependency ratio at probability of 5% and 1% levels. This result is in line with the study of Fikiru (2016) and Debebe (2021).
The ordered probit model was used to detect the determinants of household resilience to food insecurity. Here, the main focus is on carrying out the data analysis and identifying explanatory factors (continuous and discrete) that affect household resilience to food insecurity. Before running the data analysis, the existence of bad correlation (multi-Collinearity) among potential explanatory variables was tested using the variance inflation factor (VIF) and contingency coefficient values for continuous and discrete variables, respectively. Then, the test result revealed that there is no strong correlation among independent variables as shown in the Extended data (Dereje et al., 2024). Accordingly, the VIF values for all continuous variables were found to be small (i.e., VIF<10), with a mean value of 1.60744, which is far beyond the cutting threshold value of 10. In the same way, the multi-Collinearity test result for discrete explanatory variables revealed a contingency coefficient value of less than 0.75, which confirmed the existence of no strong association (see Extended data (Dereje et al., 2024)).
As shown in the previous sections, the existence of a statistically significant relationship between the status of household resilience to food insecurity and the potential explanatory variables was tested using chi-square and one-way ANOVA tests. Thus, these variables were used for ordered probit analysis using a 95% confidence interval (CI) or p<0.05 value. The model fitting information shows that it has high predictive power with a Nagelkerke pseudo-R-square value of 0.877, which indicates the model fits the data well with 87.7% of the dependent variable (household resilience to food insecurity) being determined by the independent variables. Besides, the difference between the two log-likelihoods, the chi-square has shown a significance level of less than 0.001. The parameter test results are shown in Table 5 below.
Based on the probit model result, the following explanatory variables, which have significantly influenced the status of household resilience to food insecurity, are briefly interpreted. Accordingly, some explanatory variables were found to positively and significantly influence the likelihood of attaining from lower to higher household resilience to food insecurity (Table 5).
Access to credit services: access to credit services is an important engine to combat poverty and food insecurity through buying agricultural inputs for the purpose of agricultural intensification and livelihood diversification. However, households fear the high interest rates, and it needs pre-conditions like savings and collateral to get the loan. Despite the availability of some credit and saving institutions like Omo Microfinance and Vision Fund Micro-finance institutions; households in the area were not interested in getting the services. Besides this, the result indicated that access to credit has a positive influence on the resilience to food insecurity p<0.01. This implies that a unit increase in credit use increases the probability of a household falling into the higher category of resilience by 0.215 units more when other factors are kept constant. The odds ratio result shows that the probability of a household falling into the higher resilience level is 1.2398619 times greater for increased access to credit in comparison to low credit utilization. Therefore, this study suggests increasing access to credit for smallholder farmers to increase options, production and improve household resilience. This result is incongruent with Fikiru (2016) and Tesso et al. (2012).
Access to local market: Access to markets was expected to have a positive influence on household resilience to food insecurity by enabling ease of access to necessary agricultural inputs, food items, and agricultural products. However, the result confirmed that distance from the local market increased the probability of households attaining higher household resilience to food insecurity by 0.601 at p<0.01. This could be explained as the closer the household is to the market area, the less likely they are to participate in diverse agricultural production activities, resulting in decreased household resilience to food insecurity due to limited access to farmland. However, this result is in contrast with Debebe C. (2021).
Access to education (Average years of family schooling): education is one of the key factors in building household capacity to cope with shocks and stresses that could enhance individuals’ capacity to plan access, and utilize agricultural extension information, manage livelihood shocks, make better decisions on livelihood options, and more. The model result indicated that average educational attainment of the household positively and significantly affected resilience level at a 10% significant level. A positive sign with a household education coefficient of 0.054 would mean that with increasing education, there is a greater probability of falling into the higher resilience level. Regarding the odds ratio, the odds of improved resilience are 1.0554846 times greater for increased household education attainment than those with low educational status. This result is similar to the study conducted on the analysis of vulnerability and resilience to climate-induced shocks in North Shewa, Ethiopia (Tesso et al., 2012). Thus, the study advocates access to quality education considering intra-household equity.
Crop diversity: Cultivating several crop species enables households to cope with the effects of both price and production risks, which can help them, ensure they have more food options and income alternatives. As a result, the sample households have grown a mean of 5.08 and a maximum of 11 types of crop species. The model result shows that a number of crop species cultivated in the area have positively and significantly affected household resilience, with a coefficient of 0.142 at p<0.05. Households with high crop diversity are more likely to fulfill improved dietary diversity and thereby attain a higher resilience level, with 1.19005557 times more than those with a low crop diversity level. In agreement with this result, the study conducted in Malawi reported positive contribution of crop diversification to the food consumption status of households (Mango et al., 2018; Adjimoti & Kwadzo, 2018).
Diversity of income sources: Following diverse income sources is expected to have several livelihood implications, like enhancing household income sources, means of risk management, improving household wellbeing, and more. In this study, the number of income sources adopted by households has a positive influence on household resilience to food insecurity, with a coefficient of 0.174 at a significant level of p<0.01. This implies that households with diverse income sources will have a higher likelihood of falling into a higher resilience level at an odds ratio of 1.19005557 times greater than those with few income sources. This result is in agreement with Fikiru (2016).
Expected crop harvest in cash (ETB): Resilience is about the capacity of an individual, a household, a community, or a subject to withstand the effect of a foreseen shock or the ability to recover from past shocks and stress using available and potential sources of capability. The model result shows that the expected crop harvest in monetary value has positively influenced household resilience with a coefficient of 0.00002802 at p<0.05. The odds ratio of falling to a higher resilience level is 1.0000280 times higher in cases of an increased expected crop harvest than a low expected crop harvest.
Expected cash from fruit trees (ETB): Fruit production is an important cash crop in the study area and serves as a source of income to build household resilience. Study reports show that there are more than 60 varieties of apple fruit trees grown in the area, which serve as a basic income source in the form of seedlings and fruit products (Fetene et al., 2014). Apple fruit products reach during food deficit seasons of March, April, and May, which become food security buffering options. The probit result indicated that the amount of expected fruit income has a positive influence on household resilience and increases the likelihood of falling into higher resilience levels at P<0.05. The study report revealed that about 21.12 percent of respondents had incomes from apple fruit grown in their backyard. The FGD and KII results indicated the suitability of the area for apple cultivation and its high income-generating capacity, but theft due to its high economic value was stressed as the main threat.
Access to Development Agent contact (DA contact): Access to development agent contact has a positive influence on household resilience to food insecurity by providing agricultural production information. Households with a higher frequency of DA contact are more likely to fall into the higher category of resilience at p<0.05. Keeping other factors constant, a unit increase in access to DA contact will increase the probability of households being at a higher resilience level by 0.136 units. This, in turn, improves household resilience to food insecurity.
Food Consumption Score (FCS): As expected, food consumption status in the form of FCS has a positive association with household resilience to food insecurity at p<0.05. This positive influence refers to the fact that the higher the food consumption status of the household, the greater its capacity to withstand food insecurity-related shocks. The model result indicated that a unit increase in FCS increases the likelihood of the household falling into the higher resilience category by 0.011 units, considering other factors constant.
Access to non-agricultural assets: In rural areas, ownership of non-agricultural assets is a sign of wealth status and is considered a means of livelihood risk management (Abbassi et al., 2020). As expected, the model result shows that access to and ownership of physical assets like jewelry, radios, and furnished beds are positively associated with household resilience to food insecurity at probability of less than 0.05, 0.05, and 0.01. A household with increased ownership of the physical assets is more likely to fall into the better resilience category than its counterparts.
Access to formal employment: Access to formal employment (government or non-government employment) is one of the major non-farm income sources adopted in the area, having the highest average income that accounting for more than 18 percent of the total household income of the respondents. Ceteris paribus, as expected, the probability of a household falling into the higher resilience level decreases by 0.644 units if the household has no access to formal employment at p<0.1.
Access to transfers payment (Dummy): Access to transfers in different forms, formal or informal, in-kind or in-cash, is considered one of the major sources of social safety nets. These include; donor agencies based support services (PSNP), aid, and remittances. Thus, the probit result indicated that lack of access to cash transfers decreases the likelihood of achieving higher resilience level by 2.154 units if other things kept constant at p<0.01. Hence, transfers help households in cases of food deficit seasons and help create assets, thereby enhancing household resilience to food insecurity.
Participation in family business activities: practicing non-farm livelihood diversification is believed to contribute to improved household food security and, in turn, strengthen household resilience to food insecurity. In the rural areas of Gamo zone in general and Chencha district in particular, weaving, trade, small-scale food item enterprises, hairdressers, and barber services were reported as the major out-of-farm business activities. Considering other things being constant household ability to attain higher resilience level decreases by 0.690 if the household has not participated in out-of-farm business activity p<0.05. Therefore, this study suggests creating a conducive environment for youth and able groups to enter into rural business activities is inevitable to create job opportunities for others, improve income, and thereby increase their resilience to food insecurity (Fikiru, 2016).
This work has aimed to examine the factors that determine household resilience status across different categories and understand the dynamics of household resilience across differing socio-economic characteristics. Hence, the result confirmed the proposed notion that household resilience depends on the resources and livelihood options available and the effects of external shocks and stresses. A thorough analysis of household resilience status has categorized households into four categories: non-resilient, moderately resilient, resilient, and highly resilient. Broadly, the study results show that the majority, about 59.76% of the households were non-resilient to the expected food insecurity shocks and stresses; the remaining 40.24% of the respondent households were found to be resilient at different levels.
A close examination of household resilience across different socio-economic and demographic characteristics of households using a chi-square test indicated significant differences. As a result, there is a significant and meaningful difference across household resilience categories in terms of access to education, credit use, access to FTC and DA services, livelihood diversification categories, food consumption score categories, livelihood diversification choices like; participation in on-farm, off-farm, and non-farm options, access to mobile use, household head ability to read and write, disable household member availability, access to formal employment, access to transfers and assists, Edir membership, and whether encountered crop failure due to drought or not at 5% and 1% significant levels. The one-way ANOVA result revealed that there is a meaningful difference among household resilience categories in terms of years of education, total family size, productive labor, landholding size, annual non-food expense, annual agricultural expense, food expense, total livestock holding, weaving total income, total household income, and dependency ratio at less than 1%, 5%, and 10% significance levels.
The probit model confirmed that access to credit, average years of family education, diversity of crop types grown, number of income sources adopted, land holding size, livestock holding size, expected crop harvest, expected cash income from fruit trees, frequency of DA contact, FCS, annual food expenditure, radio ownership, jewelry ownership, ownership of a modern furnished bed, membership in local associations, and distance to a nearby local market have positively influenced the likelihood of attaining higher household resilience at 1%, 5%, and 10% significant levels. Whereas, lack of access to a mobile phone, inability of the household head to read or write, lack of family business, lack of formal employment, and lack of access to transfers of payment in the form of remittances and support have decreased the likelihood of households achieving a higher resilience level at 1%, 5%, and 10% significance levels.
Based on the result of household resilience to food insecurity using one-time cross-sectional data, it has pinpointed areas and factors to be stressed by concerned bodies to initiate, improve, and build household resilience to food insecurity. Accordingly, improving household resilience in the study area requires investing and improving access to available options and alternatives such as agricultural assets, non-agricultural assets, adaptive capacities, basic services, agricultural technologies and practices, social safety nets, and income and food access. Particularly, improved access to credit, education, livelihood diversification options, creating opportunities to get assets like land and livestock, and improved agricultural extension services will have a potentially positive impact on building household resilience in the area. Therefore, concerned bodies need to improve households’ access to basic livelihood assets, livelihood options, and services to enhance household capacity to withstand food insecurity-inducing shocks and stresses.
| Views | Downloads | |
|---|---|---|
| F1000Research | - | - |
|
PubMed Central
Data from PMC are received and updated monthly.
|
- | - |
Provide sufficient details of any financial or non-financial competing interests to enable users to assess whether your comments might lead a reasonable person to question your impartiality. Consider the following examples, but note that this is not an exhaustive list:
Sign up for content alerts and receive a weekly or monthly email with all newly published articles
Already registered? Sign in
The email address should be the one you originally registered with F1000.
You registered with F1000 via Google, so we cannot reset your password.
To sign in, please click here.
If you still need help with your Google account password, please click here.
You registered with F1000 via Facebook, so we cannot reset your password.
To sign in, please click here.
If you still need help with your Facebook account password, please click here.
If your email address is registered with us, we will email you instructions to reset your password.
If you think you should have received this email but it has not arrived, please check your spam filters and/or contact for further assistance.
Comments on this article Comments (0)