Keywords
single cells RNA-seq; workflow; integration and comparative analysis; data visualization
This article is included in the Bioinformatics gateway.
single cells RNA-seq; workflow; integration and comparative analysis; data visualization
In the past decade, rapid development of single-cell sequencing technologies has revolutionized our ability to characterize the cells that comprise complex tissues. With these tools at hand, many large-scale studies have been launched to create comprehensive reference maps of cell types from various tissues under different physiological and pathological conditions,1–3 notable examples include the Human Cell Atlas,4 an international collaborative project attempting to create a blueprint of all normal cell types in humans. As the number of samples increase in single-cell studies, the effort required to analyze this type of data surges dramatically, especially when comparative explorations need to be performed on data with different cell types and various sample attributes.5 For example, in a study with samples from type 2 diabetes and healthy controls, researchers are interested in characterizing cell types not only by disease phenotype, but also by age, gender and ancestry. These clinical or demographic attributes are often nested within the phenotype data, making the programming for the analysis of each sub-category tedious. Therefore, a thorough comparative exploration of scRNA-seq data across different groups of sample attributes presents a substantial computational obstacle.
In fact, the inherent complexity of multi-sample scRNA-seq data necessitates a multi-step process using advanced statistical and computational methods for analysis. For example, the best practice pipeline implemented in Seurat includes the identification of an anchor gene set of highly expressed genes, data using the anchor gene set, data centering and scaling, nearest-neighbor graph construction, cluster detection, etc. Due to the sequential nature of the analysis, users may need to consider combinations of parameter options for multiple steps. This poses challenges for both programming efficiency and research reproducibility.
Here we introduce scRICA, an R package that greatly reduces programming efforts required for multi-sample scRNA-seq data analysis. scRICA allows parameter options inherited through the entire analysis workflow for each attribute group or sub-category of samples so that users can efficiently conduct a systematic exploration across attribute groups. Furthermore, scRICA produces detailed reports and publication-quality visualizations for each attribute group, which greatly enhances reproducibility and interpretation. In addition to the regular R functions, scRICA provides a command-line tool to simplify the implementation in a high-performance computing environment. With scRICA, we aim to reduce the obstacles in programming and improve analysis efficiency and reproducibility for multiple-sample scRNA-seq data. This package includes comprehensive documentation and example workflows, available at https://rpubs.com/yli_cri/1025790, to facilitate the replication of the software development and its use by others. By enabling efficient multiple comparisons across various experimental conditions and providing sufficient information and visualizations to interpret the expected output results, scRICA has the potential to significantly advance the field of single-cell data analysis.
scRICA categorizes the workflow of integrative and comparative analysis using multiple-sample scRNA-seq data into four steps ( Figure 1A): ‘Step 1’ for pre-processing and quality control; ‘Step 2’ for multi-sample integration; ‘Step 3’ for visualization by attribute groups; and ‘Step 4’ for downstream analysis including differential expression (DE) analysis, pseudo-time trajectory analysis, and cell clusters identification. Everything is implemented in R as an R package with various functions implementations, additionally it also offers command line execution option to make the implementations easier on High-Performance Computing (HPC) systems. Instructions for installing prerequisite packages are available at https://github.com/yan-cri/scRICA. Users can follow these instructions to set up the appropriate analysis environment in R.
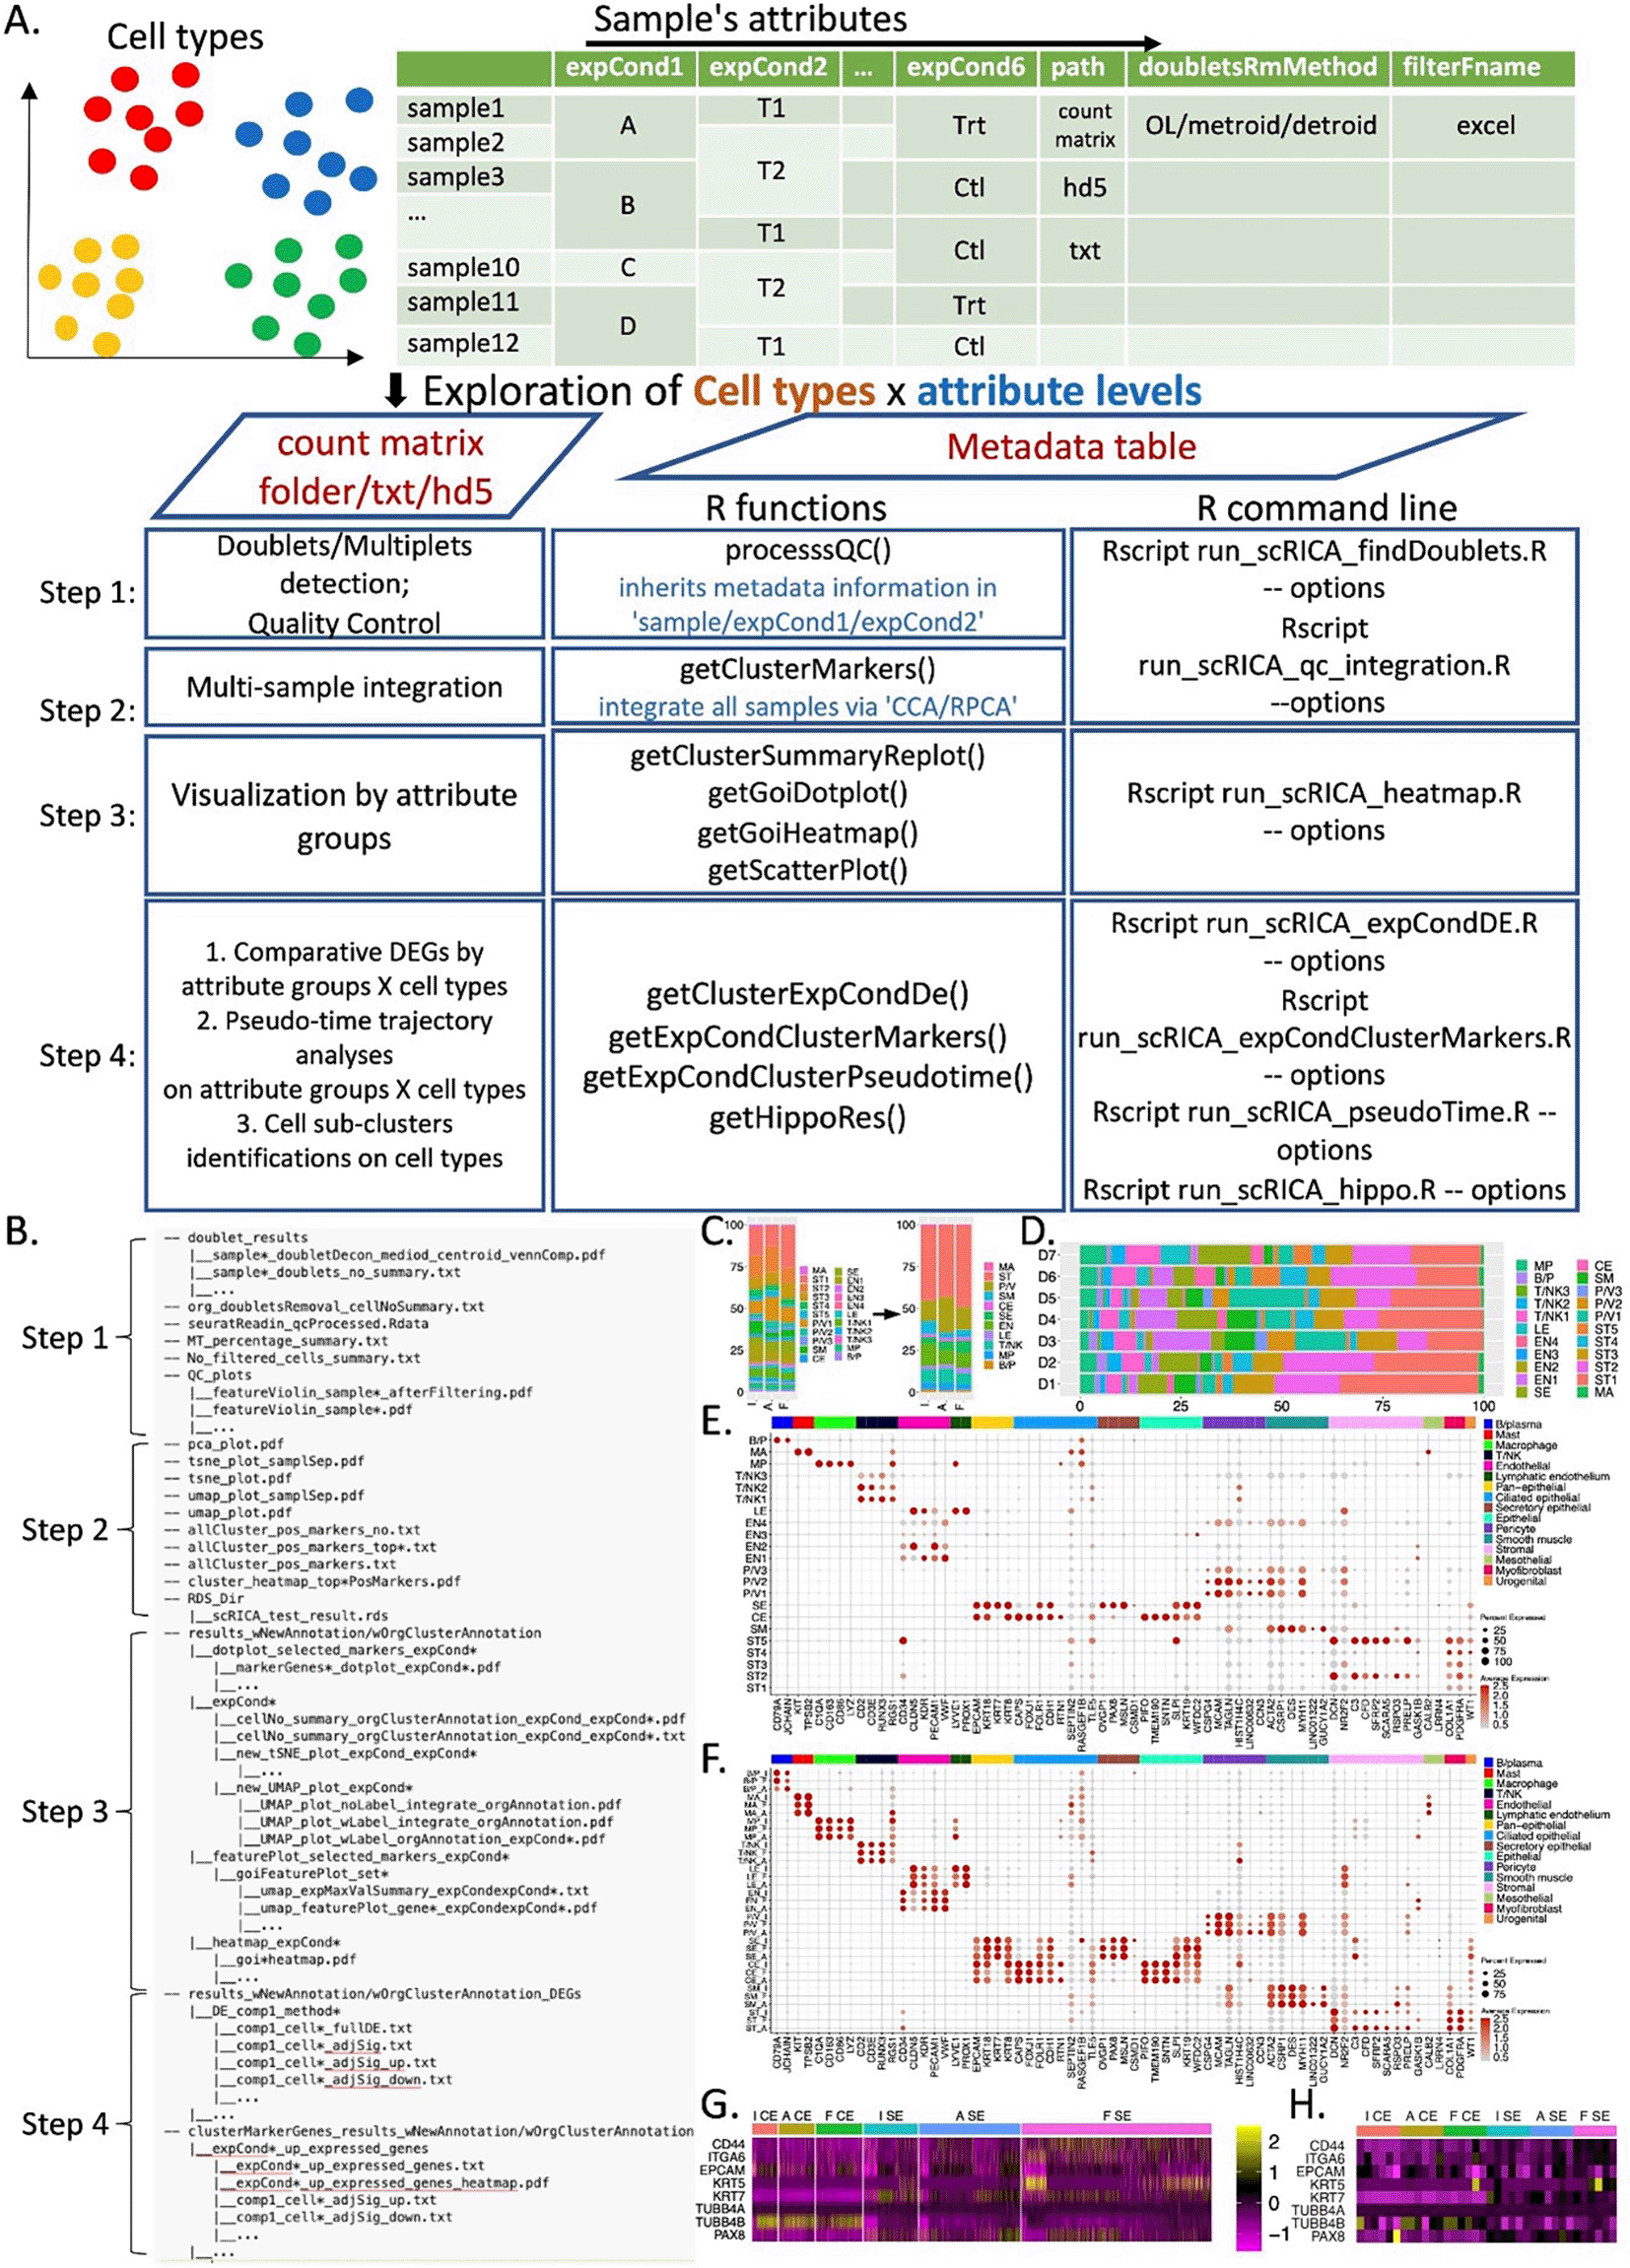
A. scRICA workflow analysis steps; B. scRICA analysis results outline; C&D. Cellular composition percentage stacking bar plots by different sample’s attribute groups; E&F. Marker genes dot plots with respect to different sample’s attribute groups; G&H. Heat map of gene of interest with respect to the selected sample’s attribute groups and cell types.
‘Step 1’ performs pre-processing and quality control checks for each individual sample listed in the input metadata table. This step is initiated by the function ‘processQC()’, with main parameters inputting from a user-provided metadata table (details in input and output structures). ‘Step 1’ performs: 1) counts importation into a SeuratObject; 2) doublet/multiplet detection and removal using DoubletDecon6; 3) quality control results visualization; 4) mitochondrial and ribosomal contents summarization; and 5) cell numbers summarization. It has additional options including: 1) ‘genomeSpecies’, which allows users to select the species of the reference genome; 2) ‘mtPerCutoff’, the cut-off for mitochondrial content values. Values above the cut-off indicate cells with low viability; 3) ‘extraFilter’, which allows users to further eliminate certain cells from the analysis. These cells need to be specified in a separate file with respect to each sample, and the full path of these files should be provided in the metadata table column ‘filterFname’; and 4) ‘multi-omics ’, which specifies the format of the input count matrices.
‘Step 2’ integrates all samples listed in the input metadata table using two popular integration methods: the CCA and RPCA algorithms in Seurat.7,8 This step is performed on cells that pass the quality control from ‘Step 1’ via the function ‘getClusterMarkers()’. In ‘Step 2’, the number of gene features used for integration can be specified by the option ‘nfeatures’. Additionally, users can exclude ribosomal genes from the gene set by setting ‘ribo.removal = TRUE’. By default, the identified cell clusters are listed as numbers, (i.e., 0, 1, 2, etc.). scRICA allows users to further annotate cell clusters via the option ‘newAnnotationRscriptName’ for downstream analysis.
‘Step 3’ provides various visualization techniques to inspect cellular compositions and gene expression patterns of different cell types, with respect to sample attributes specified in the option ‘expCondCheck’. For example, we can analyze fallopian tube data from the Human Cell Atlas by anatomic sites (isthmus, ampulla, fimbriae, abbreviated as I, A and F) by specifying the anatomic site as the desired sample attribute. Four main functions are available: 1) Function ‘getClusterSummaryReplot()’ generates box plots to inspect cellular compositions across attribute groups. For example, users can visualize cellular compositions across anatomic sites (I, A and F) ( Figure 1C) and across patients (D1-7) ( Figure 1D). 2) Function ‘getGoiDotplot()’ generates dot plots for a pre-defined set of gene markers, inputting through a separate file. This plot can visualize normalized and center scaled gene expression values across attribute groups, with dot color representing the center scaled average gene expression of cells with each group and dot size representing the percentage of cells with non-zero expression. Gene annotations can be specified and displayed on top as a legend bar (as shown in Figure 1E and 1F). 3) Function ‘getGoiHeatmap()’ generates heatmaps for a pre-defined set of gene markers, which can be specified either in a separate file or through the option ‘geneNames’. This heatmap can visualize gene expression at the single-cell level ( Figure 1G) or the donor level ( Figure 1H) across groups, providing complementary information for the dot plot that display scaled average values. 4) Function ‘getScatterPlot()’ generates scatter plots for any two selected cell types or attribute groups via the option ‘selectedGroups’.
‘Step 4’ can perform downstream analysis including: 1) differential expression (DE) analysis by the function ‘getclusterExpCondDe()’; 2) over-expressed gene identification via the function ‘getExpCondClusterMarkers()’; 3) pseudo-time trajectory analysis via the function ‘getExpCondClusterPseudotime()’; and 4) sub-cluster identification via the function ‘getHippoRes()’. All analyses can be applied to any specified cell types, any specified attribute groups, or a combination of cell types and attributes. DE analysis can be conducted at single-cell level or pseudo-bulk level. The options for single-cell based DE include wilcox, MAST and t-test. For pseudo-bulk-based DE, expression levels are averaged and normalized for each donor with respect to the total number of cells, followed with DE test using DESeq2.9 The pseudo-time trajectory analysis in scRICA is performed with slingshot.10 Users can select any subset of cell types from specified attribute group for pseudo-time analysis. Sub-clustering identification is conducted by HIPPO,11 which implements a zero-inflation test that runs iteratively to select heterogeneous features in order to refine and identify biologically important sub-cluster cell types.
scRICA’s input includes a metadata table and a processed count matrix. The processed count matrix can be in different formats, including a processed count matrix saved in a folder, which is directly generated from the 10X genomic Cell Ranger analysis tool (https://support.10xgenomics.com/single-cell-gene-expression/software/overview/welcome), or a count matrix stored in text or hd5 format. The input metadata table includes two mandatory columns: the first column specifies all sample names, and the second column (‘path’) specifies the full path of the count matrix for each corresponding sample in a row. Optional columns include: 1) ‘doubletsRmMethod’, which specifies the doublets removal algorithm metroid, detroid,6 or both (designated by OL); 2) ‘filterFname’, which provides the full path of Excel files that specify cells to be removed from the analysis; and 3) ‘expCond*’, which allows the inputting of multiple sample attributes for each sample. These sample attributes can be inherited through the entire analysis workflow by setting the option ‘expCondCheck’ properly.
scRICA outputs all analysis results to a main folder named ‘scRICA_results’ by default or it can be specified by user via the option ‘resDirName’. Results from each step are organized into corresponding sub-folders ( Figure 1B). The integration analysis results are saved as an RDS object. All visualizations are saved as PDF files. QC summary, DE analysis, and trajectory analysis are saved as both text files and Rdata objects, making them easily accessible for additional analysis.
scRICA simplifies scRNA-seq’s integrative and comparative analysis as an easy 4-step workflow. It significantly reduces the requirement of computational programming skills used for complex datasets. The inheritance feature provides an efficient way to thoroughly explore data with nested groups of sample attributes and multiple cell types. The command line execution allows users to conduct analysis on high performance computers directly. scRICA will enhance the programming efficiency and reproducibility for the data analysis of large-scale single-cell studies.
The source code of scRICA was developed by YL with the contributions from JS, QL and MC. Package usages have been tested and implemented by JS, QL, QG, and MR for various types data. YL and MC drafted the manuscript. All authors have edited, read and approved the final manuscript.
| Views | Downloads | |
|---|---|---|
| F1000Research | - | - |
|
PubMed Central
Data from PMC are received and updated monthly.
|
- | - |
Provide sufficient details of any financial or non-financial competing interests to enable users to assess whether your comments might lead a reasonable person to question your impartiality. Consider the following examples, but note that this is not an exhaustive list:
Sign up for content alerts and receive a weekly or monthly email with all newly published articles
Already registered? Sign in
The email address should be the one you originally registered with F1000.
You registered with F1000 via Google, so we cannot reset your password.
To sign in, please click here.
If you still need help with your Google account password, please click here.
You registered with F1000 via Facebook, so we cannot reset your password.
To sign in, please click here.
If you still need help with your Facebook account password, please click here.
If your email address is registered with us, we will email you instructions to reset your password.
If you think you should have received this email but it has not arrived, please check your spam filters and/or contact for further assistance.
Comments on this article Comments (0)