Keywords
Robusta coffee beans, fermentation process, semi-carbonic maceration, kefir starter.
This article is included in the Agriculture, Food and Nutrition gateway.
The quality of robusta coffee beans (Coffea canephora var. Robusta) can be modulated by using a specific fermentation method. Fermentation is an important process in coffee bean processing because it greatly determines the final quality of coffee beans, especially their taste. A starter culture is one way to perform a particular process of fermentation.
In this study, fermentation was carried out at different temperatures (35°C and 40°C) and times (24 h and 48 h) using kefir as a specific starter culture and the Controlled Semi-Carbonic Maceration Method. Research parameters are: population number of lactic acid bacteria, caffeine content, reducing sugar content, pH, lightness value, the density, and titrated acid value.
The results of this study indicate that the lactic acid bacteria population showed optimum growth at 24 h of fermentation, which was around 7.67-7.72 log10 cfu/mL. Changes in the chemical and physical characteristics of Robusta coffee beans fermented with a kefir starter were that the caffeine content decreased from 1.41% to 0.46%, the reducing sugar content decreased from 2.42% to 0.29%, the pH decreased from 6.12 to 4.43, the lightness value decreased from 41.68 to 30.54, and the density decreased from 0.50 g/mL to 0.39 g/mL. Still, the total titrated acid value increased from 0.40% to 0.99%.
This indicates that the addition of kefir as a starter in semi-carbonic coffee fermentation maceration has been successful, as evidenced by the results of data in the form of a decrease in caffeine, reducing sugar, pH, and a decrease in density and lightness. Meanwhile, the total titrated acid increased.
Robusta coffee beans, fermentation process, semi-carbonic maceration, kefir starter.
Fermentation is an important process in coffee bean processing because it greatly determines the final quality of coffee beans, especially their taste.1 Wet fermentation can produce fewer defective beans and can maintain the quality of the coffee beans, thus producing coffee with superior aroma and quality compared to the dry method. Post-harvest processing of robusta coffee beans using semi-carbonic maceration fermentation techniques can be used to improve the quality of robusta coffee beans. The semi-carbonic maceration method involves soaking the coffee in a container or barrel filled with air so that all the coffee is submerged without injecting CO2 gas into the container. When microorganisms break down sugar compounds or coffee nutrients at the bottom of a fermentation tank in an anaerobic atmosphere, they produce alcohol and carbon dioxide.2
Efforts to improve the quality of robusta coffee beans can also be made by fermentation using a controlled inoculum and providing adequate nutrition. This is based on the fact that during fermentation, microbes grow with a nutrient source from fresh coffee bean pulp, which is rich in sugar. One of the inoculants that can be used for fermentation is kefir. The types of microbes in kefir that have been identified are Leuconostoc mesenteroides (29%), Lactococcus lactis spp. (5%), Lactococcus lactis ssp. cremoris (45%), Acetobacter lovaniensis (10%), and Saccharomyces cerevisiae (11%), whose fermentation will produce lactic acid and alcohol. The reason for using lactose is that it is adjusted to the microbes in kefir, which mostly consist of up to 79 % Lactic Acid Bacteria (LAB). Lactose acts as a carbon source for the growth of LAB in kefir.3
Controlled fermentation can improve the quality of coffee beans. During fermentation, temperature tends to increase during the fermentation process due to the activity of microorganisms; therefore, temperature is one of the parameters that can be controlled during fermentation to modify microbial activity and produce the desired positive effects on coffee quality.3 The fermentation time also affects the quality of the produced beans. Under-fermentation causes incomplete degradation of the mucus layer and encourages the growth of unwanted microorganisms, whereas over-fermentation results in the production of black or “bad-smelling” coffee beans with poor visual and aromatic characteristics.4
Controlling the temperature and time during the fermentation process can improve coffee quality. Therefore, this study aimed to determine the chemical and physical qualities of robusta coffee fermented with a kefir starter at different temperatures and fermentation times using the controlled semi-carbonic maceration method.
Robusta coffee (Coffea canephora var. Robusta) from Jember, East Java, Indonesia, was used. The fermentation process was carried out by crushing the raw coffee beans, followed by soaking the coffee beans in mineral water for 2 h to produce coffee beans with a water content of approximately 55%. After that, the coffee beans were put into an automatic reactor, and 2% kefir (Jember Kefir with 60 of LAB species) and 3% lactose (LKPP CDH Lactose monohydrate, catalogue number: 5609150500) were added as a starter and source of nutrition. Then, the automatic reactor was set at temperatures of 35 °C and 40 °C for 24 and 48 h, respectively. Negative control samples (without treatment) were also prepared. The analysis was performed on each sample with three repetitions. The automatic reactor was developed by our research group at the Faculty of Agricultural Technology, University of Jember, Indonesia, to periodically collect and store fermentation media temperature data during the fermentation process. After fermentation, the coffee beans were immediately washed to stop the process and dried using a food dehydrator at 45°C on a raised drying bed until they reached a moisture content of 11-12%.
The lactic acid bacteria population was calculated using Bacteriological Analytical Methods (BAM). The coffee sample (5 g) was diluted in 45 mL of a physiological solution (ONECARE REAGEN NACL 0.86%, PT Anugerah Santosa Abadi, catalogue number: 1000023). Dilution was performed up to 10−7. Dilution results were taken from 1 mL of the last three dilution levels and poured into a petri dish, then MRSA (Himedia MRS Agar Granulated, catalogue number: GM641-500G) with 1% CaCO3 (Nitrakimia, Calsium carbonate for Analysis, Catalogue number: 1.02066.1000) was added as much as 12-15 mL. The petri dish was shaken on a flat surface, forming Figure 8 slowly to mix the sample liquid and agar and let it stand until it solidifies. After solidifying, cells were incubated at 37°C for 48 h.
Color analysis was performed using a color reader with the notations Hunter L* (white), a* (red), and b* (yellow).5 Density analysis of coffee beans can be performed by inserting coffee beans into a 100 mL measuring cup to the measuring limit and weighing. The analysis was carried out three times for each sample.
2.3.1 Caffeine
Caffeine analysis was based on the Belay method with modifications.6 The stages of caffeine analysis were making a standard solution, making a standard curve by taking (0, 50, 150, 300, 450, 600) μL of the standard caffeine solution and putting it into a 25 mL measuring flask, determining the caffeine content by extracting 25 mg of coffee sample in 10 mL of distilled water, and heating at a temperature of 90°C for 10 min. After cooling, the samples were filtered using filter paper. The filtrate obtained was placed in a separating funnel, and 25 mL of dichloromethane (Merck Pro Analysis, Catalogue number: 106050) was added (extracted three times, namely 10 mL, 10 mL, and 5 mL). The bottom layer was calibrated to a volume of 25 ml. The absorbance of the solution was measured at a wavelength of 285 nm using a spectrophotometer.
2.3.2 Reducing sugar
Reducing sugars levels were tested using the Nelson-Somogyi method.7 The following are several stages of testing the reducing sugars: 1. Nelson Solution: Nelson reagent was prepared by mixing 25 mL Nelson Reagent A and 1 mL Nelson Reagent B (PT Dwi Lab Mandiri Nessler’s reagent A MSDS, catalogue number: 109012). Mixing was performed every time it was used; 2. Arsenomolybdate solution (acpchem.com A8302-500 ml, Catalogue number: A8302), 3. Preparation of the standard curve; 4. Sample preparation was performed by extracting 2 g of the sample using 80% ethanol. The filtrate was homogenized, and ethanol (Merck Millipore, ethanol MSDS, Catalogue number: 100983) was evaporated until it ran out. Addition of 100 mL of aquadest and 1 g of CaCO3 (Merck Millipore, CaCO3 99.95%, Catalogue number: 102059), then boiled for 30 minutes. Pb acetate (Merck, Pb acetate 100% CAS 64-19-7, Catalogue number: 100063), and Na oxalate (PT Delta PrimaLab Saintifik, Sodium Oxalate AR 500 g, Catalogue number: 645535-0500) were added until the color became clear. If the color of the solution was clear, filtering was performed, and 100 mL was calibrated using an aquadest 5. The reducing sugars were analyzed by placing 2 mL of the prepared solution into a test tube. Addition of 1 mL Nelson solution and homogenization. The samples were then heated for 20 min and cooled. Arsenomolybdate (1 mL) and distilled water (6 mL) were added and then shaken until homogeneity. Absorbance was read at 540 nm.
2.3.3 pH
The pH test was carried out using a pH meter that had been calibrated with pH buffers (4, 7, and 9). A 5-gram coffee sample was diluted with 50 mL of distilled water (Merck Millipore, CAS 7732-18-5, Catalogue number: 115333) and stirred until homogeneous. The electrode was rinsed with distilled water and dried using a tissue. The pH meter was dipped into the solution until the pH value was stable, and the pH value was read on the screen.
2.3.4 Total titratable acidity
Total titratable acid analysis was carried out by weighing 1 g of the ground sample (60 mesh), placing it in a beaker, glass, and diluting it with 50 mL of distilled water. Filtration using filter paper. The filtered sample filtrate was placed into a 100 mL measuring flask and diluted using distilled water. The diluted sample was taken as much as 5 mL, and 2 drops of 1% phenolphthalein were added, after which the titration was continued. Titration was performed using a 0.01N NaOH solution until the color changed to pink. The total titratable acid concentration was assumed to be the total lactic acid concentration measured from the sample.
The total lactic acid bacteria in robusta coffee fermented with a kefir starter at different temperatures and fermentation times using the semi-carbonic maceration method are shown in Figure 1.
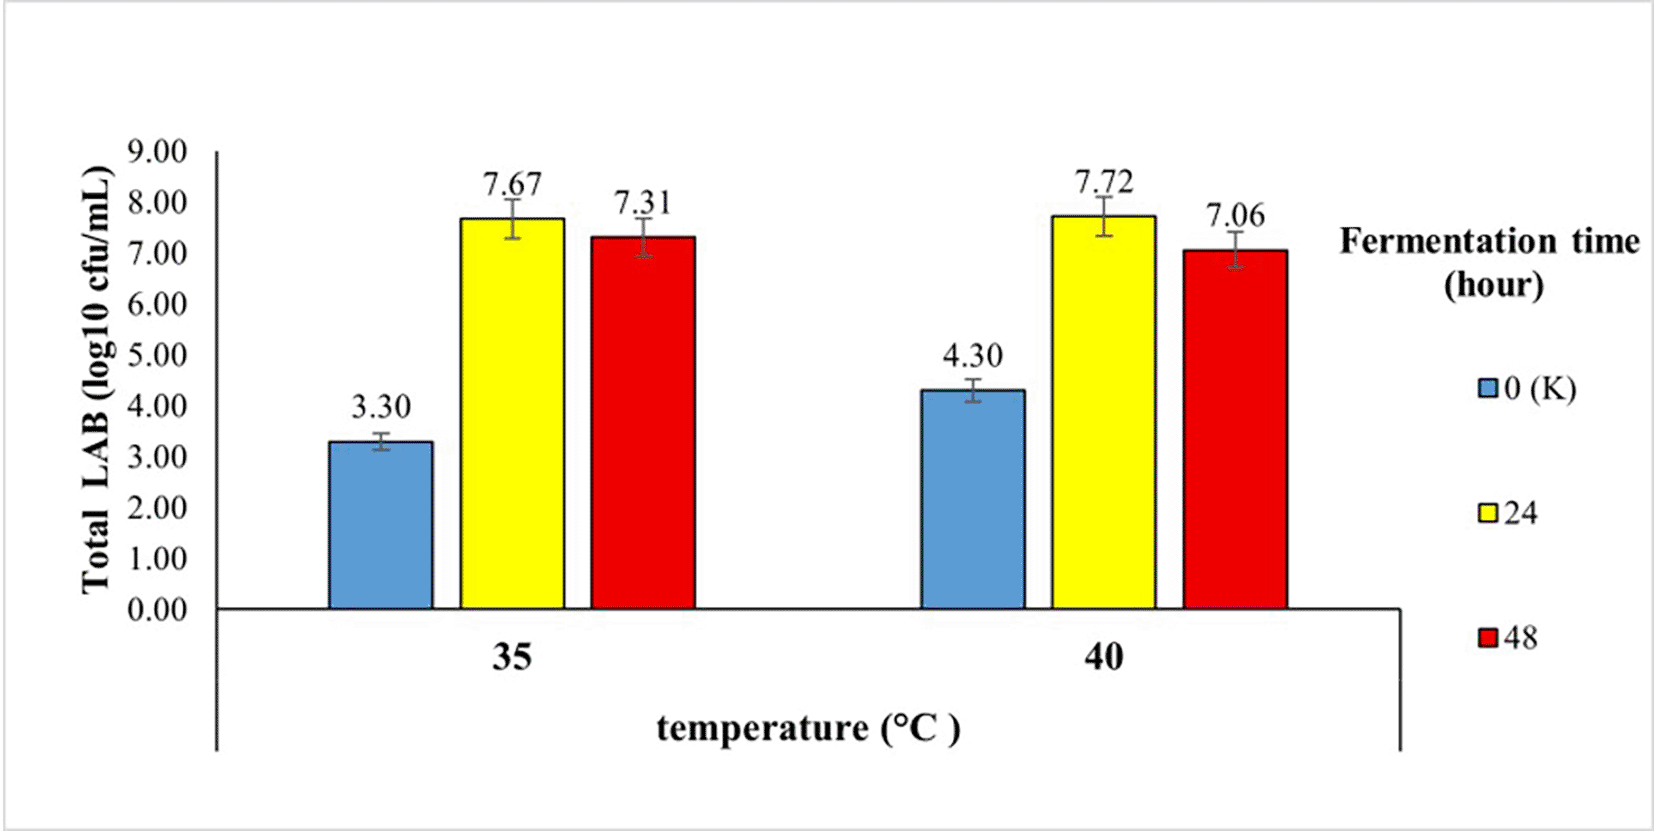
Figure 1 shows that the longer the fermentation, the total lactic acid bacteria increased significantly in the 24th hour of fermentation, namely 7.67 log10 cfu/mL at 35°C and 7.72 log10 cfu/mL at 40°C. This indicates that at 24 h, the growth of LAB entered the log or exponential phase. In the exponential phase, cells grow rapidly and divide at a constant rate until they double.8 At 48 h, there was a decrease in the number of LAB, which began to enter the stationary phase. In this phase, the growing bacteria reach a point of decline in growth rate. The stationary phase is the phase when the growth rate is the same as the rate of microbial death, so that the overall number of microbes remains the same.9
3.2.1 Lightness
The lightness value of Robusta coffee fermented with a kefir starter at different temperatures and fermentation times using the semi-carbonic maceration method ranges from 30.54 to 41.68, as shown in Figure 2.
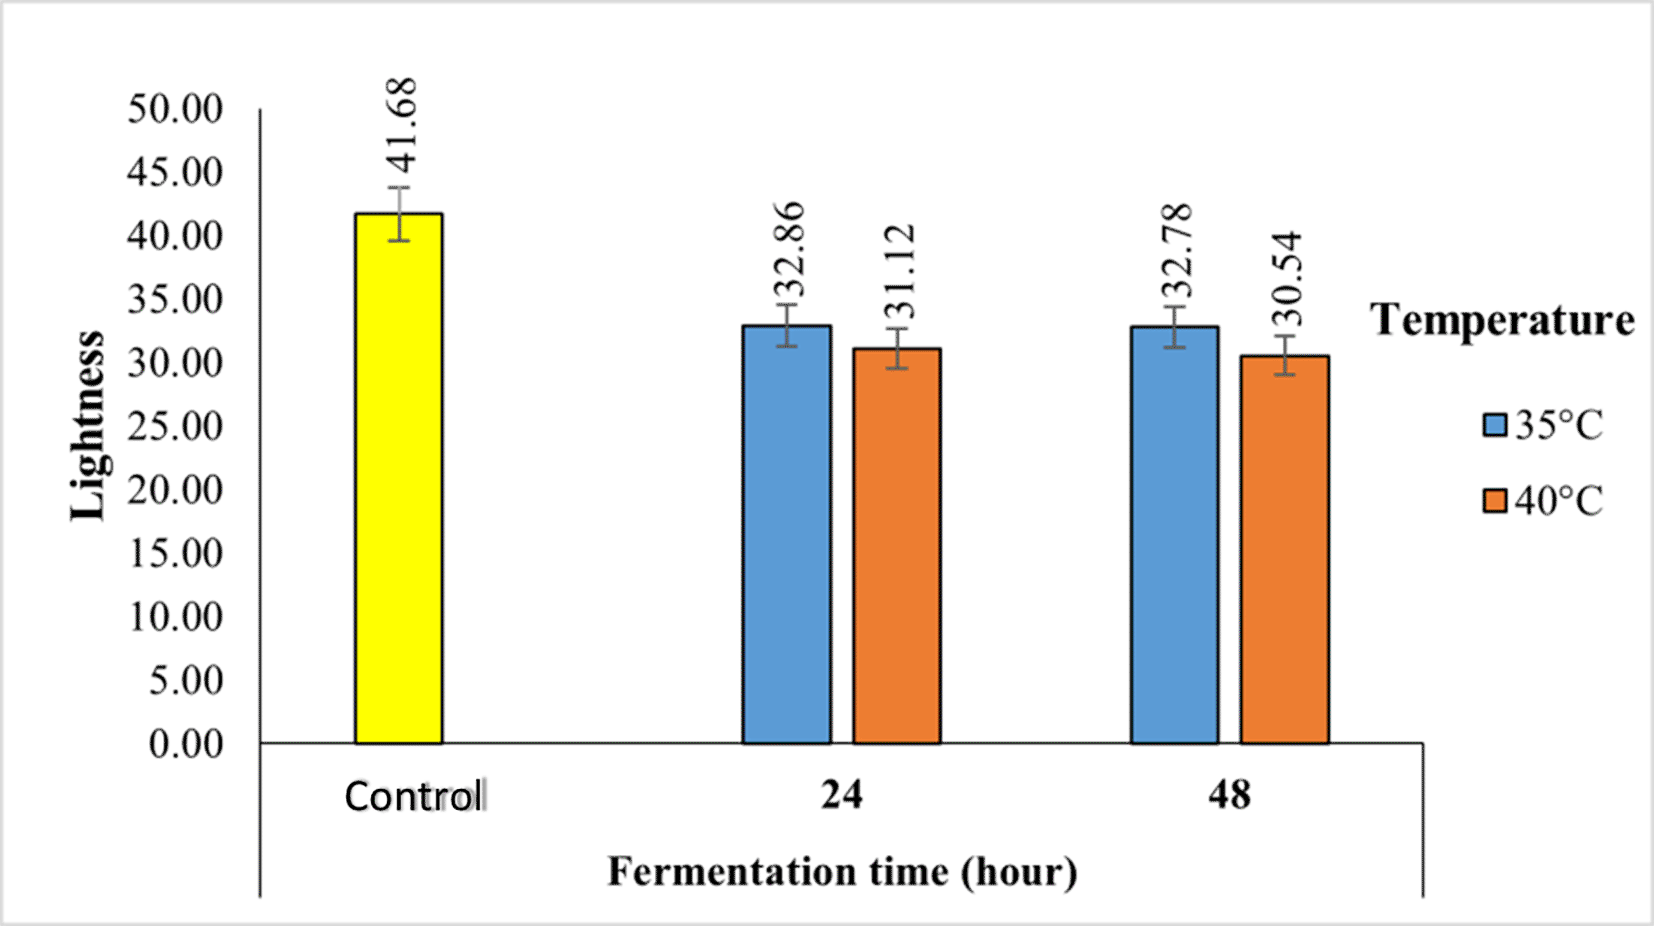
The fermentation process causes the color of coffee to change from yellowish to brownish. Longer fermentation and higher temperatures cause the color of coffee to become browner.
3.2.2 Bulk density
The bulk density value of robusta coffee fermented with a kefir starter at different temperatures and fermentation times using the semi-carbonic maceration method ranges from 0.39 g/mL to 0.50 g/mL, as seen in Figure 3.
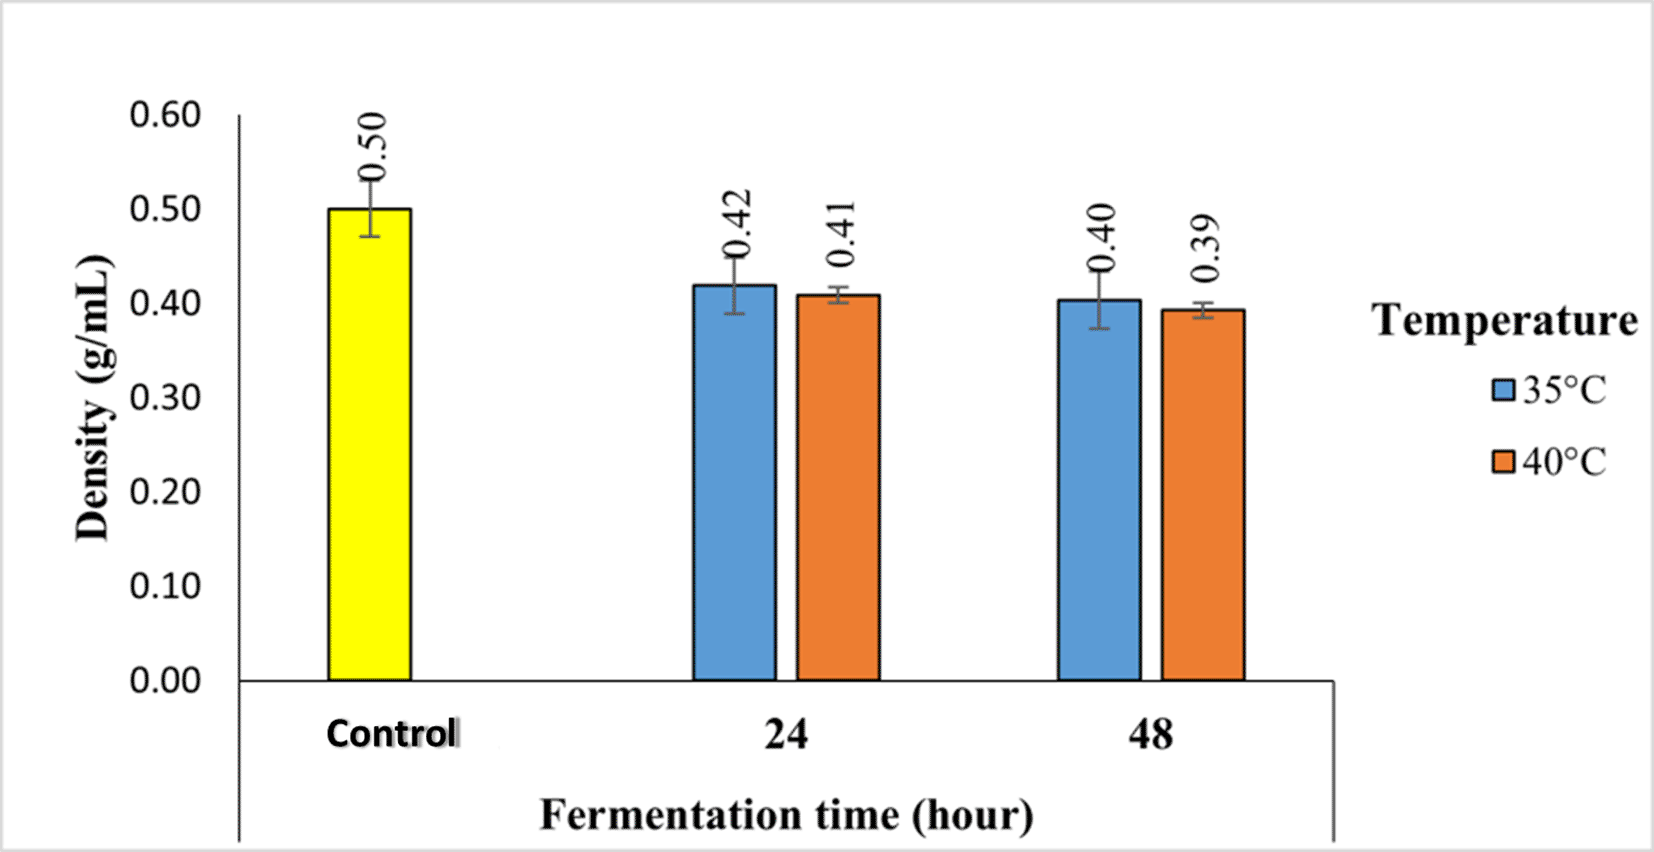
According to Figure 3, it can be seen that the highest density was found in the control sample, which was 0.50 g/mL, decreasing to 0.39 g/mL in 48-hour fermentation at a temperature of 40°C. The longer the fermentation, the lower the density.
3.3.1 Caffeine content
The caffeine contents of robusta coffee fermented with a kefir starter at different temperatures and fermentation times using the semi-carbonic maceration method are shown in Figure 4.
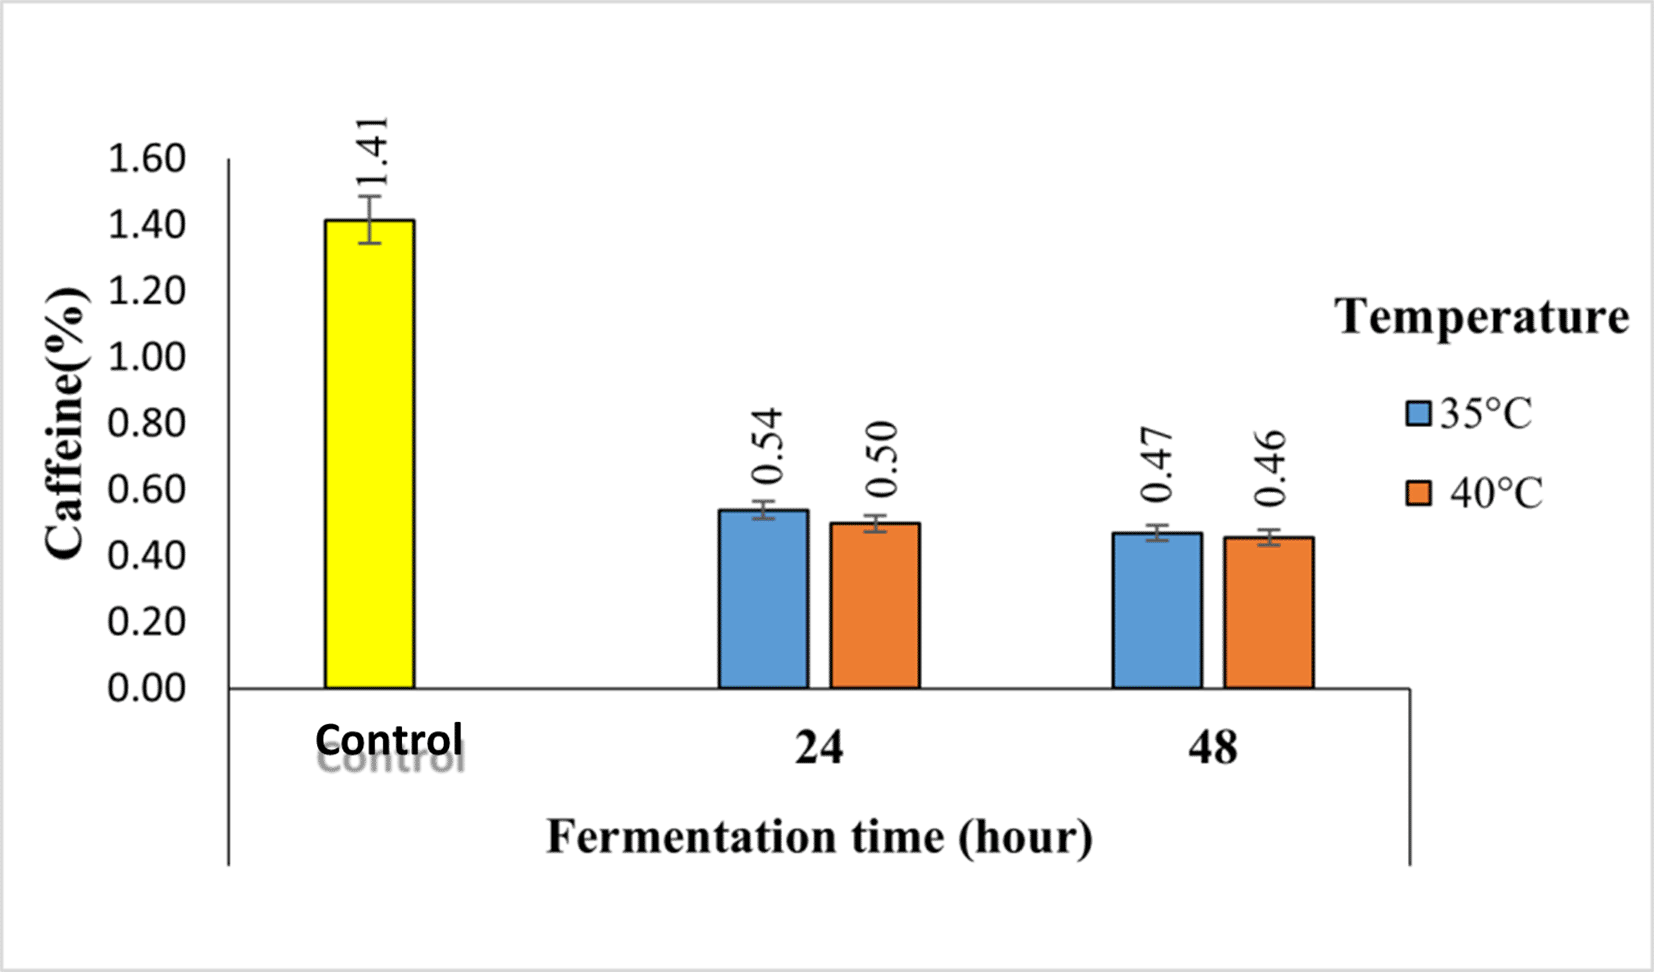
Based on Figure 4, it can be seen that the temperature and duration of fermentation caused a decrease in caffeine levels from 1.14% in the control sample to 0.46% in 48-hour fermentation at a temperature of 40°C.
3.3.2 Reducing sugar
Reducing sugars consist of all monosaccharides (glucose, fructose, and galactose) and disaccharides (lactose and maltose), except sucrose and starch (polysaccharides) (Irwan et al., 2023). The reducing sugar content of Robusta coffee fermented with kefir starter at different temperatures and fermentation times using the semi-carbonic maceration method is shown in Figure 5.
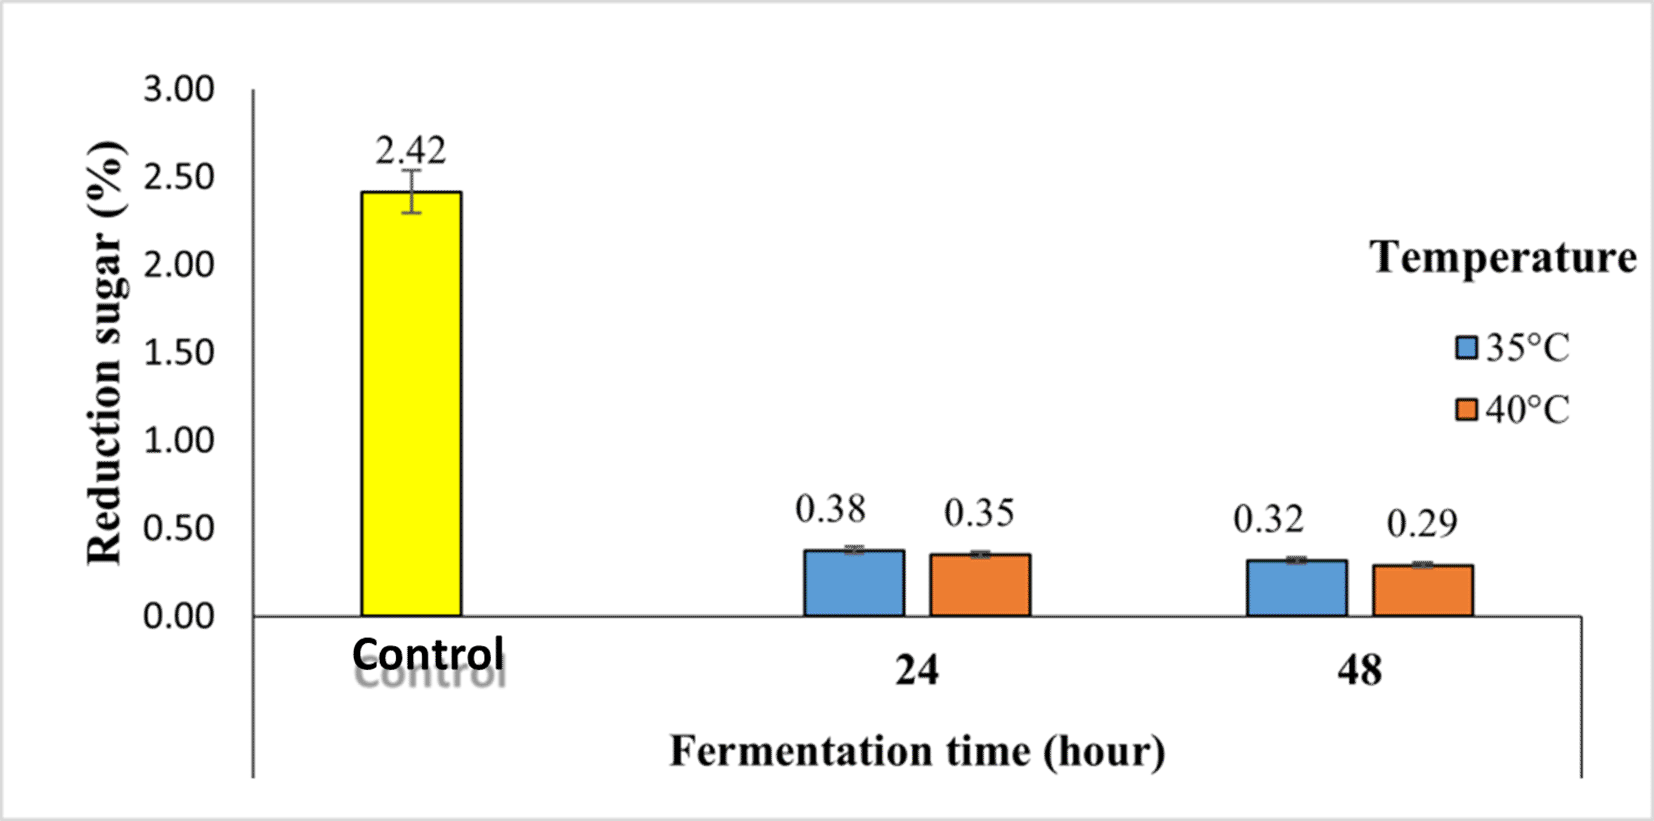
As shown in Figure 5, the longer the fermentation time, the lower the reducing sugar content. In the control sample, the reducing sugar content (2.42%) decreased by 0.29% in 48-hour fermentation at 40°C. The reducing sugar content is related to the microorganisms and carbon sources added during fermentation.
3.3.3 pH
pH is an indicator of the acidity level of coffee. The acidity of a product is influenced by the degradation of sugars into organic acids during fermentation. The pH values of Robusta coffee fermented with a kefir starter at different temperatures and fermentation times using the semi-carbonic maceration method are shown in Figure 6.
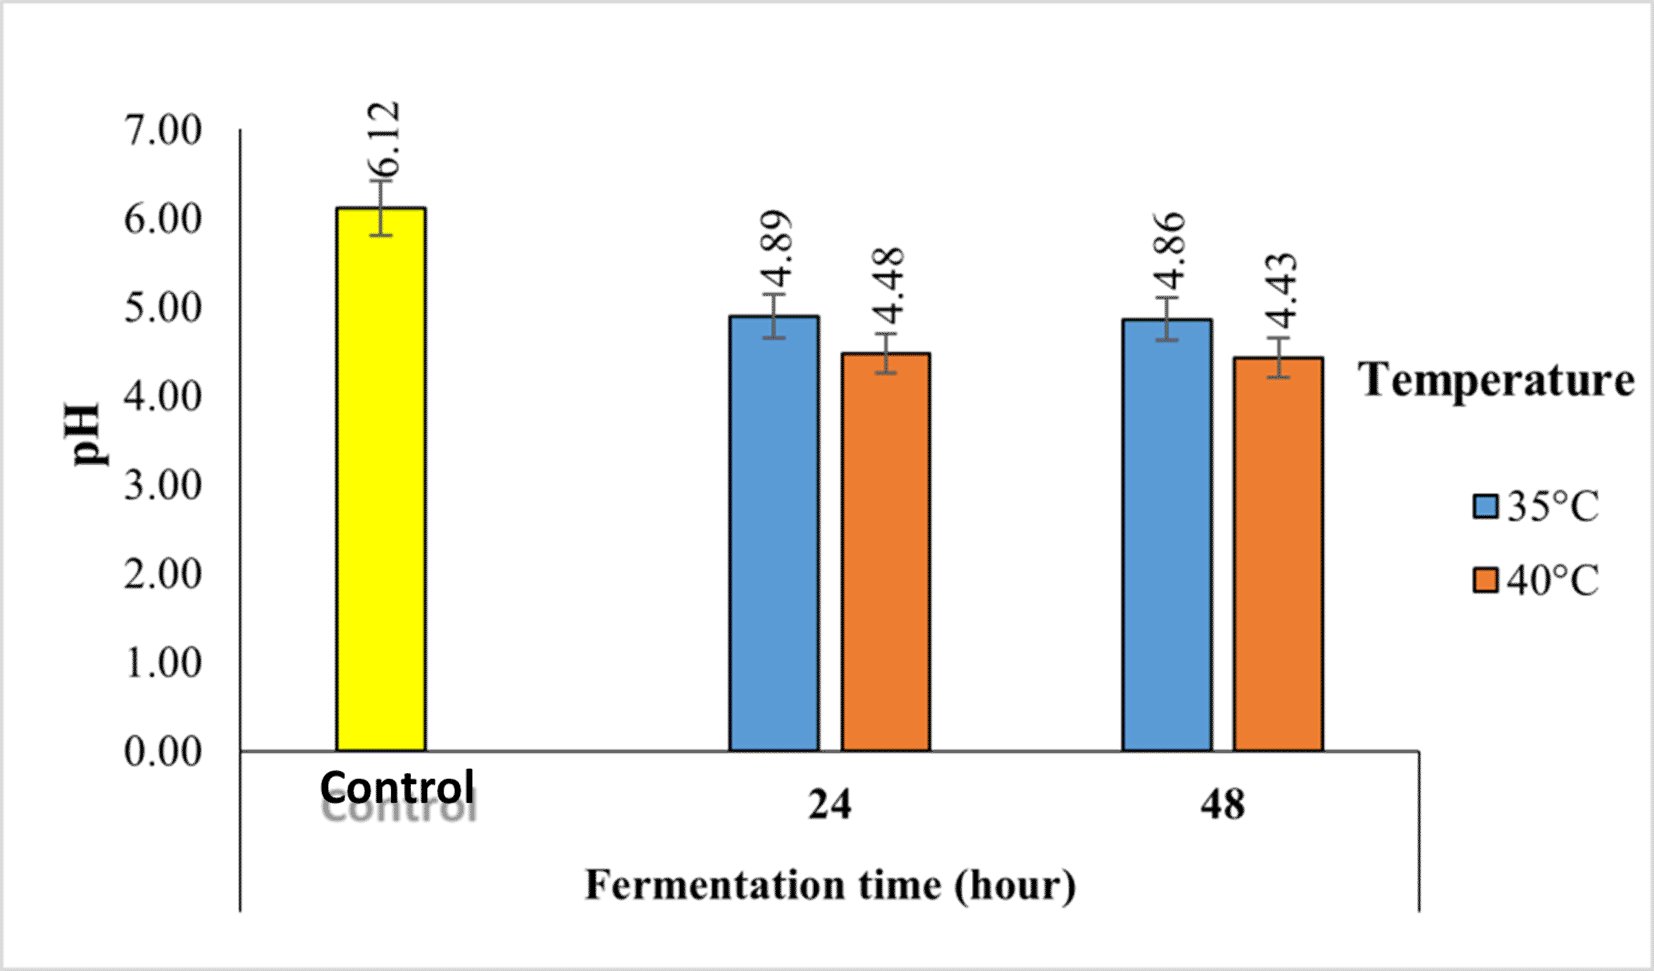
The pH value of robusta coffee beans fermented with kefir starter decreased from 6.12-4.43. Fermentation reduces the pH value. The longer the fermentation time, the lower the pH, which means that the acidity of coffee increases.
3.3.4 Total titrated acid
The titratable acid value is the percentage of acid in the material determined by titration and expressed as a percentage of lactic acid. The total titratable acid of robusta coffee fermented with a kefir starter at different temperatures and fermentation times using the semi-carbonic maceration method ranges from 0.40 to 0.99, which can be seen in Figure 7. The lowest total titratable acid was found in control robusta coffee, or without fermentation, which was 0.40, whereas the highest value was found in robusta coffee fermented by kefir at a temperature of 40°C and a fermentation time of 48 h, which was 0.99.
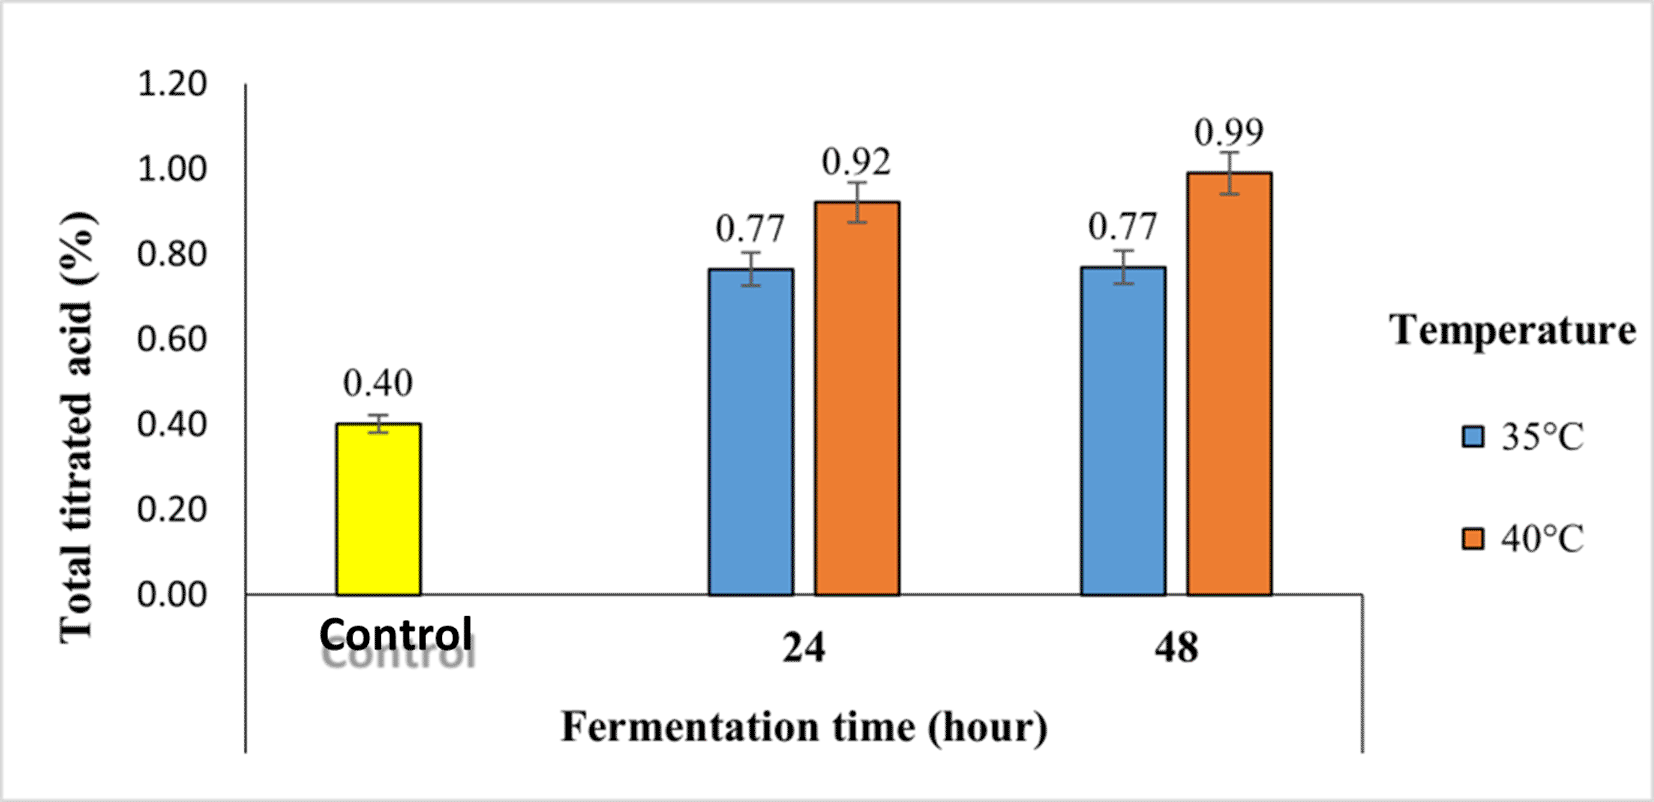
The total titrated acid is correlated with pH. The longer the fermentation and the higher the fermentation temperature, the higher the total titrated acid in coffee.
Fermentation of robusta coffee was performed by adding kefir and lactose as the carbon sources. Kefir contains lactic acid bacteria and yeasts. Lactic acid bacteria (LAB) are types of bacteria that can form lactic acid from glucose or carbohydrate metabolism and grow in a low pH environment.10 Lactic acid bacteria will break down lactose with the enzyme β- galactosidase (lactase) into glucose and galactose.11
Figure 1 shows that the longer the fermentation, the total lactic acid bacteria increased significantly in the 24th hour of fermentation, namely 7.67 log10 cfu/mL at 35°C and 7.72 log10 cfu/mL at 40°C. This indicated that at 24 h, the growth of LAB entered the log or exponential phase. In the exponential phase, cells grow rapidly and divide at a constant rate until they double.8 At 48 h, there was a decrease in the number of LAB, which began to enter the stationary phase. In this phase, the growing bacteria reach a point of decline in growth rate. The stationary phase is the phase when the growth rate is the same as the rate of microbial death, so that the overall number of microbes remains the same.9
The higher the fermentation temperature, the greater the total lactic acid bacteria. According to previous study, temperature can affect microorganisms in two ways: when the temperature rises, the metabolic rate increases and growth is accelerated, and vice versa; and when the temperature drops, the metabolic rate also decreases and growth is slowed down.12 However, if fermentation uses the addition of the inoculum, the fermentation temperature follows the optimum growth temperature of the inoculum. The optimum growth of LAB occurs at 37°C and begins at 10°C. There are three groups of microorganism growth temperatures for microorganisms, namely psychrophilic (7-30°C), mesophilic (30-40°C), and thermophilic (45-60°C). LAB can live at temperatures of 10°C and 45°C.8
4.2.1 Lightness
The lightness value of Robusta coffee fermented with kefir starter at different temperatures and fermentation times using the semi-carbonic maceration method ranges from 30.54 to 41.68 ( Figure 2). The fermentation process causes the color of coffee to change from yellowish to brownish. Longer fermentation and higher temperatures cause the color of coffee to become browner. According to a previous study, the higher the temperature and fermentation time in the fermentor, the higher the number of brown beans.13 The browning process occurs because of the oxidation of polyphenols by the polyphenol oxidase enzyme, which produces brown pigments.14 Chlorogenic acid is present in the phenolic compound group. The browning process can also be caused by the oxidation of chlorogenic acid during the fermentation process acid.15
4.2.2 Bulk density
The bulk density of robusta coffee fermented with a kefir starter at different temperatures and fermentation times using the semi-carbonic maceration method ranges from 0.39 g/mL to 0.50 g/mL, as seen in Figure 3. According to Figure 3, it can be seen that the highest bulk density was found in the control sample, which was 0.50 g/mL, decreasing to 0.39 g/mL in 48-hour fermentation at a temperature of 40°C. The longer the fermentation, the lower the bulk density. This causes water to diffuse more easily into the pores of the coffee beans, resulting in the coffee beans expanding and becoming more porous, such that the coffee beans are larger and the density of the coffee will be lower. In addition, the longer the fermentation period, the higher the microbial activity; thus, it is able to produce metabolites, especially organic acids, during fermentation. These organic acids mix with water, diffuse into the pores of the coffee beans, and increase the breakdown of compounds in coffee, such as caffeine, chlorogenic acid, and other compounds, so that the coffee beans are more porous, and when dried, the density decreases.15
Bulk density is also influenced by differences in fermentation temperature. The higher the temperature, the lower is the density. The bulk density value in this study with a fermentation temperature of 35°C and a fermentation time of 24 hours-48 hours was 0.43 g/mL and 0.41 g/mL, while at a fermentation temperature of 40°C and a fermentation time of 24 hours-48 hours it was 0.41 g/mL and 0.40 g/mL. This is by the previous research research, the density value at fermentation temperatures of 30°C, 35°C, and 40°C, respectively, namely 0.69 g/mL, 0.65 g/mL, and 0.63 g/mL, indicating that the higher the fermentation temperature, the lower the bulk density.13 This is because the greater the increase in fermentation temperature, the greater the loss in coffee weight, which can reduce the bulk density of the coffee produced.16
4.3.1 Caffeine content
The caffeine contents of robusta coffee fermented with a kefir starter at different temperatures and fermentation times using the semi-carbonic maceration method are shown in Figure 4. Based on Figure 4, it can be seen that the temperature and duration of fermentation caused a decrease in caffeine levels from 1.14% in the control sample to 0.46% in 48-hour fermentation at a temperature of 40°C. Fermentation of robusta coffee beans can reduce caffeine levels due to the activity of microorganisms. The reduction in caffeine levels is carried out by microorganisms by degrading caffeine into simpler compounds. Lactobacillus casei and Leuconostoc mesenteroides degrade caffeine to paraxanthine using the N-demethylation method. Paraxanthine is degraded into methylxanthine (1-methylxanthine by Lactobacillus casei, Leuconostoc mesenteroides, and 7-methylxanthine by Rhizopus oryzae and Saccharomyces cerevisiae).17
The caffeine content decreased with increasing fermentation time. The longer the fermentation time, the more caffeine compounds contained in coffee beans dissolve in the solvent.19 This is because caffeine compounds are converted into smaller compounds (paraxanthine and methylxanthine) so that they can easily move and diffuse through the cell walls and dissolve in water.20 In addition, caffeine is degraded into uric acid, 7-methylxanthine, and xanthine during fermentation. According to a previous study, stated that caffeine degradation into uric acid begins after 12 h of fermentation.21 In other previous study caffeine degradation into uric acid begins at 12-36 hours of fermentation.22
In addition, the higher the temperature, the lower is the caffeine content. Caffeine is slightly soluble in cold water or at room temperature but it easily dissolves in hot water. Caffeine easily dissolves as the water temperature increases.18 Caffeine easily dissolves at high temperatures because higher temperatures widen the distance between molecules in coffee solids, resulting in higher solubility of caffeine at high temperatures. In line with the opinion from a previous study, this decrease occurs during the process of dissolving caffeine compounds from coffee beans, which begins with the breakdown of complex caffeine and chlorogenic acid bonds owing to heat treatment.23 Caffeine compounds are smaller in size. Caffeine moves easily, diffuses easily through cell walls, and then dissolves in the solvent.
4.3.2 Reducing sugar
Reducing sugars consist of all monosaccharides (glucose, fructose, and galactose) and disaccharides (lactose and maltose), except sucrose and starch (polysaccharides). The reducing sugar content of Robusta coffee fermented with kefir starter at different temperatures and fermentation times using the semi-carbonic maceration method is shown in Figure 5.
As shown in Figure 5, the longer the fermentation time, the lower the reducing sugar content. In the control sample, the reducing sugar content (2.42%) decreased by 0.29% in 48-hour fermentation at 40°C. The reducing sugar content is related to the microorganisms and carbon sources added during fermentation. In this study, coffee fermentation was supplemented with kefir and lactose. Lactic acid bacteria found in kefir convert lactose into glucose and galactose; then, glucose is converted into organic acids, resulting in a decrease in reducing sugars and an increase in acidity in coffee beans. Fauzi et al. (2013) stated that, as the fermentation time increased, the reducing sugar content of coffee beans decreased because of the activity of the added microorganisms.8
Temperature differences also affect coffee, reducing sugar content; the higher the temperature used, the lower the resulting reducing sugar content. This was due to microbial activity. Microbial activity is influenced by the fermentation temperature, and the optimum temperature increases microbial activity. Lactic acid bacteria can grow at temperatures of 10°C-45°C, but the optimum temperature for lactic acid bacteria is 37°C.24 At a temperature of 40°C, the activity of lactic acid bacteria decreases, but there are still living lactic acid bacteria that the living bacteria utilize the available glucose as a carbon source to decrease the reducing sugar content.
4.3.3 pH
pH is an indicator of the acidity level of coffee. The acidity of a product is influenced by the degradation of sugars into organic acids during fermentation. The pH values of Robusta coffee fermented with a kefir starter at different temperatures and fermentation times using the semi-carbonic maceration method are shown in Figure 6.
The pH value of robusta coffee beans fermented with kefir starter decreased from 6.12-4.43. Fermentation reduces the pH value. The longer the fermentation time, the lower the pH, which means that the acidity of coffee increases. The decrease in pH during fermentation is influenced by the microbial activity of the added starter. Kefir contains lactic acid bacteria that can help form organic acids, which results in a decrease in pH. Organic acids are metabolite compounds that are formed as a result of the metabolic activity of acid-forming bacteria, especially lactic acid and acetic acid bacteria. According from a previous study, organic acids formed during coffee fermentation are bacterial catabolic products that cause a decrease in pH, including malic acid, acetic acid, chlorogenic acid, and quinic acid.25 Fermented coffee is still suitable for consumption if it has a pH value above 4.26
Based on Figure 6, it can be seen that the higher the fermentation temperature, the lower the coffee pH. The pH value is also related to the optimal temperature for lactic acid bacteria, which is 37°C. Based on previous research, fermentation at 30°C resulted in a pH value that tended to increase as the fermentation time progressed.27 If the temperature is less than 30°C, the growth of acid-producing microorganisms will be slow, thus affecting the quality of the product, and the pH value in coffee is determined by the acid content in coffee.26
4.3.4 Total titrated acid
The titratable acid value is the percentage of acid in the material determined by titration and expressed as a percentage of lactic acid. The total titratable acid of robusta coffee fermented with a kefir starter at different temperatures and fermentation times using the semi-carbonic maceration method ranges from 0.40 to 0.99, which can be seen in Figure 7. The lowest total titratable acid was found in control robusta coffee, or without fermentation, which was 0.40, whereas the highest value was found in robusta coffee fermented by kefir at a temperature of 40°C and a fermentation time of 48 h, which was 0.99.
The total titrated acid is correlated with pH. The longer the fermentation and the higher the fermentation temperature, the higher the total titrated acid in coffee. The increase in the total acid content during fermentation is closely related to the increasing activity of lactic acid bacteria. During growth, bacteria use carbohydrate sources (sugar) and convert them into organic acids. The accumulation of acid produced during fermentation causes a decrease in pH. The LAB group uses sugar as an energy source, mainly lactic acid and acetic acid. A decrease in pH value is followed by an increase in the total titrated acid value, and vice versa. When the pH value increased, the total titrated acid decreased.
The increase in total acidity during fermentation is closely related to the increase in microbial activity and decrease in acidity during fermentation. The formation of organic acids during fermentation occurs because bacteria use sugar during their growth and convert it into organic acids. The pH decreases owing to the accumulation of acid produced during fermentation.27 Longer fermentation times increase the total titrated acid during fermentation because microbes convert lactose into glucose and galactose, which are then broken down into organic acids and alcohol until the sugar in the food runs out, resulting in an acid that increases with the length of fermentation.28
Excel data: “Physical and Chemical Characteristics of Robusta Coffee Beans.”
https://doi.org/10.7910/DVN/U4FQAD.29
The project contains the following underlying data:
• Physical Characteristics of Robusta Coffee Beans
• Chemical Characteristics of Robusta Coffee Beans
Data are available under the terms of the CC0 1.0 Universal (CC0 1.0).
We would like to thank the National Innovation Research Agency, Indonesia (BRIN). This research was supported by RIIM LPDP Grant and BRIN (grant numbers 146/IV/KS/11/2023 and 10875/UN25.3.1/LT/2023. We also thank the University of Jember for the convenience of their research facilities.
| Views | Downloads | |
|---|---|---|
| F1000Research | - | - |
|
PubMed Central
Data from PMC are received and updated monthly.
|
- | - |
Is the work clearly and accurately presented and does it cite the current literature?
Partly
Is the study design appropriate and is the work technically sound?
Partly
Are sufficient details of methods and analysis provided to allow replication by others?
No
If applicable, is the statistical analysis and its interpretation appropriate?
No
Are all the source data underlying the results available to ensure full reproducibility?
Partly
Are the conclusions drawn adequately supported by the results?
Partly
Competing Interests: No competing interests were disclosed.
Reviewer Expertise: Coffee fermentation, ohmic heating system, physicochemical characterization
Alongside their report, reviewers assign a status to the article:
| Invited Reviewers | |
|---|---|
| 1 | |
|
Version 1 24 Nov 25 |
read |
Provide sufficient details of any financial or non-financial competing interests to enable users to assess whether your comments might lead a reasonable person to question your impartiality. Consider the following examples, but note that this is not an exhaustive list:
Sign up for content alerts and receive a weekly or monthly email with all newly published articles
Already registered? Sign in
The email address should be the one you originally registered with F1000.
You registered with F1000 via Google, so we cannot reset your password.
To sign in, please click here.
If you still need help with your Google account password, please click here.
You registered with F1000 via Facebook, so we cannot reset your password.
To sign in, please click here.
If you still need help with your Facebook account password, please click here.
If your email address is registered with us, we will email you instructions to reset your password.
If you think you should have received this email but it has not arrived, please check your spam filters and/or contact for further assistance.
Comments on this article Comments (0)