Keywords
Cumulative Function, Hazard Function, Logistic function, Median, Mode, Probability Density Function, Reliability Function.
This article is included in the Fallujah Multidisciplinary Science and Innovation gateway.
Cumulative Function, Hazard Function, Logistic function, Median, Mode, Probability Density Function, Reliability Function.
One of the well-known functions that used in studying the differential equations or dynamical systems in biology, ecology epidemic, economic, etc. is the logistic functions and its iterator.1
The first mathematical study the logistic function were Verhulst a Belgian mathematician, considered one of the first to study logistic growth where in (1838) used the Logistic Map in the law of population growth,2 James Yorke an American mathematician, studied the map of logistics, chaos (1975) and Robert Mayer, an Australian ecologist, studied logistic mapping and its applications in ecology (1976). Mitchell Feigenbaum, an American physicist, studied the chaotic behavior of logistic models (1978).
This logistic equation can exhibit chaotic or periodic behavior, and the Poincaré map can be used to study this behavior and identify critical points and chaotic regions. By applying the Poincaré map, which implies that the pendulum's behavior is demonstrated by the difference equations,3 to logistic equations, one can gain deeper insights into the dynamical behavior of these systems and understand how they change with varying parameters.
The aim of this research is to find a new distribution based on a function used in differential equations, which is the logistic function, and to study the statistical properties of this distribution. In the next section, fall details of the logistic function will be given:
Any statistical distribution must satisfy and approximate all the statistical concepts, such as pdf, cdf, reliability function,1 hazard function,4 mode,5 median, moment generating function (MGF),6 factorial moment-generating function (FMGF), characteristic function,7 coefficient of variation (C.V), coefficient of kurtosis (C.K)8 …etc.
The study is divided into five sections: the second one, “Basic Definitions,” is followed by the “structure of building the logistic distribution” in section three, is followed by “results and discussion” in section four, and “conclusion” rounds off the study in section five.
Logistic map is a first-order difference equation discovered which by mathematical biologist Robert May. It's defined by the equation: , where x is any population of nth generation, ≥ 0 the intrinsic growth rate and k is the carrying capacity.
This model is commonly used in the study of biological populations, including genetics (change in gene frequency), epidemiology (proportion of infected population), economics (relationship between commodity quantity and price), and social sciences.
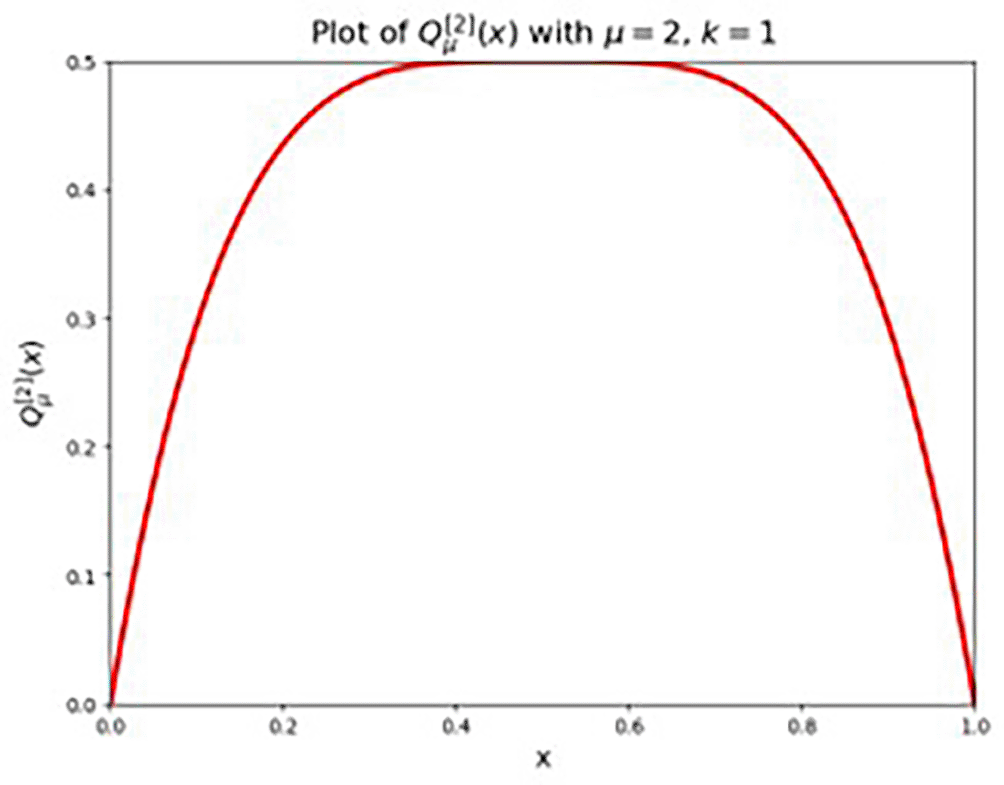
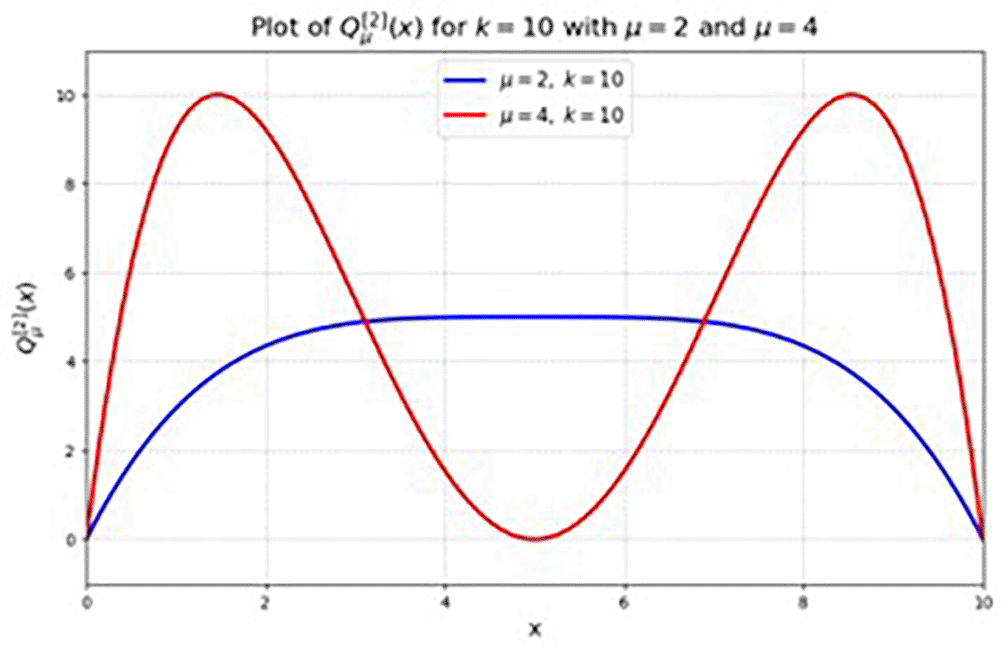
An item that works well at first, but after a period of time it breaks down. Although it can be repaired, after repair it works less efficiently than before. That is, the item goes through a repeated cycle of failure and repair, but with efficiency that decreases with each repetition as shown in Figures 1 and 2. This type of behavior can be classified under the second iteration of the logistic function and can be written as:
When we integral the second iteration of the logistic function for lower value zero and upper value k to determine A's value, let presume:
Now, it well be transferred to differential equation (the second iteration of the logistic function) to the statistical distribution.
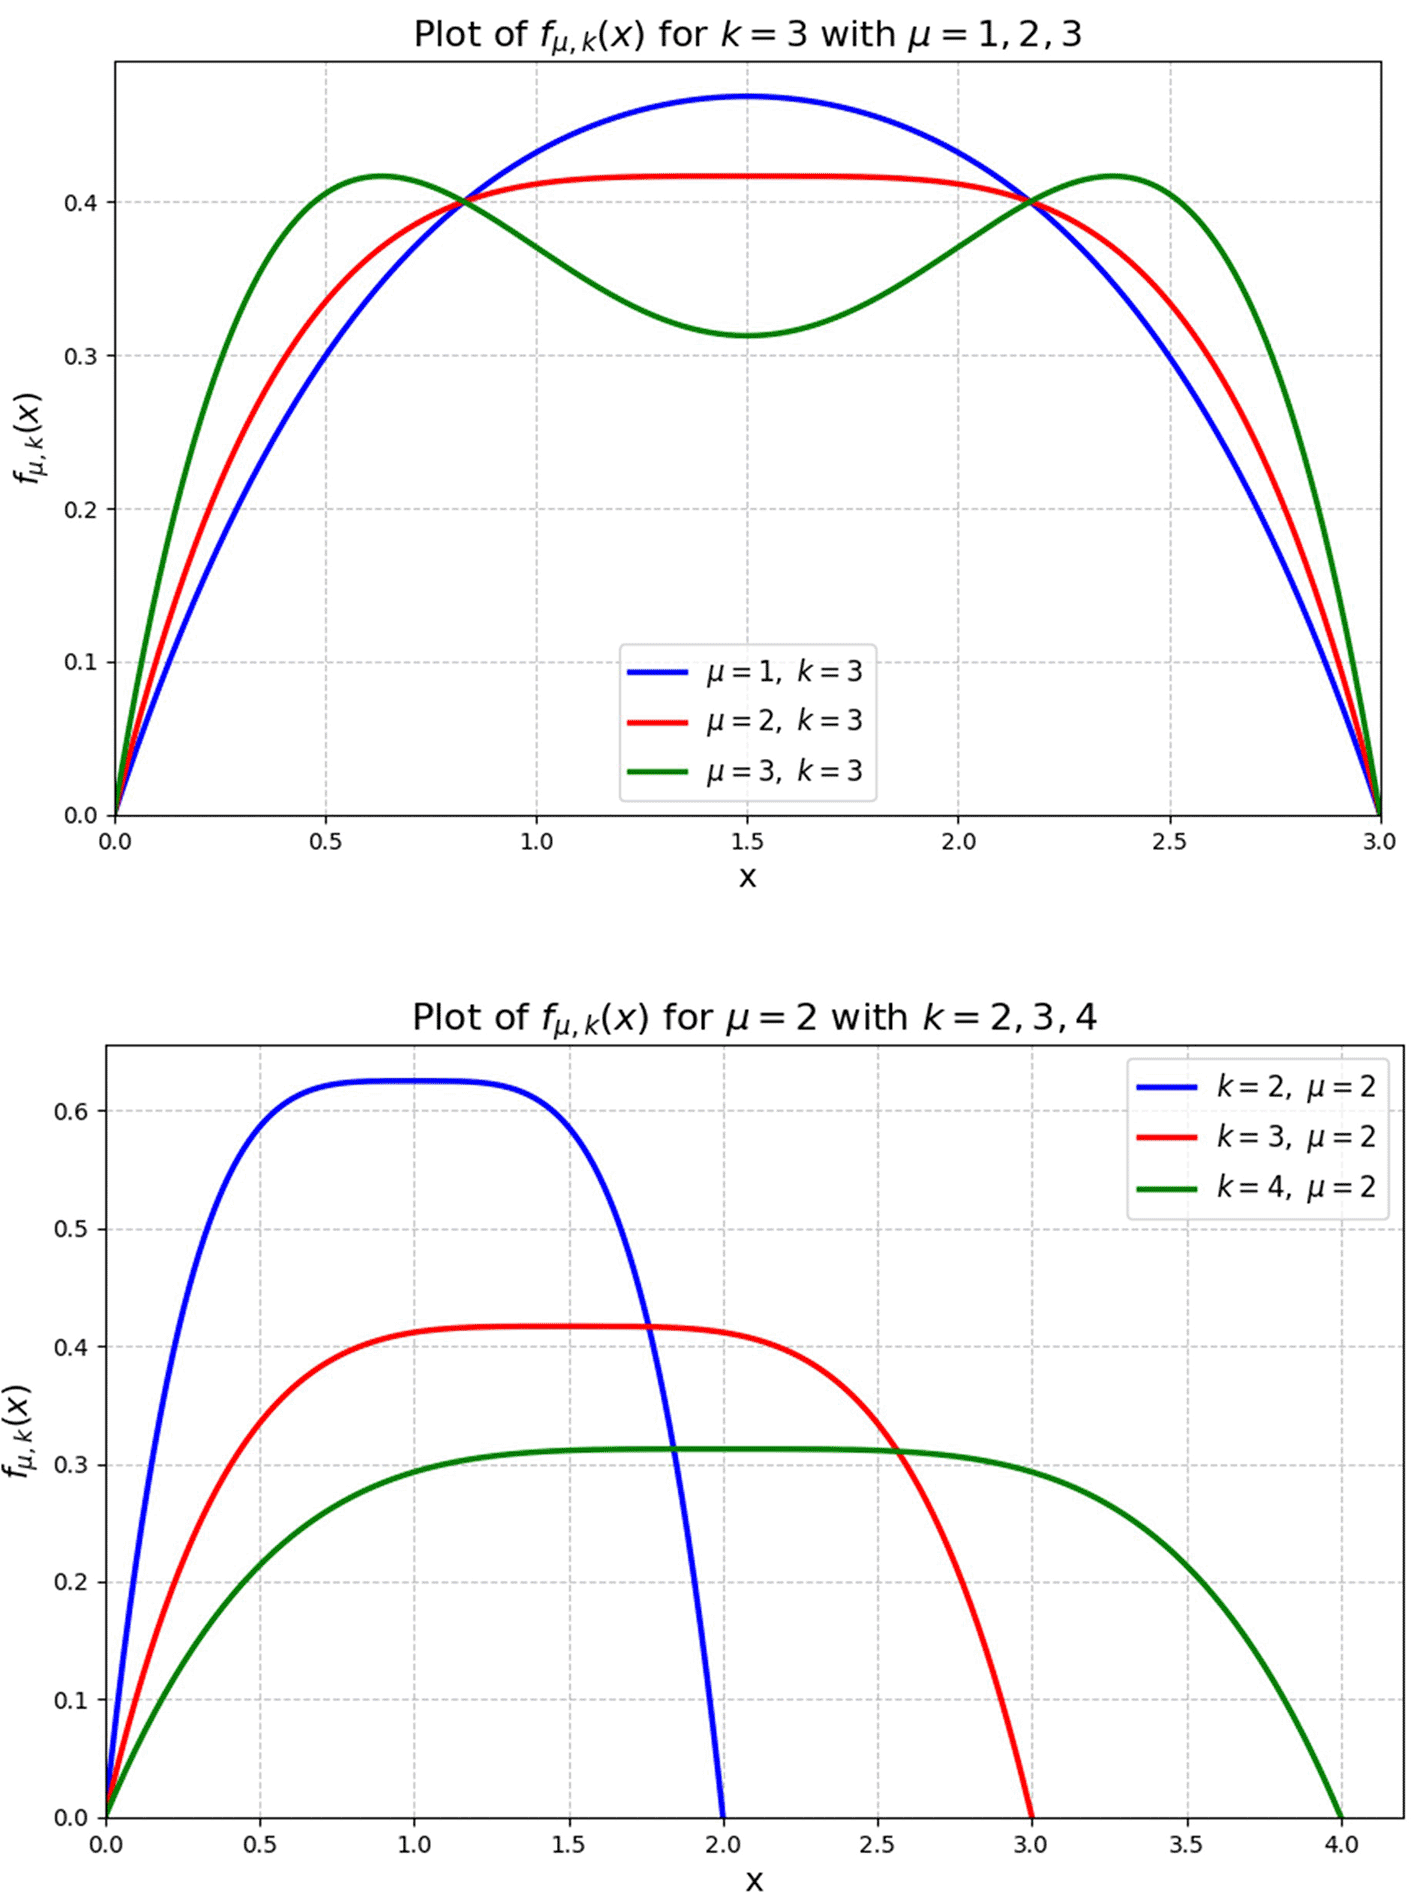
The function is obtained by multiplying the function in order to obtain the probability density function for logistic map distribution, as shown in Figure 3 the form:
is a pdf
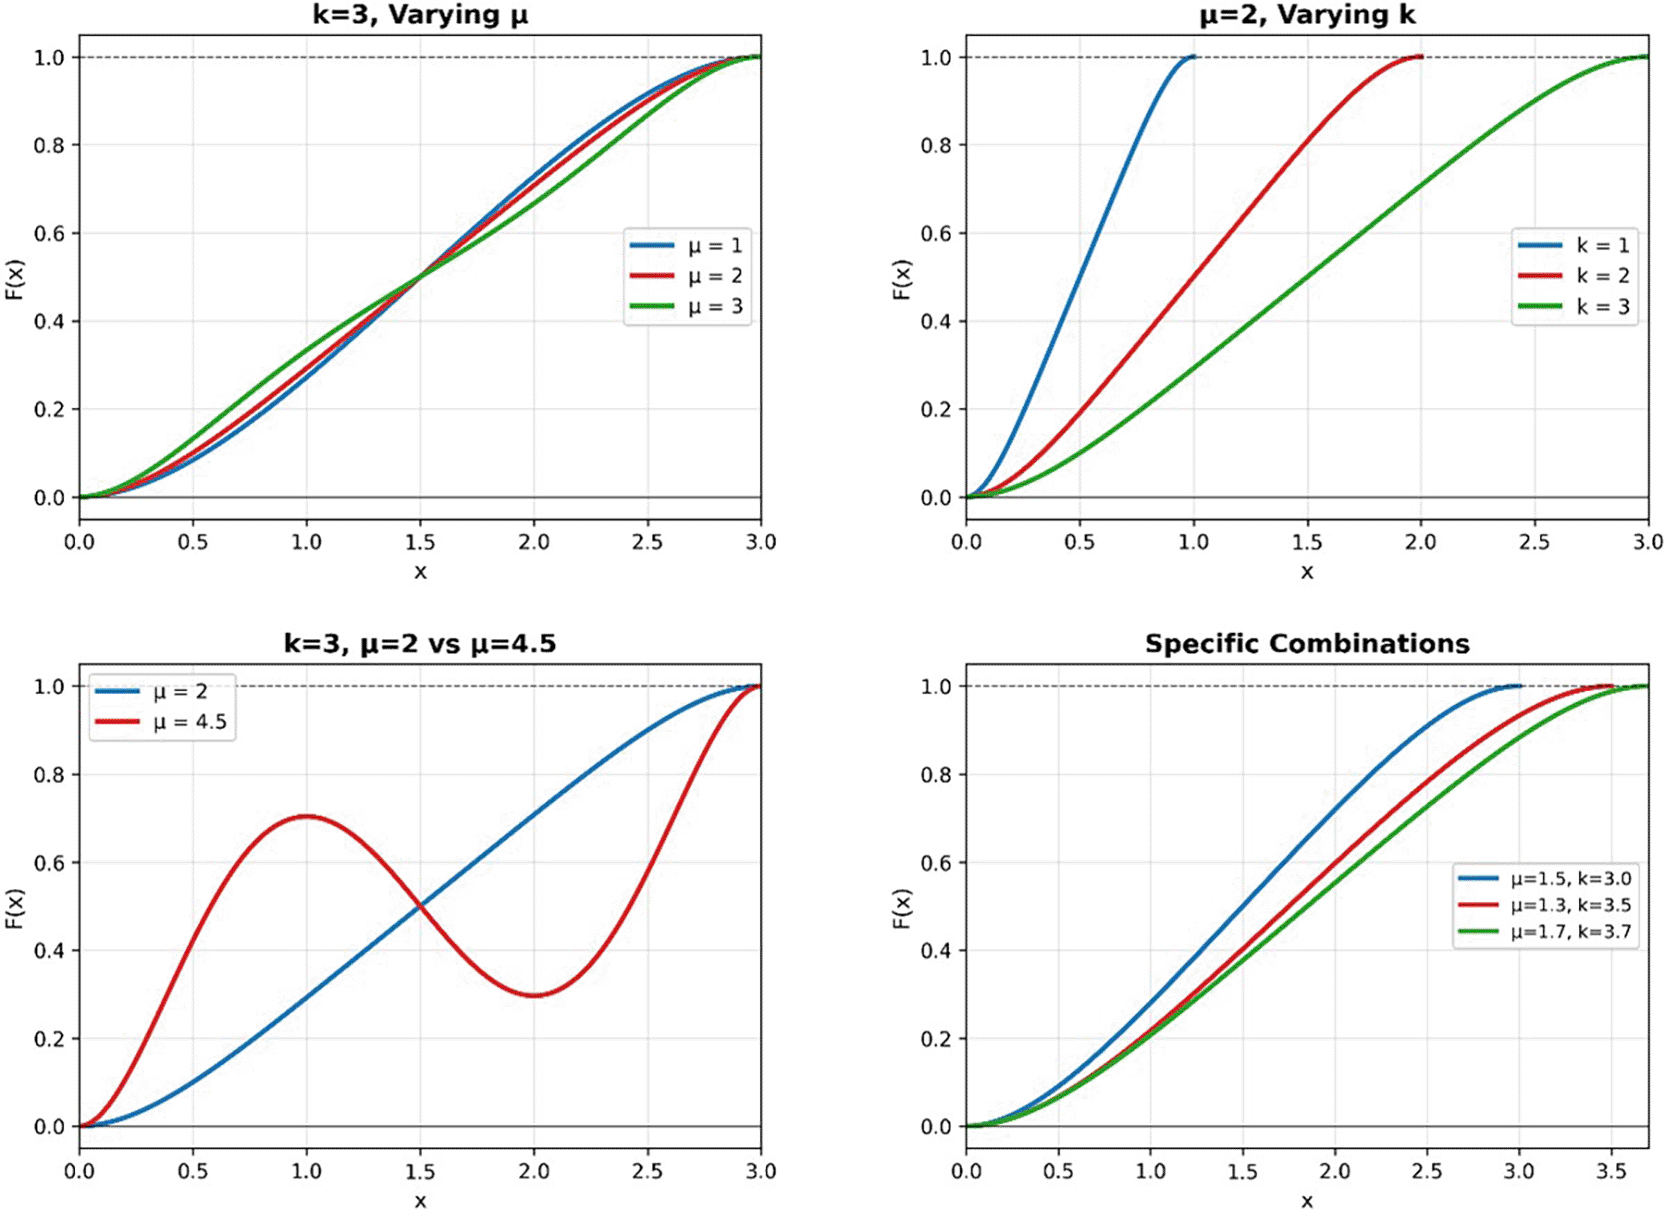
Let x be a continuous non-negative random variable (r.v.). The Cumulative Distribution Function (CDF) of x is given by the following equation as in Figure 4
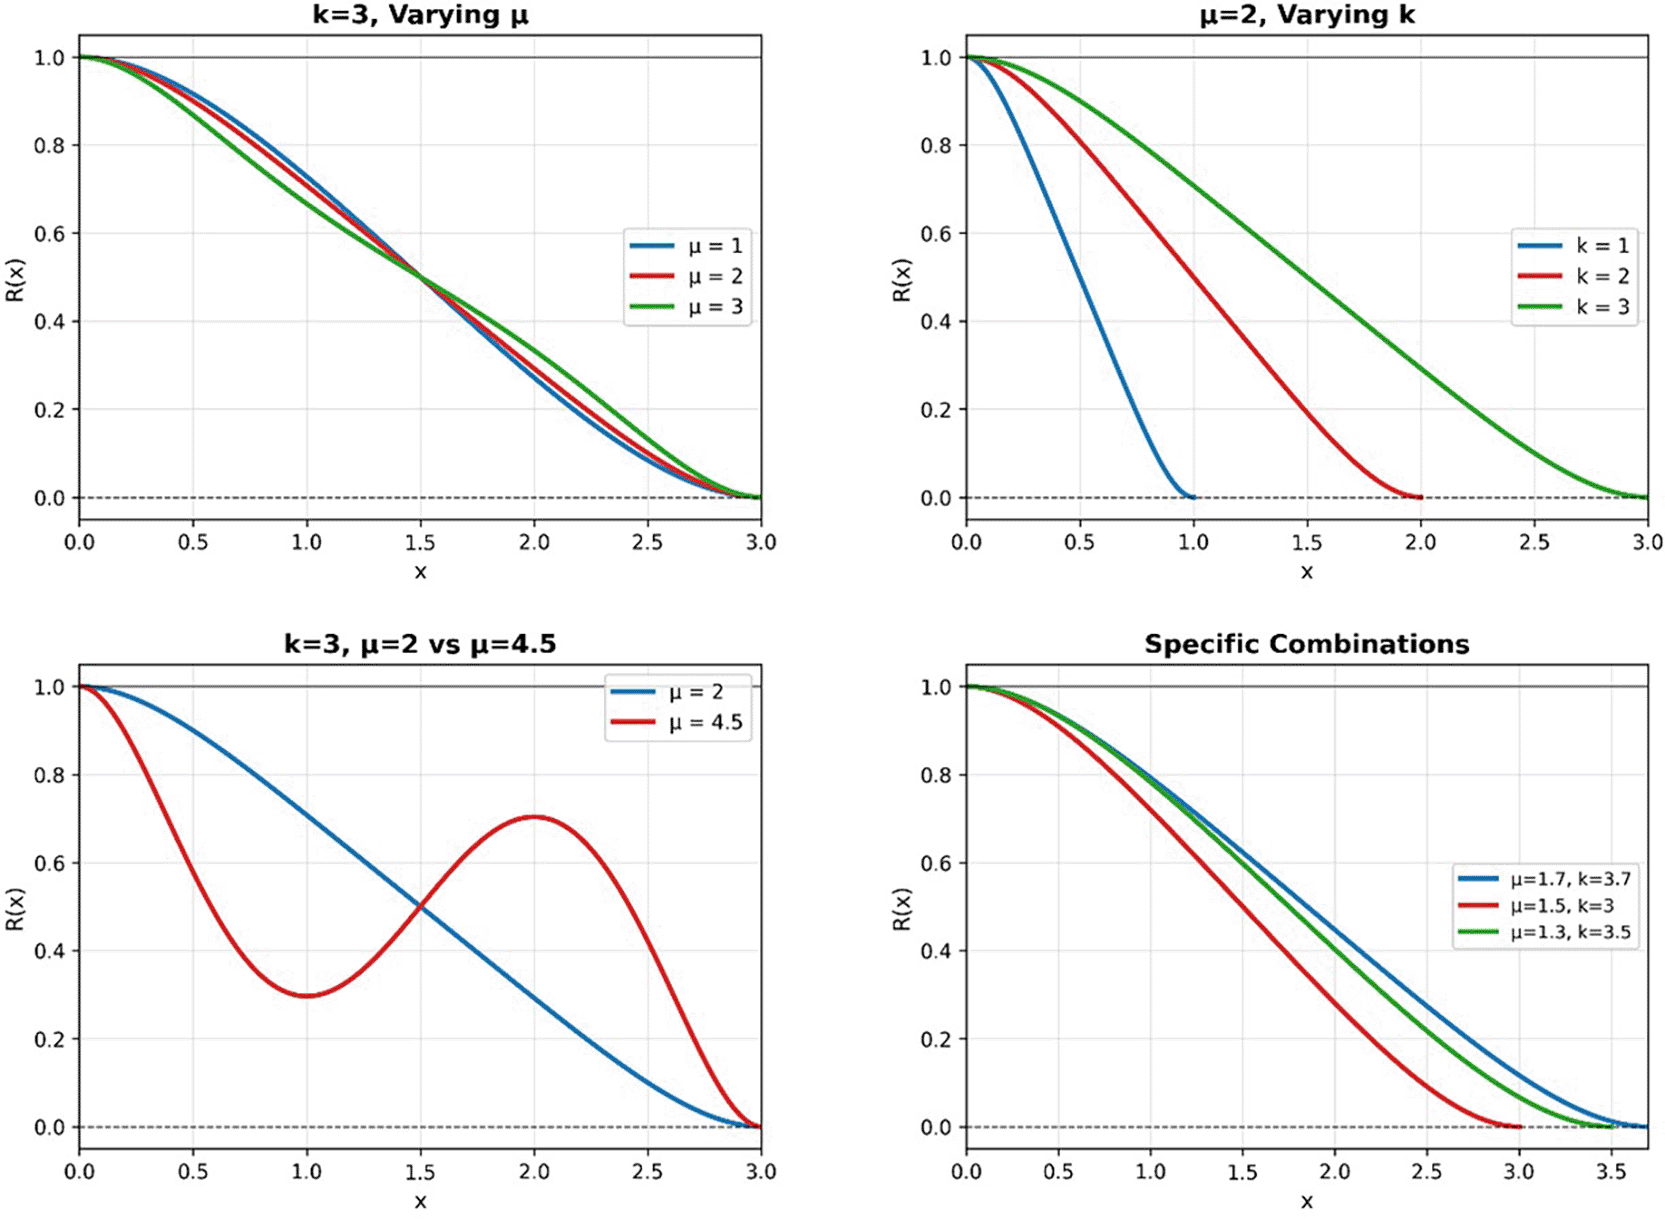
Assuming that x is a continuous non-negative random variable following a Logistic map distribution, the reliability function as in Figure 5 of x is given by:
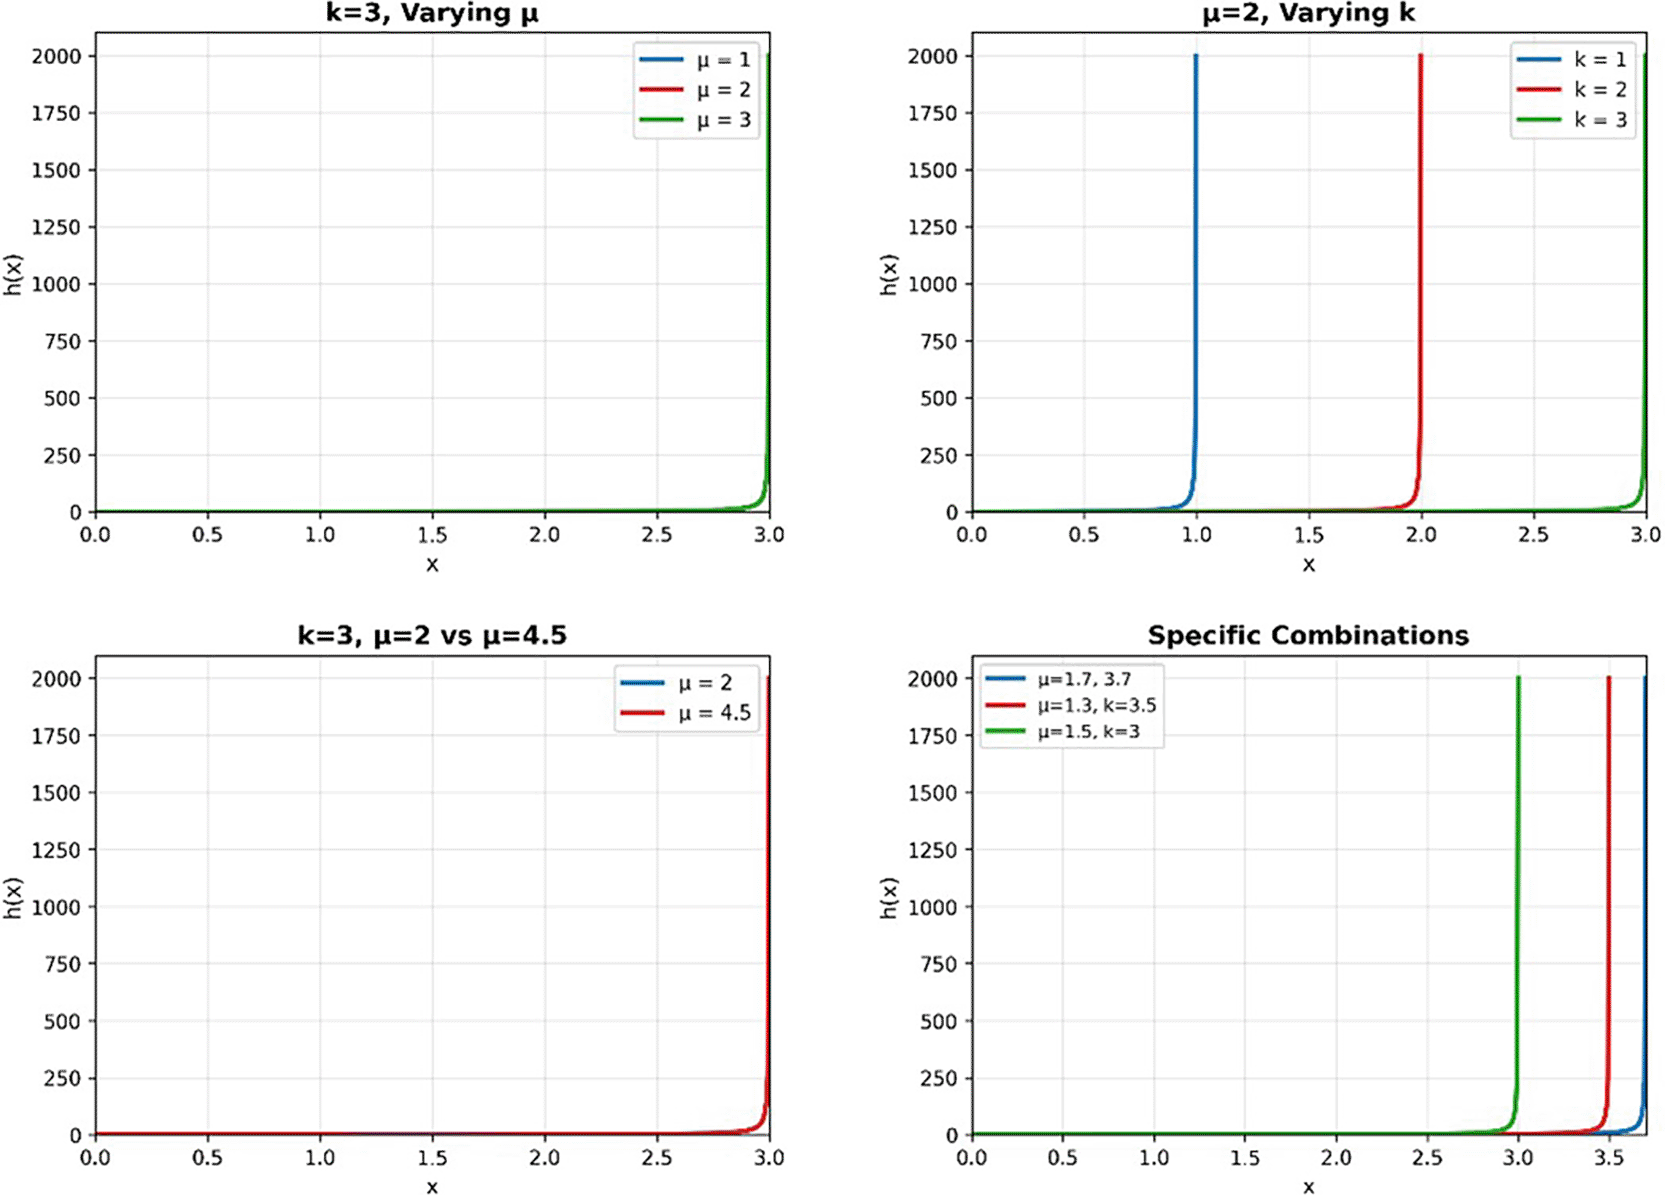
The hazard function for x is as follows, assuming that x is a continuous positive r.v. distributed with logistic map distribution as in Figure 6:
This section aims to present a novel logistic map distribution for a discrete dynamical system that is specified by second iteration of the logistic function.
The mode of is
For the random variable X, the density function's first derivative equals zero we discover:
Both sides are multiplied by the following equation is obtained:
Since this equation is a polynomial of degrees 3, we obtain:
There are many roots for Equation (2), as observed in the shape of the density function Equation (1). So, if is a root of Equation (2), this root's depends on the second derivative of the equation. That means if the second derivative of the root is less than zero, then the point or the root is a local maximum. Or if the second derivative of the root is greater than zero, then it is a minimum point.
The value of is compensated for in Equation (3), we obtain:
When the value of is compensated for in Equation (3), we obtain:
Then, the mode is
Let x be a continuous non-negative r.v. distributed according to the logistic map distribution, then the median of x is derived as in the form9:
The rth moment function for x is as follows, assuming that x is a positive r.v. distributed as the logistic map distribution9:
If r = 1,2 is substituted in the rth moment function, Lemma 7 may be used to obtain the mean and variance for the logistic map distribution.
Now find var( x) so we can get it through:
The Moment generating function (MGF) for x is given by, assuming that x is a positive r.v. distributed according to the logistic map distribution10:
Let x be a non-negative continuous r.v. has the logistic map distribution then the Factorial moments generating function of x is in the form:
Let x be a non-negative continuous r.v. has the logistic map distribution then the Coefficient of Variation of x is in the form7:
Let x be a non-negative continuous r.v. has the logistic map distribution then The Coefficient of Skewness of x is in the form:
The Coefficient of Skewness is given by:
If r = 3 is substituted in the rth moment function, Lemma 7 may be used to obtain the .
This method is one of the most important and most used method for estimating parameters for all distribution.11 The idea of this method is to find the estimate parameters for any distribution which maximize the likelihood function.12
Suppose that are (i.i.d) random variable with joint pdf .
The likelihood function for two parameters for logistic map distribution
Taking log-likelihood function is:
Following are the partial derivatives of the log-likelihood function with respect to the unidentified parameters
The partial derivatives of the log-likelihood function with respect to unknown parameters are:
Then the formula of the Newton-Raphson method is as follows:
Then the error term is formulated as:
Where . Tables 1 and 2 represent the results of the MLE estimation method for the distribution parameters.
The results from the simulation in different sample size and replicate 1000 with displayed in Table 1.
The results from the simulation in different sample size and replicate 1000 with displayed in Table 2.
The proposed Logistic Map distribution, with its bounded support on and flexible shape governed by the parameter, offers a theoretically grounded and practically relevant tool for modeling non-negative random variables with a finite upper limit. Its derivation from a well-established dynamical system provides a unique link between nonlinear dynamics and statistical modeling.
Given its structural properties particularly its ability to accommodate various hazard rate shapes (increasing, decreasing, or bathtub - shaped), the distribution is especially well-suited for applications in reliability engineering and survival analysis, where it can effectively model the lifetimes of components or systems with a known maximum operational lifespan. Furthermore, its bounded nature makes it appropriate for quality control in manufacturing processes, (e.g., Additive Manufacturing: Powder bed fusion requires tight control over metal powder size), the PDF can model batches with varying spread where measurements are constrained within physical or specification limits.
Beyond engineering contexts, the distribution holds promise in environmental sciences for modeling durations or intensities of bounded natural phenomena (e.g., drought periods, pollutant decay times), and in actuarial science for risk assessment of events with finite horizons. The explicit forms of its reliability and hazard functions further enhance its applicability in predictive maintenance and risk management frameworks. The Logistic Map distribution constitutes a valuable addition to the family of bounded probability models, with significant potential for adoption in any discipline requiring flexible, mathematically tractable models for finite-domain data. Thereby offering a valuable alternative to classical distributions such as the Beta or Kumaraswamy in contexts where physical or operational constraints impose a hard upper limit on the variable of interest.
| Views | Downloads | |
|---|---|---|
| F1000Research | - | - |
|
PubMed Central
Data from PMC are received and updated monthly.
|
- | - |
Provide sufficient details of any financial or non-financial competing interests to enable users to assess whether your comments might lead a reasonable person to question your impartiality. Consider the following examples, but note that this is not an exhaustive list:
Sign up for content alerts and receive a weekly or monthly email with all newly published articles
Already registered? Sign in
The email address should be the one you originally registered with F1000.
You registered with F1000 via Google, so we cannot reset your password.
To sign in, please click here.
If you still need help with your Google account password, please click here.
You registered with F1000 via Facebook, so we cannot reset your password.
To sign in, please click here.
If you still need help with your Facebook account password, please click here.
If your email address is registered with us, we will email you instructions to reset your password.
If you think you should have received this email but it has not arrived, please check your spam filters and/or contact for further assistance.
Comments on this article Comments (0)