Introduction
The beat-to-beat cycling of cytosolic calcium and membrane voltage are key processes that are critical for normal func- tion of the heart.1–3 Measuring the dynamics of these processes is therefore a key experimental approach in understanding cardiac physiology, disease modelling and drug screening. To achieve this, cardiac cells or tissue are commonly labelled with calcium or voltage sensitive fluorophores,4,5 or genetically encoded sensors,6–9 and fluorescent amplitude changes, representing changes in cytosolic calcium concentration or membrane voltage, are measured over time. Recently, there has been significant growth in the use of high-throughput platforms, such as high content screening systems, or automated microscopes for this application. For example, one such advanced technique is kinetic imaging cytometry (KIC) that leverages microscopy-based imaging platforms to continuously track and quantify the fluorescent readout from populations of many individual cells over time.10,11 When applied in plate-based assays, this approach can result in acquisition of data from tens of thousands of individual cells. As a result of emerging approaches such as this, the requirement for automated, hands-off quality control, processing and analysis of these datasets has increased as the size and complexity of the datasets has grown.
To address this, we developed KICA (Kinetic Imaging Cytometry Analyser), a MATLAB-based12 package designed for efficient high-throughput processing and analysis of fluorescent time-series data. KICA automates key processes such as signal denoising, drift correction, signal-to-noise ratio (SNR) calculation, pulse detection and analysis. In addition to these features, KICA also offers scalability for large datasets by utilising parallel computing to significantly reduce computation time, so streamlining the pipeline for researchers and improving the accuracy and efficiency data analysis. Although KICA is platform agnostic (requiring only CSV describing fluorescent amplitude over time) it also specifically handles data inputs in export format from Vala Sciences CyteSeer software.13 KICA has been used in several research studies with applications to both calcium and voltage signals, in acutely isolated as well as induced pluripotent stem cell (IPSC) derived cardiomyocytes, to study both pharmacological interventions and to investigate cardiac pathologies.14–18 These studies demonstrate the utility of KICA in extracting meaningful biological insights from complex datasets.
In this paper, we describe the development and implementation of KICA, detailing its architecture and features. We discuss the software’s quality control mechanisms and validate its performance using real-world data. Finally, we demonstrate KICA’s scalability and reuse potential for various cytometry applications supporting its use as a tool for laboratories or facilities undertaking high-throughput experimentation in cardiac physiology and drug screening.
Methods
KICA is implemented in MATLAB using an object-oriented programming approach, which provides flexibility and mod- ularity. The software is composed of several core components, each responsible for a specific aspect of the data analysis pipeline, from data ingestion to signal processing and result reporting. The overall workflow of KICA is structured into five main stages:
Each of the above stages is handled by a dedicated module, which makes up the core components of KICA.
Implementation
•
Data import module: Imports time-series data from CSV files generated by imaging software (e.g., CyteSeer). The module also checks for the correct format and extracts key metadata such as sampling rate. The csvread or readtable function in MATLAB is used to load data into the workspace. The sampling rate is inferred by analysing the timestamps or metadata in the CSV file header.
•
Signal processing module: Responsible for denoising, baseline drift correction, and SNR calculation.
Figure 1 gives an overview of the signal processing performed by KICA. The initial raw signal, including a polynomial fit used for baseline correction, is depicted in
Figure 1(A). Following denoising and baseline correction, the processed signal with detected individual beats is shown in
Figure 1(B).
Figure 1(C) provides an expanded view of two beats from the processed signal, illustrating the detection of fiducial points corresponding to depolarisation and repolarisation.
−
Denoising: Utilises a wavelet-based denoising technique to reduce noise in the time-series data. This method decomposes the signal into wavelets, removes noise components, and reconstructs the signal with minimal distortion. The MATLAB wdenoise function is applied, which automatically selects optimal thresholds based on the signal-to-noise ratio.
−
Baseline Drift Correction: Removes low-frequency components in the signal, which cause drift over time. This is achieved by fitting a polynomial to the baseline and subtracting it from the raw signal. A polynomial fitting algorithm (polyfit) is used to model the baseline drift, which is then subtracted from the signal.
−
SNR Calculation: The signal-to-noise ratio is calculated to assess the quality of the signal. This helps in iden- tifying poor-quality data before pulse detection. SNR is calculated as the ratio of the mean signal amplitude to the standard deviation of the noise.
•
Pulse detection module: Detects pulses and performs pulse-related analyses such as peak and upstroke detection, APD calculation, and pulse-stimulus validation.
−
Peak Detection: Identifies peaks in the signal that correspond to action potentials or calcium transients. The findpeaks function in MATLAB detects local maxima based on specified thresholds for peak prominence and width.
−
Upstroke Detection: Determines the rate of the signal’s upstroke, which corresponds to the rapid depolari- sation phase in action potentials. The upstroke is detected by calculating the slope of the signal between consecutive data points, and the maximum slope is identified as the upstroke.
−
Action Potential/Calcium Transient Duration (APD/CTD): Calculates the duration between the upstroke and the return of the signal to baseline levels. APD/CTD is calculated as the time difference between the upstroke time and user specified percentages (e.g., 50, 75, 90%) of the return to baseline.
−
Rise and Fall times: Calculates the time from 10% to 90% of peak in the rising phase of the calcium transient (Rise time) and from 90% to 10% of peak in the falling phase of the calcium transient (Fall time).
•
Quality control module: Ensures data integrity by validating signals based on SNR and pulse detection.
− Ensures the quality of the data by validating each signal based on the SNR and the presence of valid pulses. Signals that do not meet the criteria are flagged and excluded from further analysis. Threshold values for SNR and pulse detection are predefined by the user. If the SNR is below the threshold or no valid pulses are detected, the signal is flagged as failing quality control.
•
Reporting module: Generates Excel reports with pulse characteristics and saves images of the analysed signals for each cell.
− Generates detailed Excel reports that summarise the results of the analysis. The report includes key metrics for each cell, including pulse duration, peak amplitude, and APD, as well as visualisations of the analysed signals. The xlswrite function in MATLAB is used to create structured reports with embedded figures for each analysed cell. The visualisation is produced using MATLAB’s plotting functions and saved as images in the report. In addition to the Excel report, the software also allows for saving MATLAB figures (.fig) for each individual cell for more in depth interrogation and preparation of publication quality figures.
•
Parallelisation module: Utilises MATLAB’s Parallel Computing Toolbox to distribute tasks across multiple CPU cores for efficient high-throughput analysis.
− KICA takes advantage of MATLAB’s Parallel Computing Toolbox to distribute the computational load across multiple CPU cores. This is especially important for high-throughput datasets, where the number of cells analysed can exceed thousands. The parfor function is used to parallelise the processing loop, allowing the analysis of each cell to run concurrently across available CPU cores. The time-series data from each cell is processed independently, making it an ideal candidate for parallelisation.
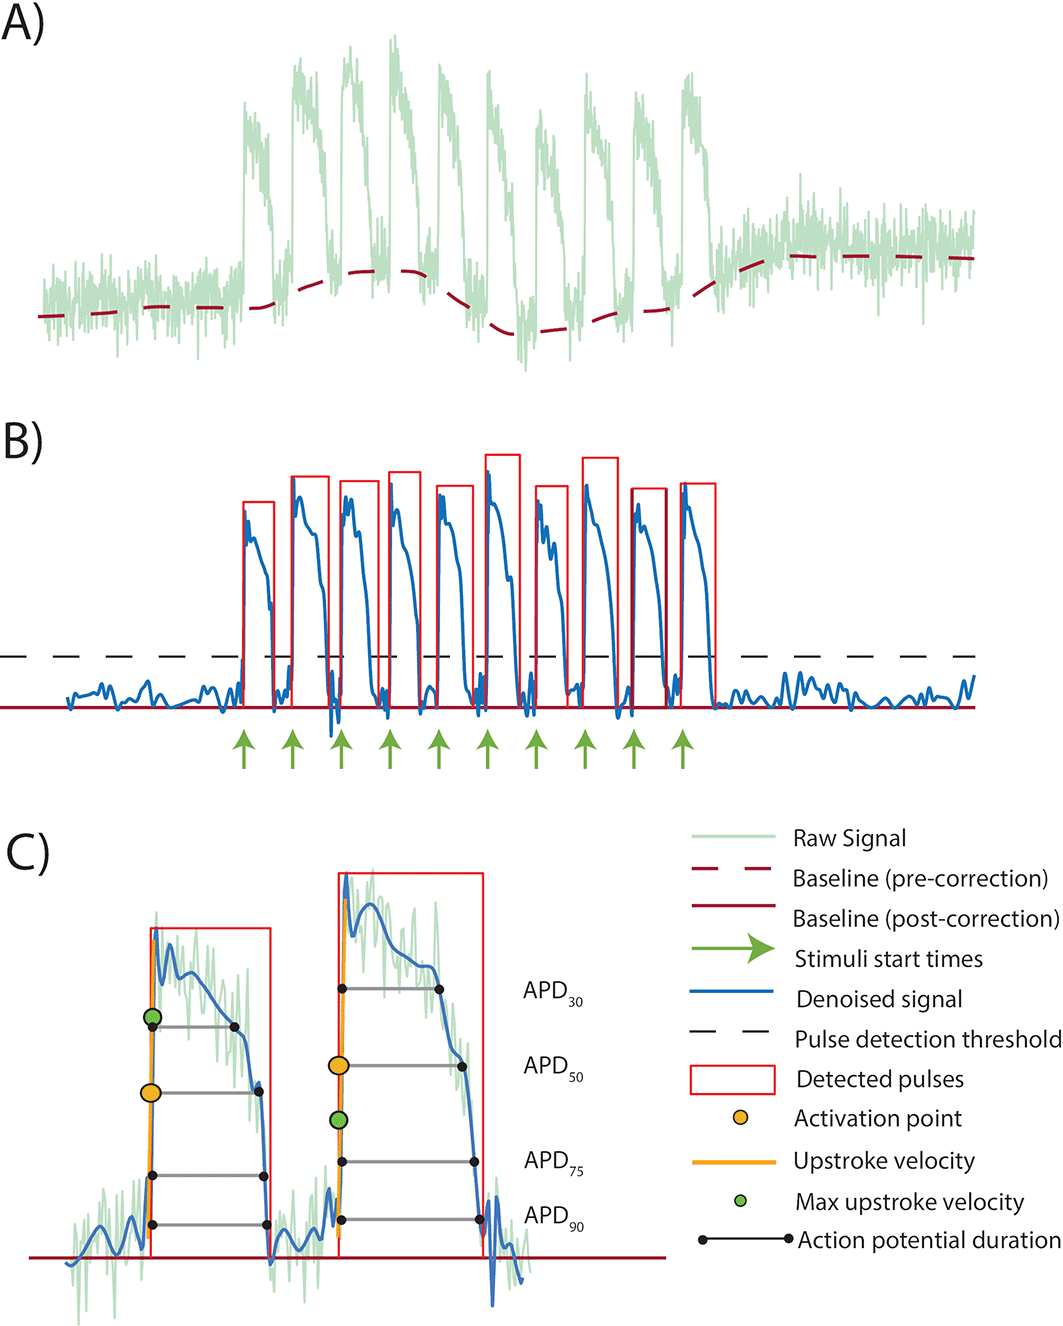
Figure 1. Overview of signal processing using KICA.
A) Raw signal showing fluorescent reports of ten paced cardiac action potential waveforms. A polynomial fit to the baseline (used for baseline correction) is shown. B) Baseline corrected and denoised signal. Individual beats/pulses are detected via threshold crossing. C) Expanded view of first two action potentials from (B), showing fiducial points related to action potential depolarisation and repolarisation.
Comparison with existing tools
Several software tools exist for analysis of datasets in this domain, each with specific implementations and focus areas. Here, we compare KICA with other widely used tools and highlight key differences:
CellProfiler19 is a popular tool used for image-based analysis, but it primarily focuses on image segmentation and feature extraction from static images rather than time-series data. While CellProfiler is powerful for high-throughput image analysis, it lacks dedicated algorithms for time-series data processing, such as pulse detection or signal drift correction, which are core functionalities of KICA. CellProfiler’s strength lies in its image analysis capabilities, while KICA is designed specifically for time-series data, offering advanced signal processing and pulse detection features.
Fiji,20 another popular tool for biological image analysis, provides plugins for various types of signal processing, including signal analysis of fluorescent time-series data. However, the implementation is often plugin-based, requiring manual intervention and lacking the scalability for high-throughput environments. KICA, on the other hand, is optimised for high-throughput processing with multi-core parallelisation, making it more suitable for large-scale data. Fiji plugins typically operate on a per-file basis, whereas KICA is built to handle large batches of time-series data with minimal user input, offering automated workflows and parallel computing support.
Several MATLAB-based cytometry analysis tools focus on general signal processing for various biological data types.21–23 While these tools offer flexibility in handling cytometry data, they often require significant customisation for specific applications such as cardiomyocyte analysis. On the other hand, KICA provides an integrated solution with ready-to-use algorithms for cardiac-specific metrics like action potential duration (APD) and rise/fall time calculations. KICA also distinguishes itself by providing a streamlined, high-throughput workflow for time-series data, with built-in quality control and reporting, which are not available as integrated features in other tools.
Validation
Ensuring the reliability and accuracy of KICA is critical for its use in high-throughput studies. Several levels of testing have been carried out on the code to ensure that it performs optimally across different scenarios.
•
Unit testing: Each core component of KICA, such as the signal processing, pulse detection, and reporting modules, has been subjected to unit testing. This ensures that individual functions perform as expected when provided with known inputs.
•
Functional testing: KICA’s entire workflow has been tested to verify that the software produces accurate re- sults when applied to realistic datasets. Functional testing includes verifying that the pulse detection algorithm identifies peaks and action potential durations correctly.
•
Load testing: KICA has been tested with large datasets (each dataset containing up to 250 cells and 2300 data points) to ensure its scalability and performance in high-throughput environments. The software was tested on both single-core and multi-core configurations using MATLAB’s Parallel Computing Toolbox. For load testing, we used a Dell OptiPlex workstation equipped with an Intel Core i7 processor and 16 GB of RAM.
•
Platform testing: KICA has been successfully tested on the Microsoft Windows operating system with MATLAB versions R2020b, R2021a and R2024b. Generating Excel reports in MATLAB requires ActiveX support, which is not available on operating systems such as Linux and MacOS. Consequently, KICA is incompatible with these platforms.
Operation
KICA requires MATLAB R2020b or newer running on a Microsoft Windows operating system (10+). The MATLAB Parallel Computing Toolbox, Audio Toolbox, Bioinformatics Toolbox, Signal Processing Toolbox, and Wavelet Toolbox are required dependencies. The workflow for users involves loading input data (CSV files), setting analysis parameters (e.g., signal type, thresholds, durations), running the main KICA script, and reviewing the generated Excel report and individual cell figures.
Use cases
To help users quickly understand if the software is functioning correctly and how to apply it to their data, KICA includes example input datasets and a detailed user guide. The example datasets can be processed using the default parameters, and the expected output is provided in the form of Excel reports and graphical visualisations. The user guide also provides instructions on how to set user parameters such as stimulation start time, stimulation period, number of stimuli, fluorescent signal type (voltage or calcium), pulse detection threshold percentage, pulse action potential durations, pulse start on stimulus detection delta duration, pulse start point type (upstroke start, upstroke end or activation point) and quality control SNR threshold.
•
Sample input: Users can load several example CSV files provided in the software package, each containing time series data for a small set of cardiomyocytes. An example input file contains columns for timestamp and fluorescent intensity for multiple cells (e.g., ‘Time (s), Cell_1_Intensity, Cell_2_Intensity, …’).
•
Running the analysis: The user executes the main KICA script, specifying the input file(s) and desired parameters. The script processes the sample data through the full workflow (data import, signal processing, pulse detection and analysis, quality control, and reporting).
•
Sample output: The expected output includes an Excel report summarising the pulse characteristics (e.g., peak amplitude, action potential duration, SNR) for each cell. The report structure includes sheets for raw data, processed data, and summary statistics. An example output row for a cell might include columns like ‘Cell ID’, ‘Average APD90’, ‘Peak Amplitude’, ‘SNR’, ‘Number of detected beats’, ‘Quality Control Status’. Visualisations of the analysed signals for each cell are also generated as figures saved alongside the report, showing the raw signal, processed signal, detected beats, and calculated fiducial points (e.g., upstroke, repolarisation points). Users can compare this output with the provided example output to verify the software is working as intended and interpret the key metrics.
By providing these sample inputs and outputs, KICA ensures that users can quickly validate the software’s functionality upon installation and understand how to interpret the results. Detailed instructions for running these tests and explaining parameters are included in the software’s user guide, along with URL and contact details to report issues.
Discussion
While KICA was developed for use with fluorescent time-series data related to calcium cycling and membrane voltage, its flexible design makes it applicable to analysis of other periodic physiological datasets such as contraction data, or direct electrophysiological recordings of action potentials. Researchers working in fields such as immunology, neuroscience, and pharmacology can adapt KICA to their needs by modifying its parameters and incorporating additional signal processing steps. The object-oriented architecture facilitates these extensions.
KICA’s ability to handle large datasets and perform quality control checks makes it particularly useful for researchers conducting high-throughput screenings, where manual data analysis is impractical.
Ethics and consent
Ethical approval and consent were not required.
Data availability
Source data
No source data published previously.
Extended data
No extended data is associated with this article.
Acknowledgements
We acknowledge the Victor Chang Cardiac Research Institute Innovation Centre, funded by the NSW Government and thank Drs Matthew Perry and William Lee for their input on design of KICA.
References
- 1.
Eisner DA, Choi HS, Diaz ME, et al.:
Integrative analysis of calcium cycling in cardiac muscle.
Circ. Res.
2000; 87(12): 1087–1094. Publisher Full Text
- 2.
Donald M:
Bers. Cardiac excitation-contraction coupling.
Nature.
2002; 415: 198–205. Publisher Full Text
- 3.
Bers DM:
Calcium and excitation-contraction coupling in the heart.
Circ. Res.
2017; 121(2): 181–195. PubMed Abstract
| Publisher Full Text
| Free Full Text
- 4.
Herron TJ, Lee P, Jalife J:
Optical imaging of voltage and calcium in cardiac cells & tissues.
Circ. Res.
2012; 110(4): 609–623. PubMed Abstract
| Publisher Full Text
| Free Full Text
- 5.
George SA, Lin Z, Efimov IR:
Simultaneous triple-parametric optical mapping of transmembrane potential, intracellular calcium and nadh for cardiac physiology assessment.
Commun. Biol.
2022; 5: 319. PubMed Abstract
| Publisher Full Text
| Free Full Text
- 6.
Tallini YN, Ohkura M, Choi B-R, et al.:
Imaging cellular signals in the heart in vivo: Cardiac expression of the high-signal ca2+ indicator GCaMP2.
Proc. Natl. Acad. Sci.
2006; 103(12): 4753–4758. PubMed Abstract
| Publisher Full Text
| Free Full Text
- 7.
Müller A, Joseph JS, Jaffe DB, et al.:
Genetically encoded ca2+ indicators in cardiac myocytes.
Prog. Biophys. Mol. Biol.
2014; 115(3): 32–41. PubMed Abstract
| Publisher Full Text
| Free Full Text
- 8.
Dempsey GT, Chaudhary KW, Atwater N, et al.:
Cardiotoxicity screening with simultaneous optogenetic pacing, voltage imaging and calcium imaging.
J. Pharmacol. Toxicol. Methods.
2016; 81: 240–250. PubMed Abstract
| Publisher Full Text
- 9.
Shroff SN, Das SL, Tseng H-A, et al.:
Voltage imaging of cardiac cells and tissue using the genetically encoded voltage sensor archon1.
iScience.
Apr 2020; 23(4): 100974. PubMed Abstract
| Publisher Full Text
| Free Full Text
- 10.
Cerignoli F, Charlot D, Whittaker R, et al.:
High throughput measurement of ca2+ dynamics for drug risk assessment in human stem cell- derived cardiomyocytes by kinetic image cytometry.
J. Pharmacol. Toxicol. Methods.
2012; 66(3): 246–256. PubMed Abstract
| Publisher Full Text
| Free Full Text
- 11.
Hua Rong L, Whittaker R, Price JH, et al.:
High throughput measurement of ca++ dynamics in human stem cell-derived cardiomyocytes by kinetic image cytometry: A cardiac risk assessment characterization using a large panel of cardioactive and inactive compounds.
Toxicol. Sci.
2015; 148(2): 503–516. Publisher Full Text
- 12.
MathWorks:
Matlab signal processing toolbox.2021.
Reference Source
- 13.
Vala Sciences:
Kinetic image cytometry: High-content screening for cellular fluorescence analysis in drug discovery.
Vala Sciences White Paper.
2023.
Reference Source
- 14.
Perry MD, Ng CA, Mangala MM, et al.:
Pharmacological activation of ikr in models of long qt type 2 risks overcorrection of repolarization.
Cardiovasc. Res.
2020; 116(8): 1434–1445. PubMed Abstract
| Publisher Full Text
- 15.
Heitmann S, Shpak A, Vandenberg JI, et al.:
Arrhythmogenic effects of ultra-long and bistable cardiac action potentials.
PLoS Comput. Biol.
2021; 17(2): e1008683. PubMed Abstract
| Publisher Full Text
| Free Full Text
- 16.
Lim S, Mangala M, Holliday M, et al.:
Reduced connexin-43 expression, slow conduction and repolarisation dispersion in a model of hypertrophic cardiomyopathy.
Dis. Model. Mech.
2024; 17: dmm050407.
- 17.
Selvakumar D, Clayton ZE, Prowse A, et al.:
Cellular heterogeneity of pluripotent stem cell-derived cardiomyocyte grafts is mechanistically linked to treatable arrhythmias.
Nat. Cardiovasc. Res.
2024; 3: 145–165.
- 18.
TeBay C, McArthur JR, Mangala M, et al.:
Pathophysio- logical metabolic changes associated with disease modify the proarrhythmic risk profile of drugs with potential to prolong repolarisation.
Br. J. Pharmacol.
2021; 179(13): 4010–4030. Publisher Full Text
- 19.
McQuin C, et al.:
Cellprofiler 3.0: Next-generation image processing for biology.
PLoS Biol.
2018; 16(7): e2005970. PubMed Abstract
| Publisher Full Text
| Free Full Text
- 20.
Schindelin J, Arganda-Carreras I, Frise E, et al.:
Fiji: an open-source platform for biological-image analysis.
Nat. Methods.
2012; 9(7): 676–682. PubMed Abstract
| Publisher Full Text
| Free Full Text
- 21.
Sidhom JW, Theodros D, Murter B, et al.:
Ex- cyt: A graphical user interface for streamlining analysis of high-dimensional cytometry data.
J. Vis. Exp.
Jan 2019; 143: e57473. Publisher Full Text
- 22.
Potts C, Schearer J, Sebrell TA, et al.:
Mnpmapp: An image analysis tool to quantify mononuclear phagocyte distribution in mucosal tissues.
Cytometry A.
Dec 2022; 101(12): 1012–1026. PubMed Abstract
| Publisher Full Text
| Free Full Text
- 23.
Ma Y, Eizenberg-Magar I, Antebi Y:
Easyflow: An open-source, user-friendly cytometry analyzer with graphic user interface (gui).
PLOS ONE.
2024; 19(11): e0308873. PubMed Abstract
| Publisher Full Text
| Free Full Text
- 24.
Satya N, Arjunan V, Hill AP:
Kinetic Imaging Cytometry Analyser (KICA) Example Data. [Data set].
Zenodo.
Publisher Full Text
- 25.
Satya N, Arjunan V, Parker GW, et al.:
KICA: Kinetic Imaging Cytometry Analyser.
Zenodo.
Publisher Full Text
Comments on this article Comments (0)