Keywords
possibility theory, probabilistic approach, expert knowledge, interval estimates, system monitoring, Dunning-Kruger effect
Interval estimates are a common way to express uncertain knowledge of experts. To model them and aggregate multiple judgments, both the probability and possibility theories are applicable. Previous studies have shown that the performances of the aggregated distributions obtained by these two approaches are similar on average; however, there is a lack of works investigating how we can establish a preference between them in certain cases.
The distribution of expert-based interval estimates on the latent Dunning-Kruger curve, i.e., the correlation between their accuracy (estimation error) and confidence/precision (interval width) was determined. The judgments were modelled using both probabilistic and possibilistic approaches, and the estimation errors of the obtained aggregated distributions were compared, described by an advantage score. Its dependence on the confidence-accuracy interdependence of expert judgments was investigated involving estimates for multiple variables.
Interval estimates of ten experts regarding nine properties of a manual waste sorting system were analyzed including feed composition, product purity and yield. The results show that there is a strong correlation between the confidence-accuracy interdependence of expert judgments and the advantage score. When narrower interval estimates imply greater accuracy, the probabilistic approach is preferable. However, in the reverse case, the possibilistic method yields better results.
Our basic intuition is that narrower interval estimates are more accurate than wider ones. In this case, the probabilistic approach for modeling expert knowledge is appropriate. However, as the Dunning-Kruger effect highlights, sometimes its reverse is true; then, the possibilistic approach tends to be more suitable as it does not amplify the effect of narrow estimates. The results show that the choice between the two concepts can be based on the correlation trend between the accuracy and precision of judgments that could be deduced, e.g., from the composition of the expert group.
possibility theory, probabilistic approach, expert knowledge, interval estimates, system monitoring, Dunning-Kruger effect
Are narrower interval estimates more accurate? Most people would confidently say YES based on their basic intuitions.1 However, the incorrectness of this claim has already been proven experimentally.2 Besides, the Dunning-Kruger effect also draws attention to the fact that greater confidence does not necessarily result from greater expertise.3 Moreover, the uncertainty of estimates can also be affected by other factors such as the pressure of giving informative judgments even in case of ignorance.4
To model and aggregate expert-based interval estimates, both probability and possibility theories are applicable. Considering interval estimates as a kind of (uncertain) measurement, their precision and accuracy can be characterized by the interval width and the estimation error, respectively.5 Probabilistic aggregation monotonically reduces the variance of low-precision estimates by the number of available judgments. On the other hand, it may keep the bias of high-precision estimates if they have low accuracy. In this case, possibilistic modeling and aggregation can be more beneficial as it ensures that the aggregated distribution would cover the true value, e.g., by using the union operator. However, when there are both low- and high-precision estimates, the decision between the probabilistic and possibilistic approaches is not so straightforward.
In case of estimates with varying precision, its relationship with accuracy may not be negligible when choosing the modeling technique. If higher precision does not mean greater expertise, the simplest and most commonly used probabilistic modeling technique (which favors narrower estimates) does not seem to be an acceptable solution. Possibility theory appears to be preferable, which not only assigns equal importance to judgments with different interval widths, but also makes it possible to investigate the consensus of estimates by simply analyzing the overlap of the resulted possibility distributions.6
Some previous works have compared the probabilistic and possibilistic approaches in different fields. When creating a measurement model, the preference strongly depends on the available a priori knowledge.7 Besides, a structural engineering example showed that problem complexity also matters in case of uncertainty propagation.8 As for expert knowledge modeling, the most significant work in recent years was conducted by Rohmer and Chojnacki.9 They performed extensive analysis involving many datasets to compare probabilistic and possibilistic approaches regarding how well they represent the aggregated opinions of multiple experts, using accuracy- and informativeness-based measures. They were unable to show significant differences between the performances; however, they investigated the average scores of multiple different estimation tasks, and did not consider the potentially different relationship between precision and accuracy in certain cases.
In this study, we are taking a deeper look into the modeling of expert-based interval estimates by investigating their distribution on the Dunning-Kruger curve. It illustrates the ambiguous relationship between confidence and expertise,3 which are equivalent to precision and accuracy in the case of interval estimates, respectively. Starting from the key differences caused by the different mathematical logic, we examine how the distribution of judgments on the Dunning-Kruger curve, i.e., the correlation trend of precision and accuracy affects the relative performance of probabilistic and possibilistic approaches, thus facilitating the decision between them.
Expert-based interval estimates are ambiguous. If we have an estimate about variable from expert , the width of the interval generally represents the uncertainty of the knowledge about . However, we usually do not have any information about the prioritization of values inside the interval: the expert may have thought that every value in the interval is equally probable, but (s)he might not have meant to give such additional information by his/her estimate. Therefore, the commonly used probabilistic modeling technique that assumes certain probability values over the interval does not always represent correctly the real information content of the estimations.
The given interval can be represented probabilistically by a uniform distribution as:
Otherwise, interval estimates can be modeled by fuzzy numbers in the possibilistic case, showing the degree of being member of the set, defined by the tuple:
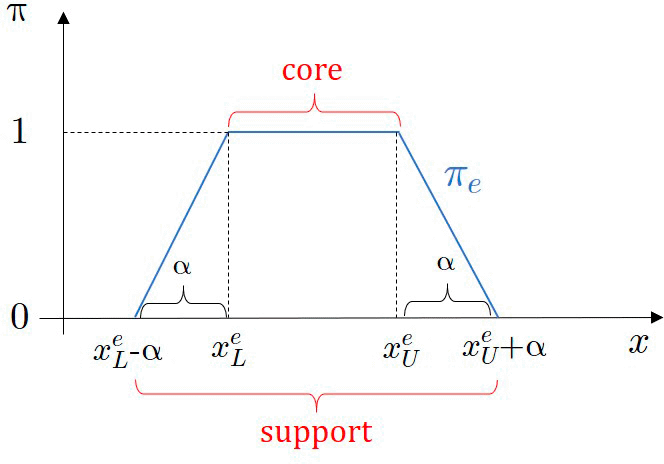
marks the user-defined bandwidth.
Notice that in this case, without restriction on the integral, the given interval defines the core of the fuzzy number, so the values inside take one in all the cases regardless the interval width.
The anomaly mentioned above, namely, that the probabilistic approach prioritizes narrow interval estimates but the possibilistic approach assigns all equal importance, increasingly prevails when the judgments of multiple experts are aggregated.
The aim of the aggregation is to summarize the judgments of multiple experts in one probability/possibility distribution. In case of the probabilistic approach, averaging the distribution functions representing individual opinions is a conventional aggregation technique:
In this work, we use the average operator in case of the possibilistic approach as well, which avoids giving zero possibility everywhere along the domain in case of conflicting estimates (e.g., min operator), and also covering uninformatively large area by possibility value one if the estimates are well distributed, without showing preferences (e.g., max operator):
In the case of averaging possibility distributions, all expert judgments are considered with equal importance, as values within an interval estimate of each expert are considered with a possibility equal to one during the aggregation. Consequently, the mean curve (disregarding bandwidth) roughly represents the voting ratio for certain values as shown on the right in Figure 2. On the other hand, the values falling within narrow intervals are overemphasized in the probabilistic case, as they take higher probability than the values belonging to wide-interval responses as can be seen on the left in Figure 2.
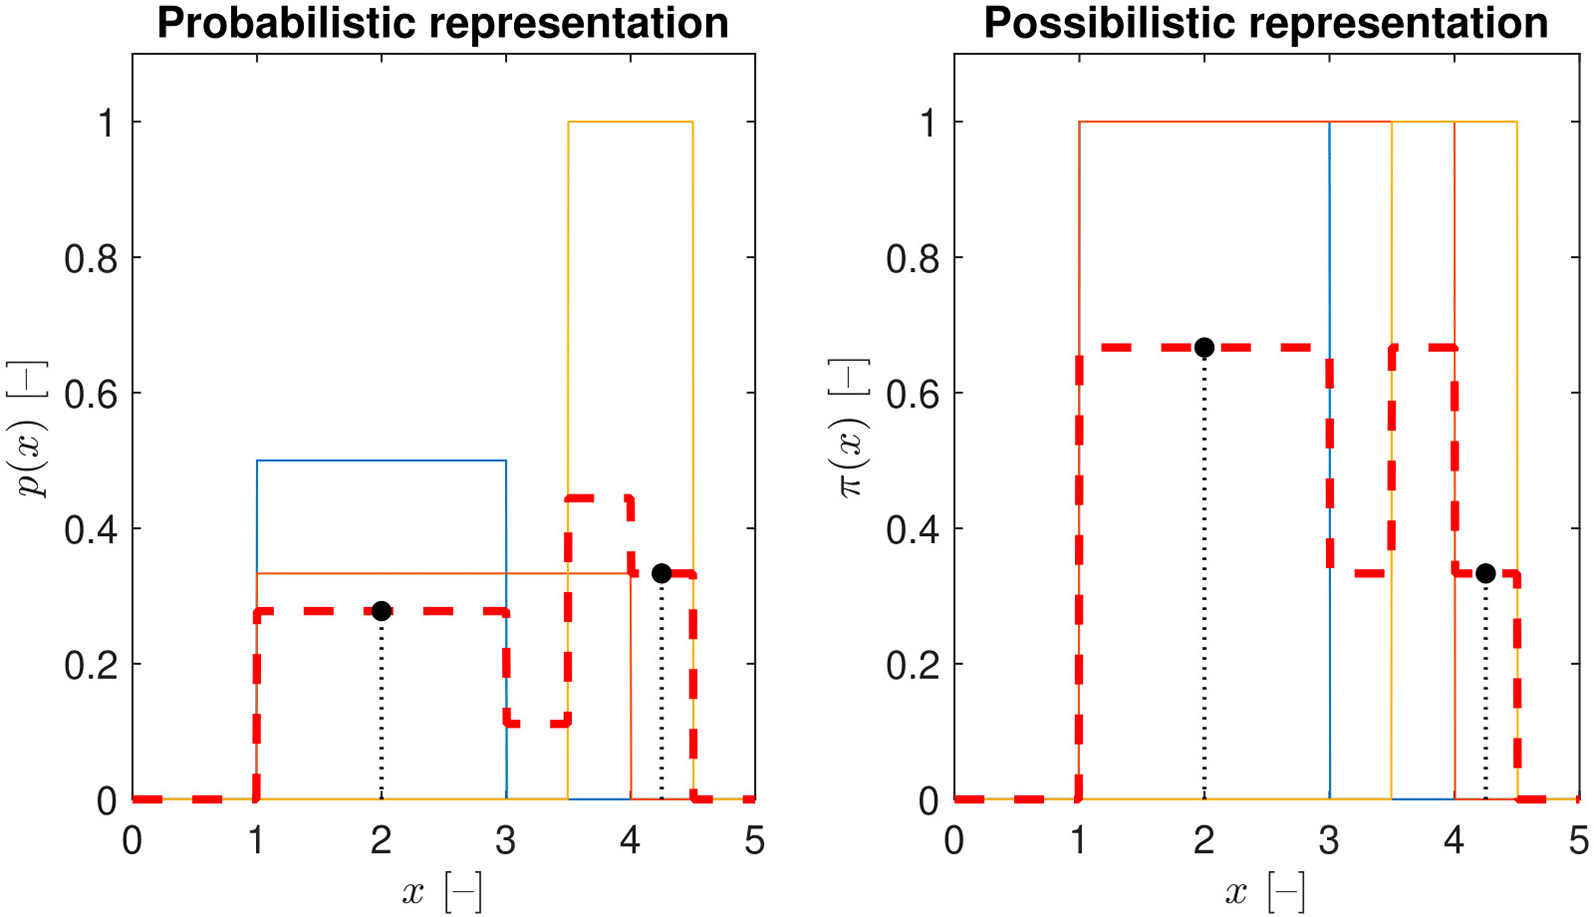
Three interval estimates are considered here: , and . They are represented by uniform probability distributions on the left, and trapezoidal fuzzy number with zero bandwidth ( ) on the right. The aggregated distributions are illustrated by red dashed lines, and the function values belonging to and by black points.
Three expert judgments with different interval widths were modeled and aggregated in Figure 2. It can be noticed that takes higher a probability but a lower possibility value than . This is a key consequence of the narrow-interval prioritization effect of the probabilistic approach.
Additionally, it has to be mentioned that the aggregated curve in the probabilistic case is still a probability distribution (with integral equal to one). Meanwhile, the averaging in the possibilistic case results in a subnormal possibility distribution (with a maximum below one). If needed, it should be normalized for further calculations.10
An advantage score is defined to express the performance difference between the aggregated probability and possibility distributions. In order to determine the extent to which the probabilistic approach outperforms the possibilistic, the accuracies of the gained aggregated distributions are compared. Their means are calculated (in the possibilistic case, it corresponds to the centroid defuzzification method) and their distance from the correct value ( ) is evaluated:
The difference of errors defines the advantage score ( ) as:
The normalization factor aims to bring the error differences to a common ground, if the variables are scaled differently; it can be, e.g., equal to the domain width of . In this work, this normalization operation was eliminated ( ), as all variables were scaled equally in our case study. The metric is positive if the probabilistic approach performs better than the possibilistic, and negative if the possibilistic approach shows more appropriate results.
Calculating correlation has two roles in this work. Firstly, it is used to characterize the relation between the interval length and accuracy of estimates about a variable, marked by . Afterwards, having estimates about multiple variables, the correlation of this correlation and the advantage score belonging to each is calculated, denoted by . The Pearson’s correlation coefficient is used for both cases.
The interval lengths and estimation errors of estimates about from multiple experts are collected in and vectors, respectively:
The confidence-accuracy interdependence belonging to an variable can be defined as the correlation between interval lengths ( ) and estimation errors ( ) of the estimates from multiple experts:
If shows a strong positive correlation, that means narrower interval estimates belong to higher expertise level. However, if there is a significant negative correlation, then the interval width increases with the level of expertise, which aligns with the Dunning-Kruger effect.
Having estimates about multiple variables ( ), we can calculate the confidence-accuracy correlation and advantage score for each, collected them as:
Their relationship can also be described by a correlation coefficient ( ) numerically:
In this work, we wanted to explore whether the distribution of answers on the Dunning-Kruger curve (characterized by ) has any effect on the performance difference between the probabilistic and possibilistic approaches ( ). This potential effect is quantified by .
Interval estimates are available about nine key variables of a manual waste sorting system, including product purity, yields and feed composition, each with a percentage dimension. Thereby, their values are limited to between 0% and 100%. The data collection was performed in a classroom setting in which 10 students (representing experts) were involved. Ethical approval for this study was obtained from the Institutional Research Ethics Committee of the University of Pannonia (approval number: KEB 2/2024. (12.03.)).
The available interval estimates about the nine variables ( ) given by the ten experts ( ) are summarized in Figure 3.
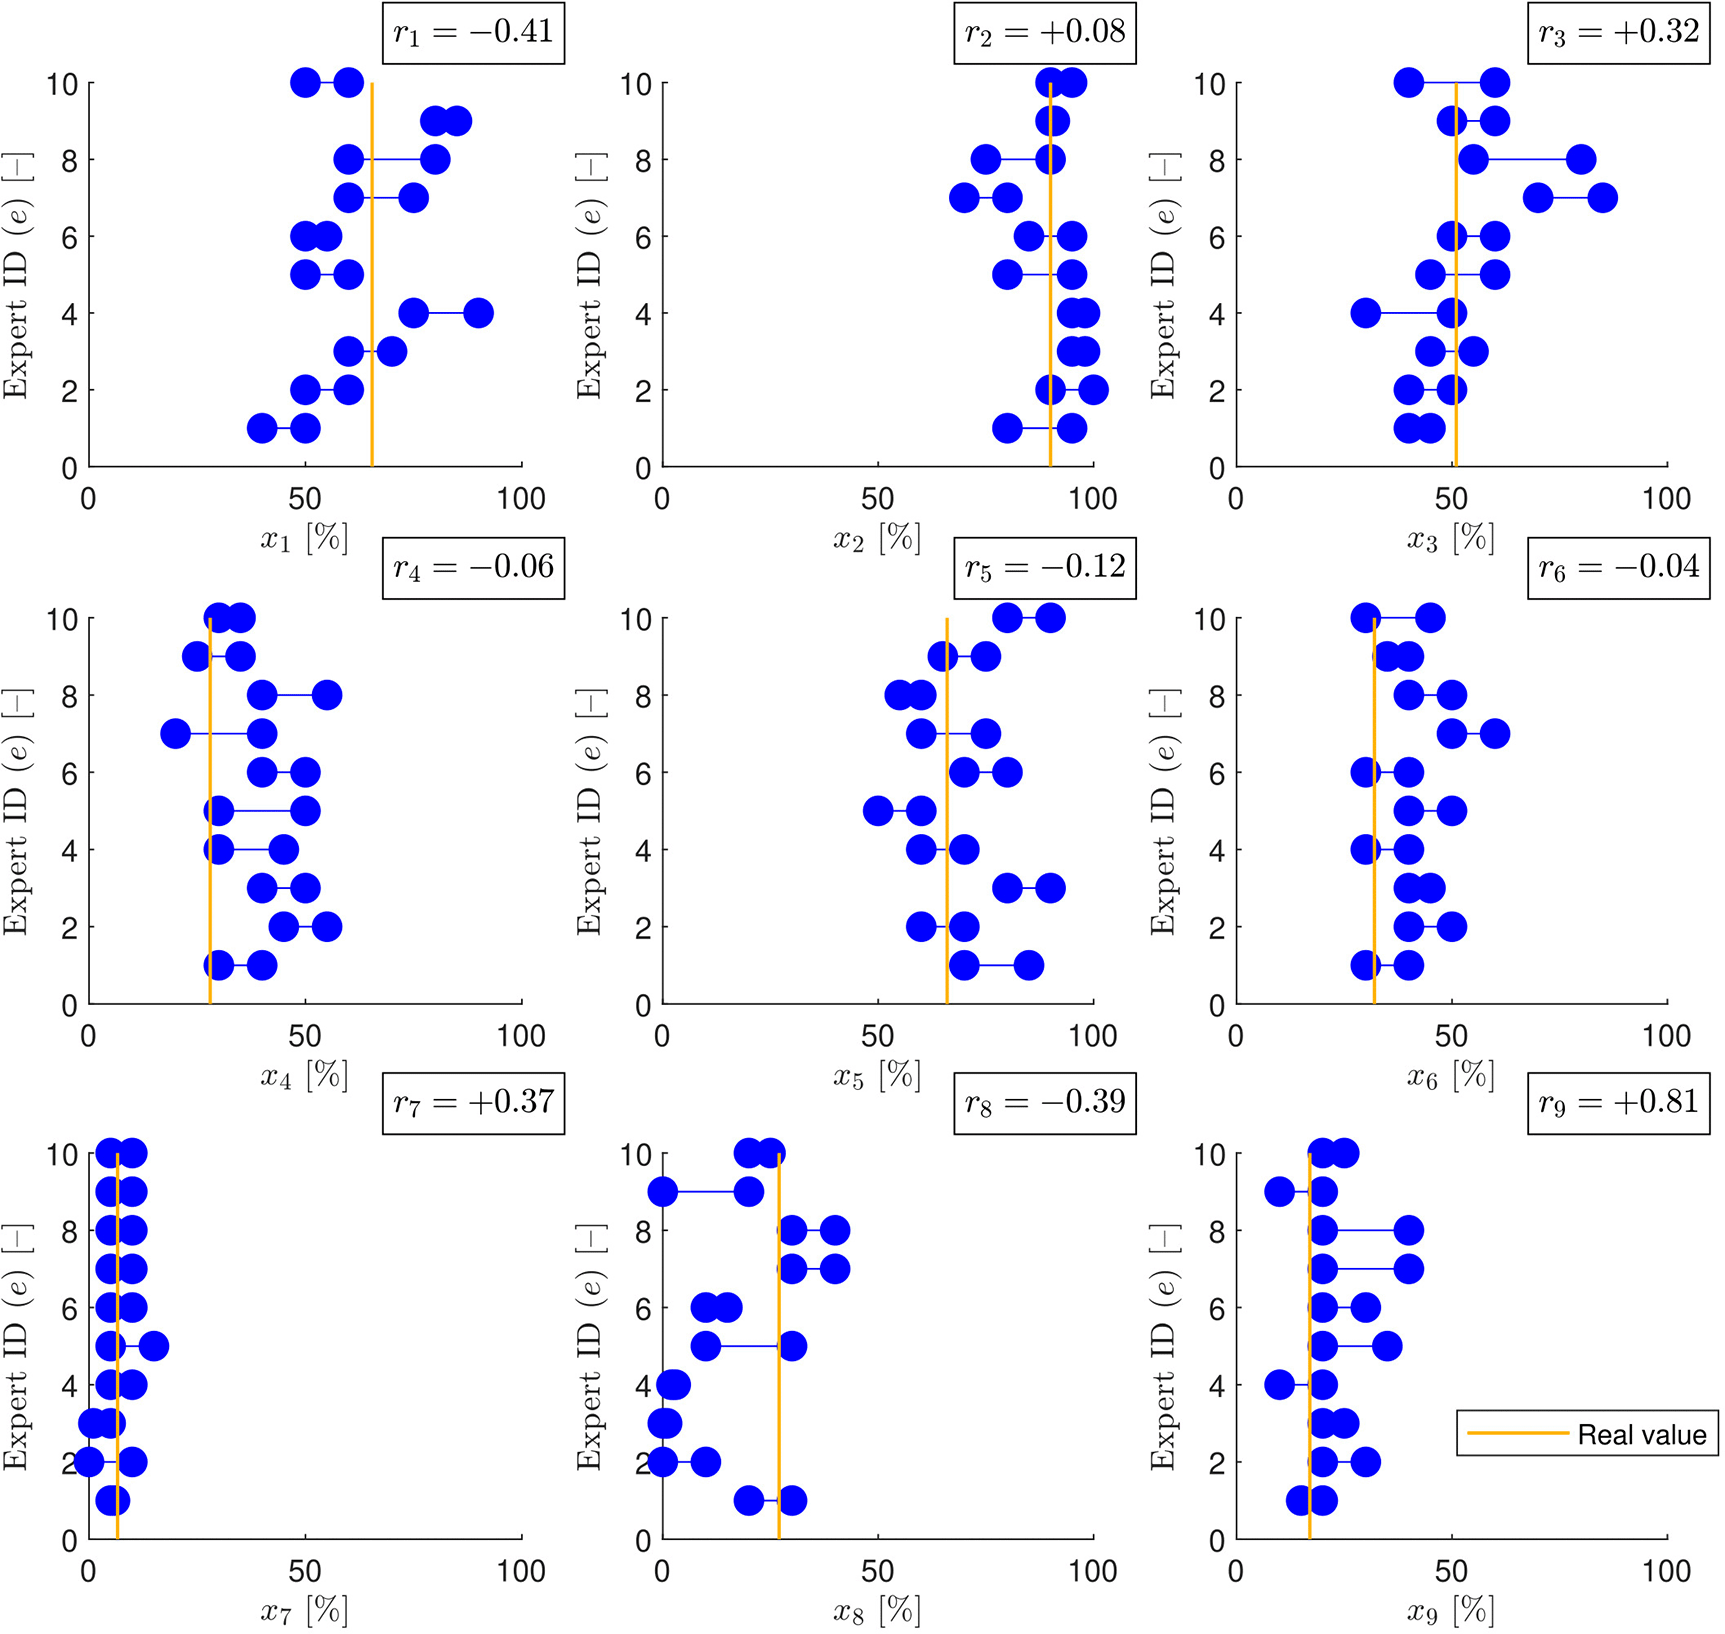
The correct value is illustrated by yellow vertical lines. The correlation coefficients between interval width and estimation error ( ) are also depicted.
It can be seen that the correlation is positive in only about half of the cases, thus the falsity of the claim that narrower estimates necessarily imply higher level of expertise is verified. A strong correlation was found only in one case ( ) and a moderate correlation four times (two negative ( , ) and two positive ( , )). Estimates of four variables did not show a significant relationship between interval width and accuracy.
The aggregated probability and possibility distributions ( ) with their means and the related advantage scores can be seen in Figure 4. There are some cases where the probabilistic approach outperforms the possibilistic ( , and ) and there are examples where the reverse is true ( and ).
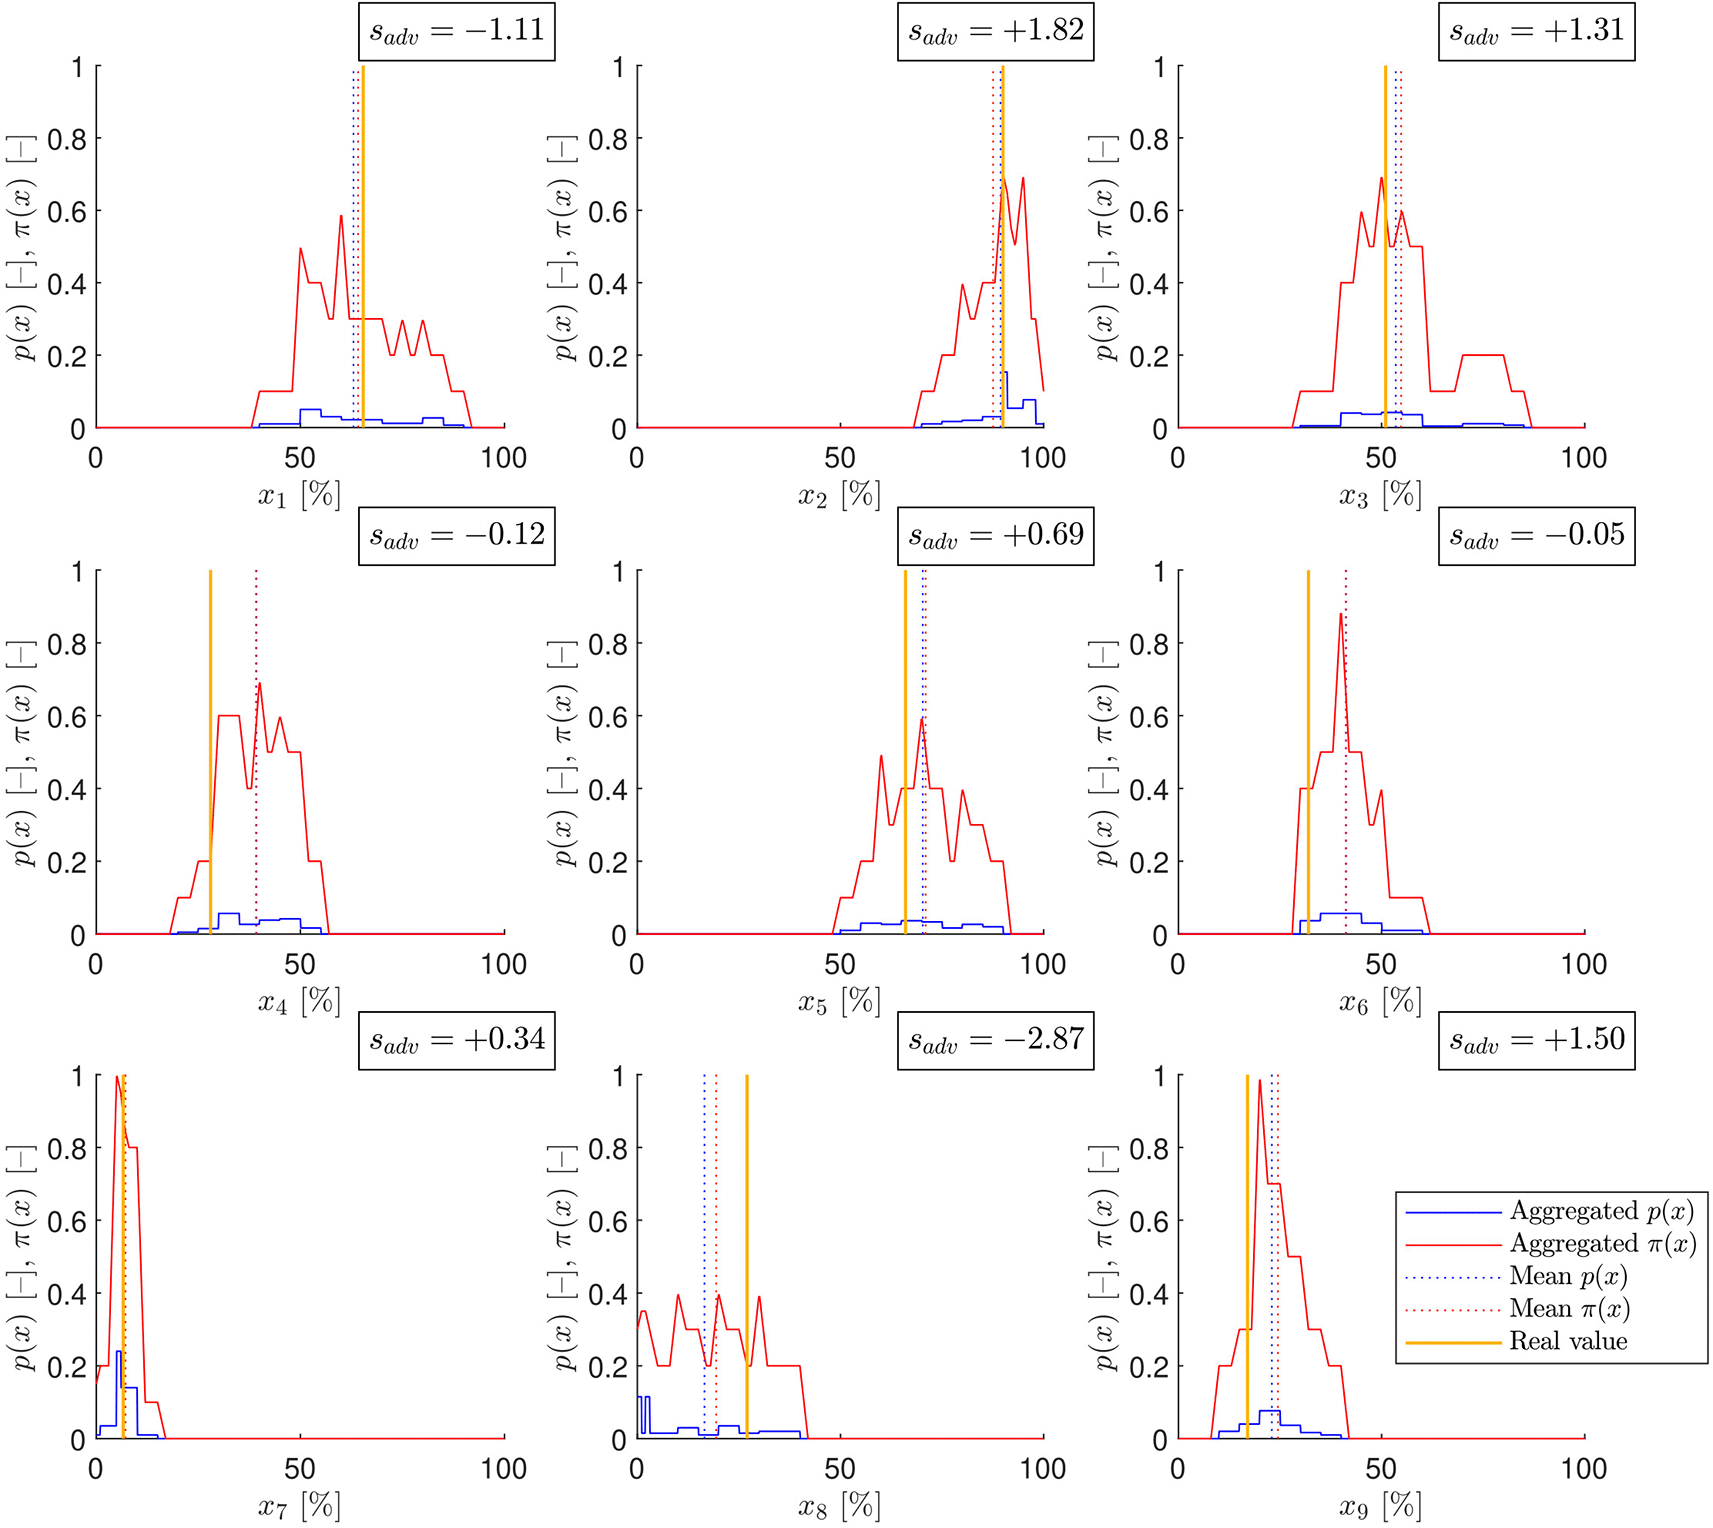
The aggregated probability (blue) and possibility (red) distributions are shown. Their means are plotted by dotted lines in the corresponding color, and the correct values are illustrated by yellow vertical lines. The advantage scores ( ) are also depicted.
Finally, the relationship between and values was investigated, as illustrated in Figure 5. A strong linear correlation ( ) was detected between these two factors, which is an encouraging result in terms of making a decision between probabilistic and possibilistic approaches based on the tendency characterized by . Although absolute errors ( ) are not available in practical cases to calculate as the correct value is not known, we can have a guess about the correlation trend, e.g, knowing the interval widths and the relative competences of experts.
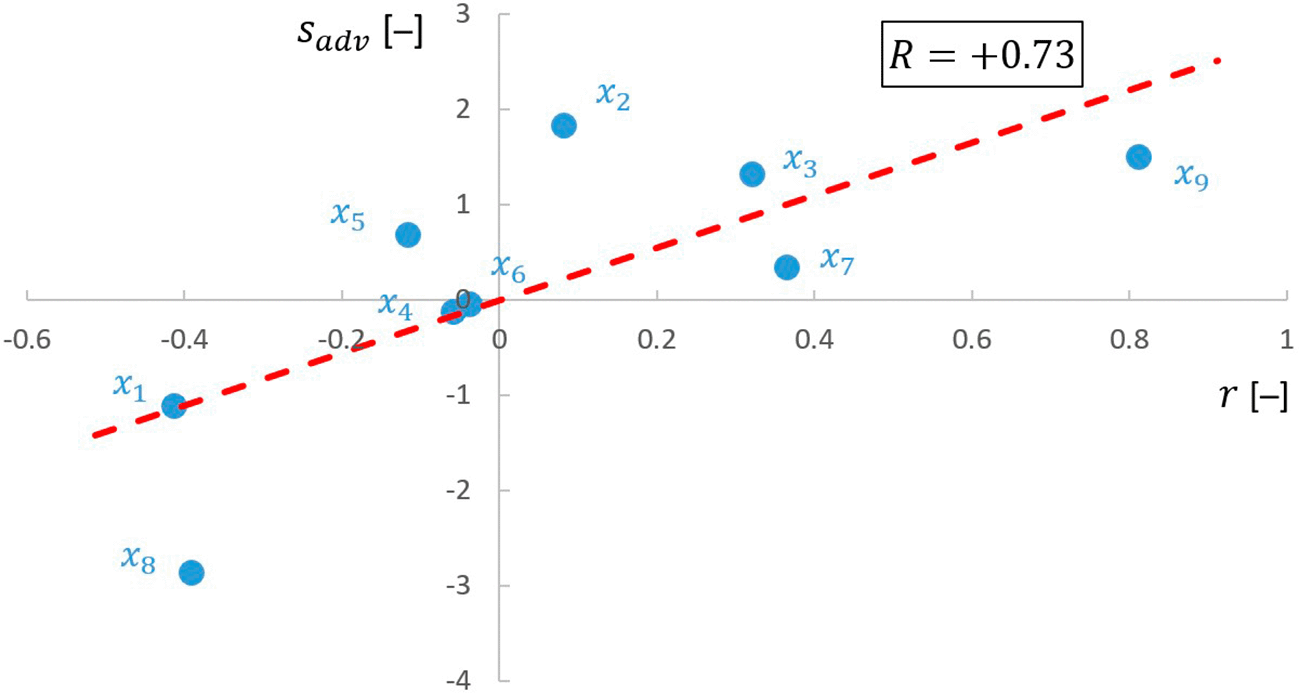
The data points are labeled based on the variables ( ) they belong to, and the line fitted to them are depicted by red dashed line. The correlation coefficient of and is .
Our results demonstrate that the performance difference between probabilistic and possibilistic modeling approaches strongly depends on the nature of the relationship between confidence (precision) and accuracy. If the distribution of answers on the Dunning-Kruger curve is known, the preferable approach can be defined derivatively as illustrated in Figure 6, where the red and blue points represent two different sets of estimates (e.g., about different variables).
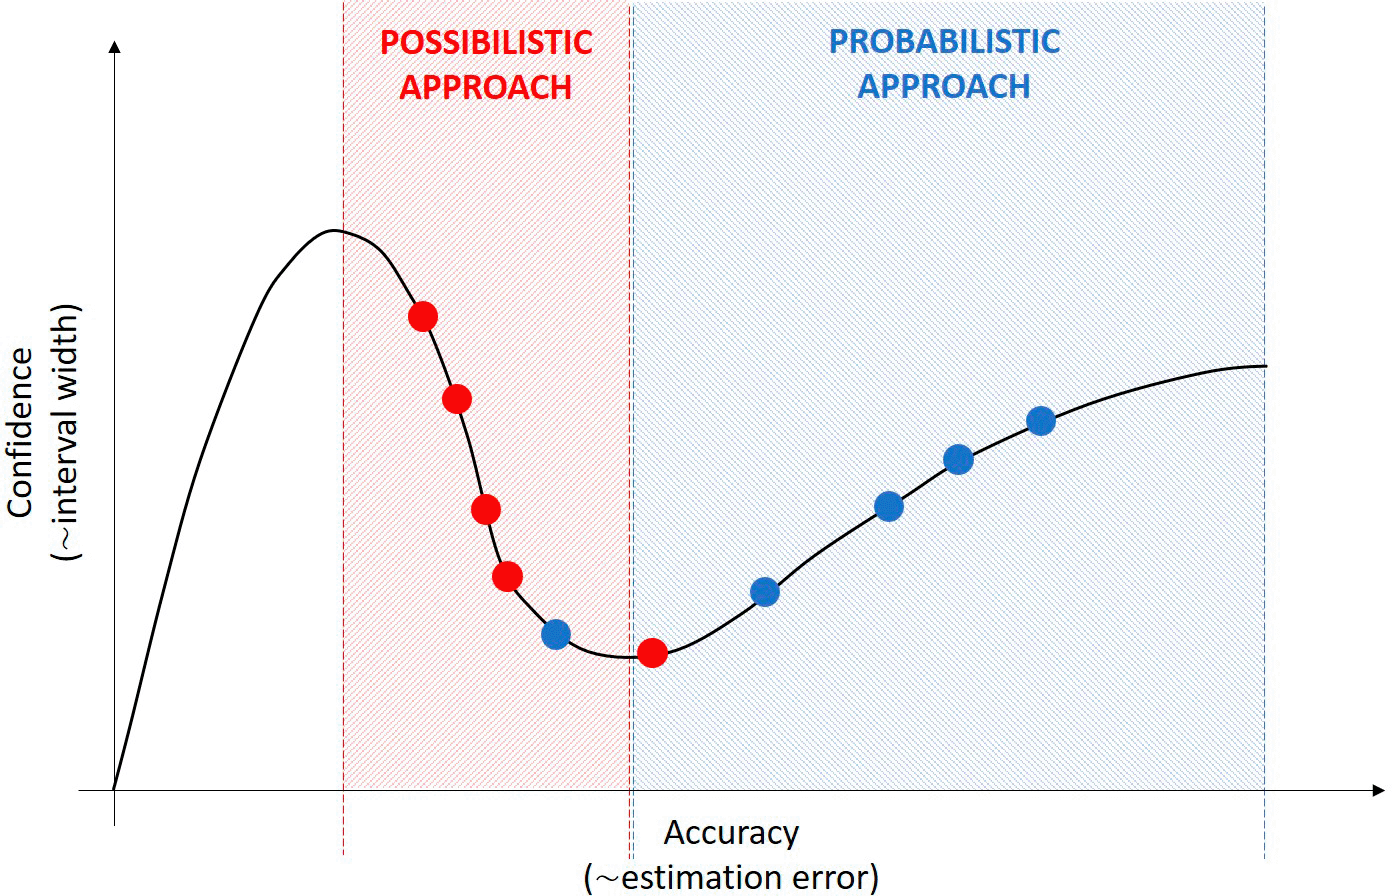
If the judgments show a negative correlation between accuracy and confidence, the possibilistic approach is preferable (red). However, if higher accuracy relates to narrower estimates, the probabilistic approach is recommended (blue).
Unfortunately, the type of confidence-accuracy correlation related to a certain task and a certain group of experts cannot be determined or predicted directly. It depends on several factors such as the nature of the task, the pressure of time and demand for informativeness, or the composition of the expert group. For now, it has not yet been clearly described as a function of measurable factors, which defines a research gap in the psychological field, and also provides a future research direction that has great practical relevance.
Although the dependence of the distribution of answers on the Dunning-Kruger curve, i.e., confidence-accuracy space, has not yet been explored completely, once this is done, users will be able to choose with great certainty between probabilistic and possibilistic approaches for modeling expert-based interval estimates. Until then, users are able to apply indirect solutions to deduce the nature of precision-accuracy trend, e.g., involving some a priori knowledge about the relative competence of experts in the group and comparing it with the precision of their estimates.
Ethical approval for this study was obtained from the Institutional Research Ethics Committee of the University of Pannonia (Approval number: KEB 2/2024. (12.03.)). Written and signed informed consent was obtained from all participants.
Archived source code at time of publication: https://doi.org/ 10.5281/zenodo.16680269.11
License: CC BY 4.0
Zenodo: Interval estimates. https://doi.org/10.5281/zenodo.16680269.11
This project contains the following underlying data:
• expert_estimates_and_figure.xlsx (raw data and Figure 5)
Data are available under the terms of the Creative Commons Attribution 4.0 International (CC BY 4.0) license.
| Views | Downloads | |
|---|---|---|
| F1000Research | - | - |
|
PubMed Central
Data from PMC are received and updated monthly.
|
- | - |
Is the work clearly and accurately presented and does it cite the current literature?
Partly
Is the study design appropriate and is the work technically sound?
Yes
Are sufficient details of methods and analysis provided to allow replication by others?
Yes
If applicable, is the statistical analysis and its interpretation appropriate?
Yes
Are all the source data underlying the results available to ensure full reproducibility?
Yes
Are the conclusions drawn adequately supported by the results?
Yes
Competing Interests: No competing interests were disclosed.
Reviewer Expertise: uncertainty analysis, statistical method, machine learning
Alongside their report, reviewers assign a status to the article:
| Invited Reviewers | |
|---|---|
| 1 | |
|
Version 1 26 Aug 25 |
read |
Provide sufficient details of any financial or non-financial competing interests to enable users to assess whether your comments might lead a reasonable person to question your impartiality. Consider the following examples, but note that this is not an exhaustive list:
Sign up for content alerts and receive a weekly or monthly email with all newly published articles
Already registered? Sign in
The email address should be the one you originally registered with F1000.
You registered with F1000 via Google, so we cannot reset your password.
To sign in, please click here.
If you still need help with your Google account password, please click here.
You registered with F1000 via Facebook, so we cannot reset your password.
To sign in, please click here.
If you still need help with your Facebook account password, please click here.
If your email address is registered with us, we will email you instructions to reset your password.
If you think you should have received this email but it has not arrived, please check your spam filters and/or contact for further assistance.
Comments on this article Comments (0)