Keywords
cardiac purkunje
This article is included in the Bioinformatics gateway.
This article is included in the University College London collection.
cardiac purkunje
The heart’s electrical system relies on precise timing and coordination. Central to this system is the Purkinje network—a branching system of specialized fibers that rapidly conduct impulses through the ventricles. Myocardial ischemia, which restricts blood supply, can impair this network, disrupting normal impulse propagation and leading to arrhythmias such as ventricular tachycardia or fibrillation.1,5
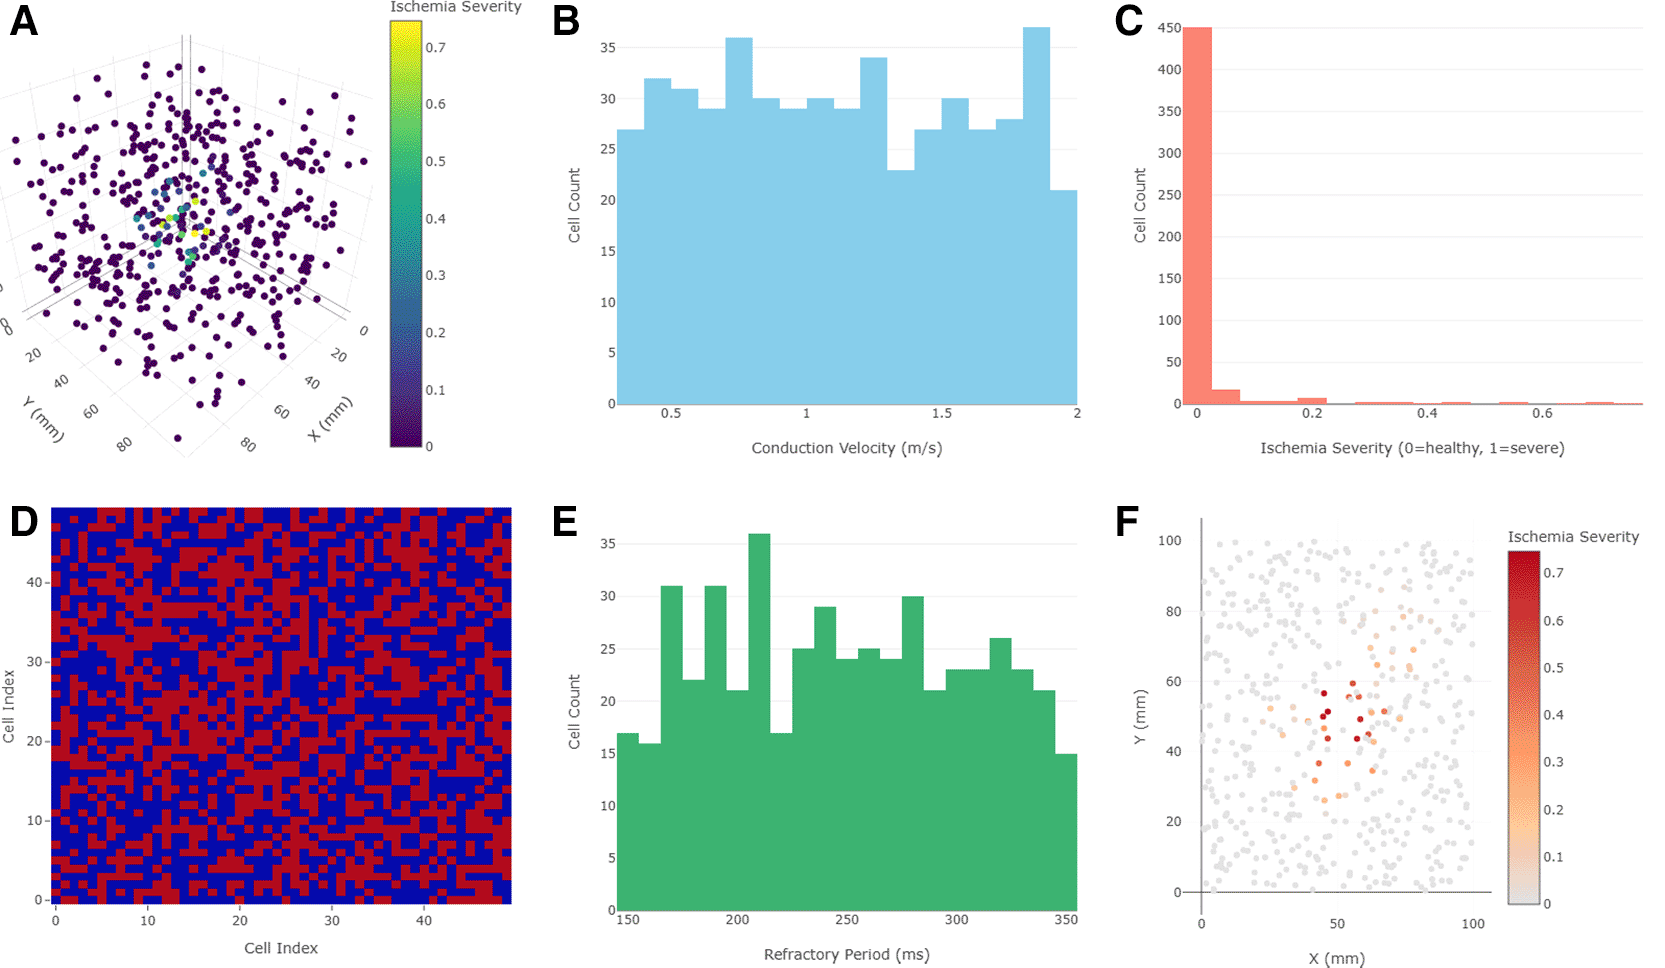
Cell positions reflect spatial dispersion approximating Purkinje fiber branching within the ventricular myocardium. Figure 1B: Histogram illustrating the distribution of conduction velocities assigned to the Purkinje cells. The variability in conduction speed reflects physiological heterogeneity, with values ranging from 0.3 to 2.0 m/s. Figure 1C: Visualization of ischemia severity gradients applied across two ischemic zones in the Purkinje network. One region demonstrates a linear severity decline, while the other applies an exponential decay gradient, simulating different ischemic injury patterns. Figure 1D: Heatmap representation of the network adjacency matrix showing binary connections between Purkinje cells. The randomized connectivity results in heterogeneous local coupling densities while maintaining overall network integrity. Figure 1E: Histogram depicting the distribution of refractory periods assigned to individual Purkinje cells, ranging between 150 and 350 milliseconds, consistent with experimentally observed values. Figure 1F: Two-dimensional XY projection of the 3D network, providing an alternative view of spatial clustering, network density, and ischemic region overlap for enhanced visual interpretation.
Computational modeling offers a powerful, non-invasive approach to investigate these mechanisms. While existing Purkinje fiber models have provided important insights,1–3 many lack integration of spatial anatomy, cellular heterogeneity, and detailed ischemic effects. To address these gaps, we developed a comprehensive computational framework simulating and visualizing ischemia-induced electrophysiological disturbances in a 3D Purkinje network.
We implemented the AdvancedPurkinjeNetwork class in Python to simulate a network of n_cells Purkinje cells. Each cell includes spatial coordinates (x, y, z), assigned randomly within a bounded 3D volume to simulate biological dispersion. Cells are categorized as bundle_branch, fascicle, or purkinje to reflect histological diversity. A boolean pacemaker flag allows some cells to exhibit spontaneous firing. Key electrophysiological parameters include conduction velocity, refractory period, and ATP level. To simulate pathology, each cell carries an is_ischemic flag and a continuous ischemia_severity score (0.0–1.0). Network connectivity is represented by a binary adjacency matrix, which, while currently randomized, is designed for future integration of anatomical branching data.4
We developed an algorithm to define ischemic regions by specifying a center, radius, and severity. The Euclidean distance from each cell to the ischemic core determines individual severity, applied via linear or exponential gradients. Linear gradients model gradual decline, while exponential gradients simulate more abrupt severity transitions, consistent with ischemic tissue decay.5–7
The ComprehensivePurkinjeSimulator class generates detailed visualizations to illustrate how ischemia impacts the Purkinje network. It includes 3D spatial plots of the cell layout, conduction velocity histograms, ischemia severity maps, and heatmaps of network connectivity. Additionally, it visualizes refractory period distributions and 2D projections of the cell positions. These individual components are integrated using the create_advanced_visualizations() function, which compiles them into a cohesive, publication-quality figure. This comprehensive visualization approach enhances interpretation of both structural organization and functional alterations within the network.
Simulations with 500 Purkinje cells and two ischemic zones (one linear, one exponential) revealed the following patterns:
Three-dimensional network views displayed an interconnected, random spatial distribution, reflecting a plausible biological layout. Conduction velocities displayed a heterogeneous histogram, in line with experimental observations of Purkinje fiber variability.2 Ischemia severity accurately reflected the defined severity gradients—higher at the core, fading toward the periphery. The connectivity matrix heatmap demonstrated random but dense cell interconnections. Refractory periods varied widely, which is critical for modeling re-entrant conditions. Two-dimensional XY projections helped analyze spatial density and clustering (Figure 1).
This modeling approach effectively captures how ischemia alters key electrophysiological parameters, such as conduction velocity and refractory period, while enabling direct visual correlation between spatial structure and functional disruption. Notably, areas with high ischemia severity often align with slowed conduction or shortened refractoriness—both recognized as precursors to arrhythmia.5–7 While the current model uses randomized cell properties and connectivity, it is designed for future extensibility. Planned enhancements include integrating anatomically accurate branching patterns based on imaging data,4 implementing detailed electrophysiological models like Hodgkin-Huxley or Rudy-Li,1,2 simulating action potential propagation with dynamic feedback, and exploring pharmacological interventions to assess therapeutic effects.3,7
Limitations of this model include its current focus on static representation of ischemia and cell properties. Dynamic simulations of impulse propagation, feedback mechanisms, and the temporal evolution of ischemic injury are not yet integrated. The cell model is simplified, and detailed ion channel kinetics are not considered.
This model currently focuses on static representation of ischemia and cell properties. Dynamic simulations of impulse propagation, feedback mechanisms, and the temporal evolution of ischemic injury are not yet integrated. The cell model is simplified, and detailed ion channel kinetics are not considered.
Future work will focus on implementing dynamic action potential propagation, developing anatomically informed connectivity models, and integrating biophysically detailed Purkinje cell models. We also aim to simulate pharmacological interventions and validate model predictions using experimental data from in vitro or in vivo studies.
We have developed a computational framework that models and visualizes how ischemia affects the Purkinje network. It integrates cell-level variability, customizable ischemic regions, and rich visual outputs, all within a Python-based ecosystem. The model provides a clear, visual, and quantitative understanding of how ischemic damage disrupts electrical conduction and may contribute to arrhythmia. With future enhancements, it holds strong potential for in silico exploration of cardiac pathology and intervention design.
| Views | Downloads | |
|---|---|---|
| F1000Research | - | - |
|
PubMed Central
Data from PMC are received and updated monthly.
|
- | - |
Provide sufficient details of any financial or non-financial competing interests to enable users to assess whether your comments might lead a reasonable person to question your impartiality. Consider the following examples, but note that this is not an exhaustive list:
Sign up for content alerts and receive a weekly or monthly email with all newly published articles
Already registered? Sign in
The email address should be the one you originally registered with F1000.
You registered with F1000 via Google, so we cannot reset your password.
To sign in, please click here.
If you still need help with your Google account password, please click here.
You registered with F1000 via Facebook, so we cannot reset your password.
To sign in, please click here.
If you still need help with your Facebook account password, please click here.
If your email address is registered with us, we will email you instructions to reset your password.
If you think you should have received this email but it has not arrived, please check your spam filters and/or contact for further assistance.
Comments on this article Comments (0)