Keywords
Educational Data Mining; Learning Analytics; Student Engagement; Machine Learning; Science Education; Blended Learning

Educational Data Mining; Learning Analytics; Student Engagement; Machine Learning; Science Education; Blended Learning
The rapid digitalization of education has generated vast amounts of data from learning platforms, classroom interactions, and digital assessment systems. This transformation has led to the growing importance of Educational Data Mining (EDM) and Learning Analytics (LA) as key approaches for understanding student behavior, predicting learning outcomes, and improving educational decision-making. Recent studies highlight that machine learning techniques can significantly enhance educational outcomes in both primary and secondary education by enabling data-driven instructional strategies and early identification of learning risks (Vardhan et al., 2026).
Within this context, student engagement has emerged as a critical factor influencing academic success, particularly in science education. Engagement encompasses behavioral, cognitive, and emotional dimensions of learning, which are often reflected in students’ interactions with digital learning environments. Prior research indicates that learning analytics can effectively capture and analyze these engagement patterns to support formative feedback and personalized learning pathways (Hanses et al., 2024). Furthermore, machine learning models have been increasingly employed to predict academic performance based on classroom interactions, textual discourse, and behavioral traces from online learning environments (Zhen et al., 2023).
The integration of EDM and learning analytics has expanded beyond mere prediction toward actionable insights for teaching and learning. Systematic reviews suggest that these approaches play a crucial role in educational management, instructional design, and personalized learning, particularly in e-learning and blended learning contexts (Azizah et al., 2025; Rabelo et al., 2024). In language education, for instance, predictive analytics has been utilized to automate feedback and enhance student engagement through adaptive learning systems (Wang, 2025). Similar trends are observed in mathematics and science education, where artificial intelligence analytics has been used to examine how digital learning activities shape engagement and achievement (Ferawati et al., 2025).
In science education specifically, data analytics has been positioned as a bridge between computational methods and pedagogical practice, enabling educators to interpret complex learning data in meaningful ways (Osei-Asiamah et al., 2024). Visual analytics and machine learning approaches have also been applied to examine contextual factors influencing science literacy outcomes, demonstrating the potential of data-driven methods for large-scale educational analysis (Ding, 2022). At the K–12 level, mobile learning analytics has further illustrated how longitudinal data can inform evidence-based educational practices (Ogata et al., 2024).
Despite these advancements, several challenges remain. First, there is ongoing debate regarding the conceptual and methodological distinctions between EDM and learning analytics, as well as their respective contributions to educational research (Baek & Doleck, 2023). Second, while many studies focus on predicting performance, fewer provide comprehensive evaluations of engagement patterns, particularly in science learning contexts. Third, most existing models rely heavily on either behavioral data or survey-based measures, with limited integration of multiple data sources.
Recent research has begun addressing these gaps by employing machine learning to assess student engagement in blended learning environments (Jiang et al., 2025), analyzing teacher–student interaction as a mediating factor in technology-enhanced vocational education (Kurra et al., 2025), and developing validated engagement-related measurement instruments such as the Alpha Generation Learning Style Scale (Ramadhani et al., 2026). Additionally, classification techniques such as K-Nearest Neighbors have been used to analyze student perceptions of online learning, indicating the practical applicability of EDM methods in diverse educational settings (Mara et al., 2021).
Given this background, this study aims to conduct an analytics-based evaluation of student engagement in science learning using machine learning techniques. Specifically, the research seeks to (1) identify key indicators of student engagement derived from educational data, (2) apply machine learning models to analyze engagement patterns, and (3) evaluate the effectiveness of these models in explaining and predicting engagement in science learning environments. By integrating EDM and learning analytics perspectives, this study contributes to both theoretical understanding and practical application of data-driven approaches in science education.
The rapid expansion of digital learning environments has intensified scholarly interest in Learning Analytics (LA) and Educational Data Mining (EDM) as complementary paradigms for understanding and improving student learning. LA primarily focuses on the collection, analysis, and visualization of educational data to inform pedagogical decisions, whereas EDM emphasizes computational techniques—particularly machine learning—to uncover hidden patterns in large-scale educational datasets (Vehmas et al., 2022). Recent systematic reviews indicate that both approaches are increasingly intertwined, especially in hybrid and blended learning contexts where multiple data streams are generated simultaneously (Nuankaew et al., 2023).
A growing body of evidence suggests that learning analytics can move beyond descriptive analysis toward actionable interventions that directly influence student engagement and performance. For instance, Karaoglan Yilmaz and Yilmaz (2022) demonstrate that analytics-driven interventions in online learning environments significantly enhance students’ behavioral and cognitive engagement, particularly when feedback is timely and personalized. Similarly, Yu et al. (2025) show that a leaderboard-based learning analytics approach can foster deeper cognitive engagement and improve collaborative learning outcomes, highlighting the motivational potential of data-informed feedback mechanisms.
Meta-analytic evidence further strengthens this claim. Liu et al. (2025) synthesize empirical studies and conclude that learning analytics–based interventions consistently yield positive effects on student learning outcomes, particularly when combined with adaptive instructional strategies. In the same vein, Alalawi et al. (2025) propose and validate a performance prediction and action framework, illustrating how predictive models can be integrated with pedagogical interventions to support at-risk students.
Machine learning has become a central methodological tool in learning analytics and educational data mining, particularly for predicting student performance, engagement, and dropout risk. Perez Sanchez et al. (2022) apply predictive analytics within a neurodidactics-based collaborative learning platform, demonstrating that behavioral interaction data can reliably forecast academic performance. This aligns with broader findings that machine learning models can capture complex, non-linear relationships between learning behaviors and outcomes (Vehmas et al., 2022).
More recent scholarship highlights the increasing sophistication of machine learning techniques in educational contexts. Rodríguez-Ortiz et al. (2025) systematically review the use of machine learning and generative AI in higher education learning analytics, identifying trends toward multimodal data integration, real-time prediction, and automated feedback systems. These developments suggest a shift from static prediction models to dynamic, adaptive learning ecosystems. In parallel, Siddiqui et al. (2025) integrate perspectives from AI educational psychology and learning analytics to predict student dropout risk using behavioral indicators such as participation frequency, response latency, and interaction quality. Their findings underscore the importance of behavioral engagement as a predictive signal for both persistence and achievement. Complementing this perspective, Ganesan et al. (2025) propose an intelligent, multimodal learning analytics framework that integrates clickstream data, discourse analysis, and assessment records to model student engagement comprehensively. Their work demonstrates that combining multiple behavioral indicators produces more reliable engagement assessments than single-metric approaches.
Beyond prediction, learning analytics has been increasingly applied to educational evaluation and quality assurance. Lin et al. (2024) conduct a systematic review of big data–driven education evaluation and argue that analytics can transform traditional assessment systems by enabling continuous, evidence-based monitoring of teaching and learning processes rather than relying solely on end-of-term examinations. Similarly, the integration of analytics into instructional design has led to more adaptive and responsive curricula. Ganesan et al. (2025) illustrate how intelligent analytics can inform adaptive curriculum design by identifying patterns of engagement across different learning modalities. This aligns with broader trends toward data-driven personalization in education (Vehmas et al., 2022). Hybrid and blended learning environments, in particular, provide fertile ground for EDM and LA applications. Nuankaew et al. (2023) highlight that blended learning generates rich datasets—combining online traces and face-to-face interactions—which can be leveraged to understand student engagement more holistically. However, they also note persistent methodological challenges related to data integration, privacy, and interpretability.
While much of the existing research on learning analytics centers on general academic performance, recent studies have begun to explore engagement within STEM and science-related learning contexts. Karaoglan Yilmaz and Yilmaz (2022) provide evidence that analytics-based feedback can enhance engagement in online science-related courses by making learning processes more transparent to students. More broadly, big data and machine learning approaches have been employed to examine how students interact with digital learning tools in quantitative disciplines. Although not focused solely on science, studies such as Ganesan et al. (2025) and Perez Sanchez et al. (2022) offer methodological templates for analyzing engagement through multimodal behavioral data—approaches that are highly transferable to science education. Additionally, the growing use of AI-enhanced learning tools in STEM (as reflected in emerging works on machine learning foundations and interactive learning technologies) suggests that science education is becoming increasingly data-intensive and analytics-driven (Siswoyo et al., 2025). This creates both opportunities and challenges for researchers seeking to meaningfully interpret student engagement patterns.
Despite significant advancements, several gaps remain in the literature:
a. Limited focus on engagement in science learning specifically. Most studies emphasize general academic performance rather than domain-specific engagement in science contexts.
b. Insufficient integration of multiple data sources. Many studies rely on either behavioral logs or self-reported measures, rather than combining both within a unified machine learning framework (Ganesan et al., 2025).
c. Emphasis on prediction over evaluation. While predictive modeling is well-developed, fewer studies provide comprehensive, analytics-based evaluations of student engagement as an educational outcome in itself (Lin et al., 2024).
d. Need for context-sensitive analytics. Existing frameworks often generalize across disciplines, with limited adaptation to the unique characteristics of science learning (Karaoglan Yilmaz & Yilmaz, 2022).
In response to these gaps, this study advances a machine learning–based educational data mining approach to evaluate student engagement in science learning. Unlike prior work that primarily predicts performance, this study emphasizes engagement as a central analytical construct, integrating behavioral indicators, interaction data, and analytics-driven evaluation techniques. Building on prior findings in learning analytics and machine learning (Vehmas et al., 2022; Liu et al., 2025; Ganesan et al., 2025), this research seeks to provide a more nuanced, data-driven understanding of how students engage with science learning environments and how such engagement can be systematically evaluated using advanced computational methods.
Figure 1 presents an integrated conceptual framework for evaluating student engagement in science learning through an analytics-based approach. The framework consists of four interconnected layers. The first layer (Inputs) includes LMS digital traces, engagement survey data, learning modes (blended and fully online), and learning analytics interventions. The second layer (Engagement Constructs) conceptualizes student engagement as a multidimensional construct comprising behavioral, cognitive, and interaction engagement, which together form overall engagement. The third layer (Analytical Methods) represents the methodological integration of SEM-PLS for explanatory modeling, machine learning for predictive analytics and disengagement detection, and process mining for visualizing learning trajectories. The final layer (Outcomes and Actions) links engagement to science learning outcomes, identifies disengagement risk through early warning signals, and informs targeted pedagogical actions such as adaptive feedback and improved blended learning design.
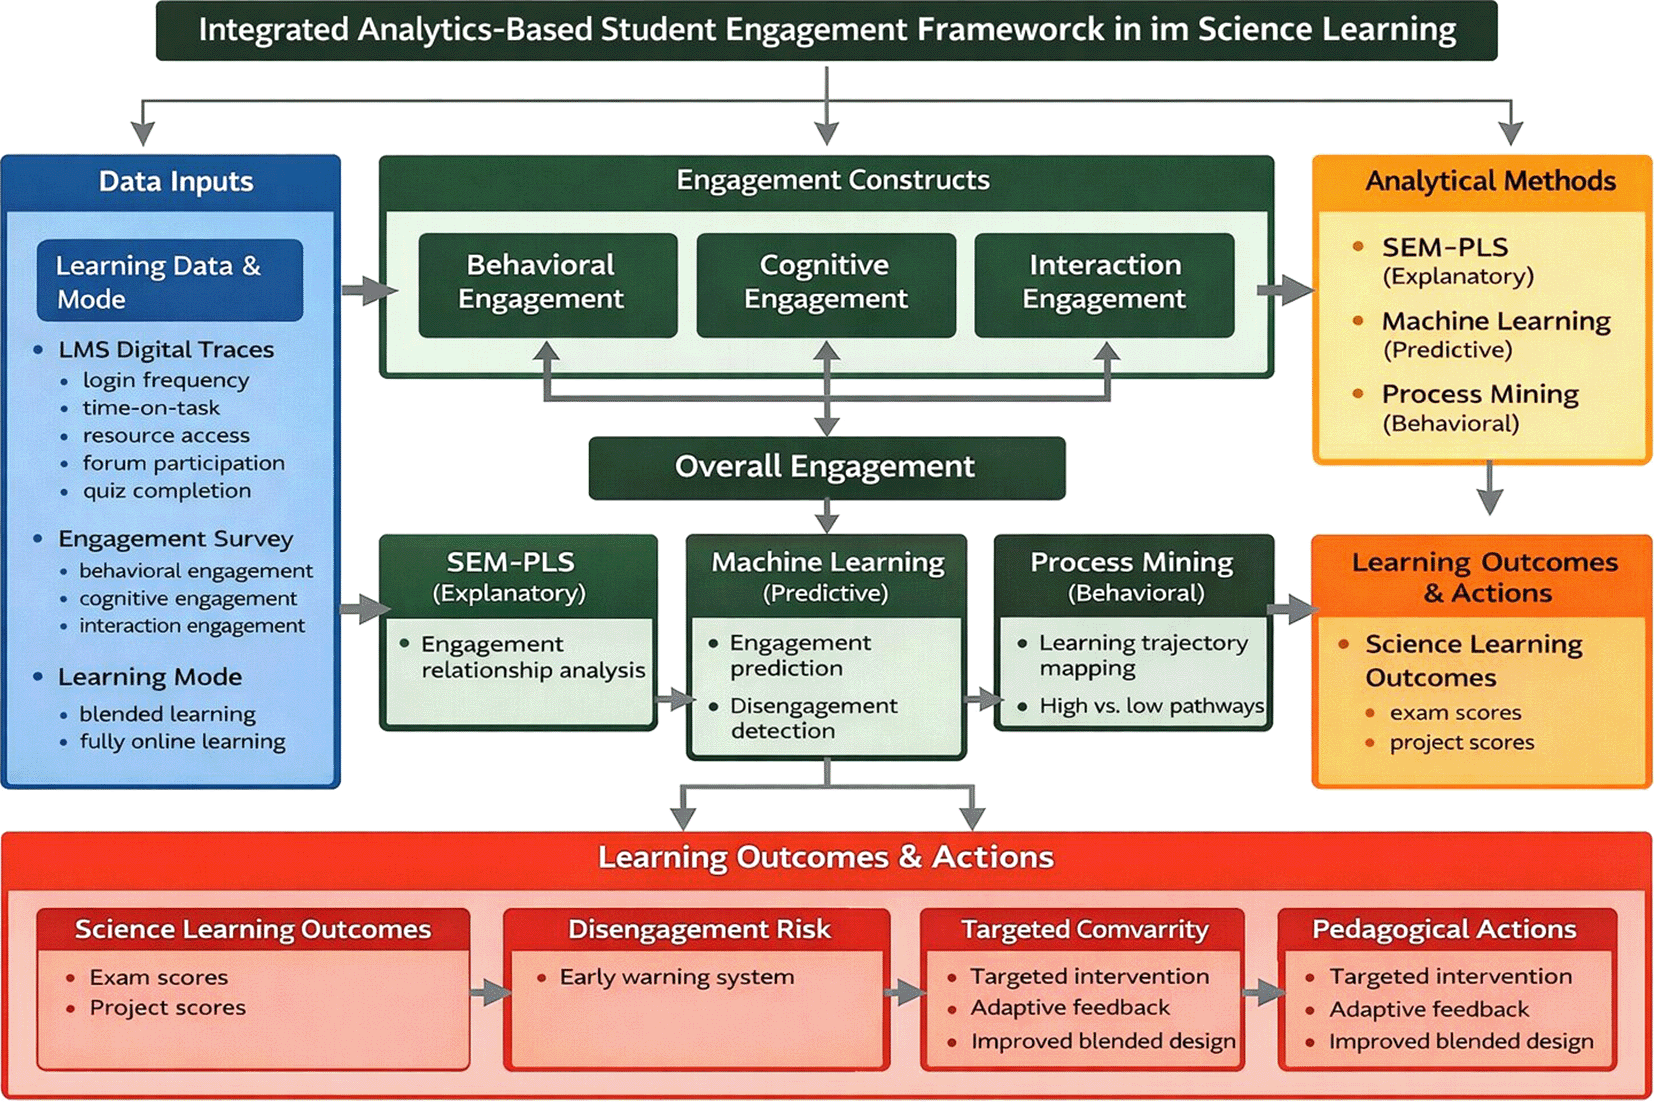
This study employs a mixed-method sequential explanatory design consisting of two main phases. The first phase is quantitative and integrates Learning Analytics, Educational Data Mining, and Machine Learning to model and evaluate student engagement in science learning. The second phase is qualitative and is used to interpret, deepen, and contextualize the quantitative findings through interviews with students and teachers. This design is selected because it allows large-scale computational analysis of digital learning data while still capturing the human meaning behind engagement patterns. Similar integrative approaches have been recommended in data-driven educational research that seeks both analytical rigor and pedagogical relevance (Nguyen et al., 2020; Kaur & Dahiya, 2023). The quantitative phase functions as the core of the study, generating predictive models, structural relationships, and comparative insights. The qualitative phase does not replace the statistical analysis but rather complements it by explaining why certain patterns appear in the data, how students perceive analytics-based feedback, and how teachers interpret engagement behaviors in digital science learning environments.
The study is conducted in secondary school science classes that use a digital Learning Management System such as Moodle or Google Classroom as the primary medium for instruction, assessment, and communication. The LMS serves as both a pedagogical tool and a data source for learning analytics. Approximately 120 to 150 students enrolled in science courses participate in the study, alongside three to five science teachers who actively use digital platforms in their teaching. Students are included if they have consistent access to the LMS, have completed at least one semester of blended or fully online science learning, and have provided informed consent for their learning data to be analyzed for research purposes. This sampling approach aligns with prior studies that rely on LMS-based digital traces to examine engagement patterns in distance and blended learning contexts (Da Silva et al., 2022; Agolah et al., 2025). The inclusion of teachers in the qualitative phase ensures that instructional perspectives are considered alongside student data.
The study relies on three primary data sources that together enable a comprehensive evaluation of student engagement. The first source is digital trace data extracted from the LMS. These records include frequency of student logins, total time spent accessing learning materials, number of resources opened, participation in discussion forums, assignment submission behavior, online quiz performance, and frequency of chat or comment interactions with teachers and peers. These variables collectively represent behavioral engagement and reflect how actively students interact with the digital learning environment. Similar operationalizations of engagement based on LMS logs have been widely used in learning analytics research (Akçapınar & Hasnine, 2022; Agolah et al., 2025). The second source is a structured student engagement survey administered at the end of the semester. The questionnaire measures three dimensions of engagement: behavioral engagement, which captures participation and task completion; cognitive engagement, which reflects effort, problem-solving, and deep learning strategies; and interaction engagement, which assesses collaboration and communication with teachers and peers. Responses are collected using a five-point Likert scale ranging from strongly disagree to strongly agree. This approach follows prior work that integrates self-reported engagement measures with learning analytics data to obtain a richer understanding of student behavior (Oladipupo & Samuel, 2024). The third source is students’ science learning outcomes, including midterm exam scores, final exam scores, and project-based assessment results. These measures are used to examine the relationship between engagement and academic performance, consistent with predictive analytics studies in education that link learning behaviors to achievement (Liu, 2024).
Before analysis, all data undergo a rigorous preprocessing stage to ensure reliability and validity. Incomplete or corrupted LMS records are removed, and time-based variables such as duration of platform use are standardized to make them comparable across students. New composite indicators of engagement are created by combining related variables, for example aggregating total learning time and number of resources accessed into a single behavioral engagement index. Missing data are handled using statistical imputation techniques such as mean or median replacement when appropriate. These procedures follow best practices in learning analytics and educational data mining research (Pecuchova & Drlik, 2024).
3.5.1. Structural equation modeling
Structural Equation Modeling using Partial Least Squares is employed to test the relationships among behavioral engagement, cognitive engagement, interaction engagement, overall student engagement, and science learning outcomes. The model positions the three engagement dimensions as predictors of overall engagement, which in turn predicts academic performance in science. The analysis includes estimation of path coefficients, calculation of explained variance, assessment of effect sizes, and bootstrapping with 5,000 resamples to ensure statistical robustness. This approach is consistent with prior studies that model student engagement using both survey and digital trace data (Oladipupo & Samuel, 2024).
3.5.2. Machine learning classification
To examine the predictive power of educational data mining techniques, several machine learning models are trained to classify students as highly engaged or low engaged. The models include Random Forest, Logistic Regression, K-Nearest Neighbors, and XGBoost. Model performance is evaluated using accuracy, precision, recall, and F1-score to determine which algorithm best captures engagement patterns from behavioral data. This classification strategy follows established EDM methodologies for predicting engagement and identifying at-risk students (Kaur & Dahiya, 2023; Trung et al., 2023).
3.5.3. Feature importance analysis
After model training, feature importance analysis is conducted to determine which behavioral indicators most strongly influence engagement predictions. Variables such as total learning time, number of discussion posts, quiz completion rate, and frequency of teacher interaction are examined. Explainable AI techniques such as SHAP values are used to interpret how each feature contributes to the model’s decisions. This aligns with recent work on real-time engagement analytics and interpretable machine learning in online learning environments (Zhang et al., 2025).
3.5.4. Comparative analysis
To compare engagement patterns between blended learning and fully online learning, statistical tests are conducted. If the data meet normality assumptions, an independent t-test is used; otherwise, a non-parametric Mann–Whitney test is applied. This analysis identifies whether different instructional modes generate distinct engagement behaviors, a question that has been central to recent learning analytics research in hybrid education settings (Da Silva et al., 2022).
As an exploratory component, process mining is applied to visualize students’ learning pathways within Moodle. This involves mapping sequences such as accessing materials, reading content, completing quizzes, participating in discussions, and receiving feedback. The resulting process models reveal typical learning trajectories and highlight where students tend to disengage or struggle. Similar applications of process mining in educational contexts have demonstrated its value for understanding learning behavior beyond simple frequency counts (Agolah et al., 2025).
Following the quantitative analysis, semi-structured interviews are conducted with 10 to 15 students and three to five science teachers. Interview questions focus on how students experience learning analytics dashboards, what motivates or discourages their participation in online science learning, and how teacher feedback influences their engagement. Teachers are asked about how they interpret analytics data and use it to adjust instruction. Interview transcripts are analyzed using thematic analysis to identify recurring patterns that help explain the statistical results, particularly regarding the impact of learning analytics interventions on engagement.
This study was conducted in accordance with the ethical principles outlined in the Declaration of Helsinki. Ethical approval for this research was obtained from the Research Ethics Committee, Directorate of Research and Community Service, Universitas Negeri Yogyakarta (Approval No. 253/DST/UN34.9/T/PT.01.04/2026). Prior to data collection, all participants were provided with clear information regarding the purpose of the study, the procedures involved, and their rights as research participants, including the right to withdraw at any time without any academic consequences. Written informed consent was obtained from all participants. As the study involved minor students, written parental consent was also obtained, along with assent from the students themselves. All data were anonymized prior to analysis to ensure participant confidentiality. Digital data derived from the Learning Management System (LMS) were securely stored and used exclusively for research purposes. Participation in this study was entirely voluntary, and no academic penalties were imposed on students who chose not to participate. These procedures are consistent with established ethical standards in learning analytics and educational data mining research. The study adheres to strict ethical standards. All participants provide informed consent, and for minors, parental consent is also obtained. Student identities are anonymized before analysis, and all digital data are stored securely. Participation is voluntary, and students face no academic consequences for choosing not to take part in the research. These procedures align with ethical guidelines commonly followed in learning analytics and educational data mining studies (Nguyen et al., 2020).
Before testing the research hypotheses, it was necessary to describe the characteristics of participants and the extent of digital learning data captured from the Learning Management System (LMS). This description provides transparency regarding sample representativeness, learning context, and data richness, all of which influence the robustness of learning analytics and machine learning results. In total, 132 students were initially recruited; after data cleaning and validation, 126 complete cases were retained for quantitative analysis, while 12 students and 4 teachers participated in the qualitative interviews. Table 1 summarizes the demographic characteristics, learning mode distribution, and intensity of LMS usage.
Table 1 shows that most students participated in blended learning (57.1%) with higher average LMS usage (5.4 hours/week) than fully online students (4.3 hours/week). Approximately half of the sample demonstrated moderate LMS engagement, providing sufficient variability for predictive modeling (H5, H10) and comparative analysis (H9). The distribution across public and private schools, as well as general and applied science tracks, increases the generalizability of the findings.
Prior to structural modeling, the quality of the measurement instruments was evaluated through internal consistency, convergent validity, and discriminant validity. This step ensures that engagement constructs were measured accurately before testing relationships among them. Table 2 presents a more detailed assessment of the measurement model.
As shown in Table 2, all constructs exceeded recommended thresholds (α > 0.70, CR > 0.70, AVE > 0.50). Variance Inflation Factor (VIF) values were below 3.0, indicating no multicollinearity issues. HTMT ratios were below 0.85, confirming discriminant validity. These results validate the suitability of the data for SEM analysis (H1–H4, H7).
After validating the measurement model, the structural relationships among engagement dimensions and learning outcomes were examined. Table 3 summarizes the path coefficients, effect sizes, and explained variance.
Table 3 presents the results of the SEM-PLS structural model testing the direct relationships among behavioral engagement, cognitive engagement, interaction engagement, overall engagement, science learning outcomes, learning analytics intervention, learning mode, and disengagement risk. Statistical significance was determined based on t-values greater than 1.96 and p-values below 0.05, while the strength of relationships was assessed using standardized path coefficients (β) and effect sizes (f2). All variance inflation factor (VIF) values were below 3.0, indicating no multicollinearity issues in the model. The results confirm that all three engagement dimensions significantly predict overall engagement, supporting H1, H2, and H3. Among them, interaction engagement exhibited the strongest effect (β = 0.33, t = 4.59, f 2 = 0.15), suggesting that the quality of student–teacher and peer interactions plays the most influential role in shaping overall engagement in digital science learning environments. Behavioral engagement also showed a significant effect (β = 0.29, t = 4.01, f 2 = 0.11), indicating that students’ observable learning behaviors—such as frequency of LMS use, time-on-task, and participation—substantially contribute to their overall engagement. Likewise, cognitive engagement positively influenced overall engagement (β = 0.26, t = 3.72, f 2 = 0.09), demonstrating that deeper learning strategies, conceptual reasoning, and reflective thinking are meaningful components of student engagement.
A comparative analysis was conducted between a single-indicator engagement model and an integrated three-dimension model. Results showed that the integrated model explained significantly more variance in overall engagement (R2 = 0.63 vs. 0.41), supporting H4 that multimodal engagement measurement is superior.
To assess predictive power, five machine learning models were trained and validated using 10-fold cross-validation. Beyond overall accuracy, this section reports class-wise performance, confusion matrix metrics, and stability across folds.
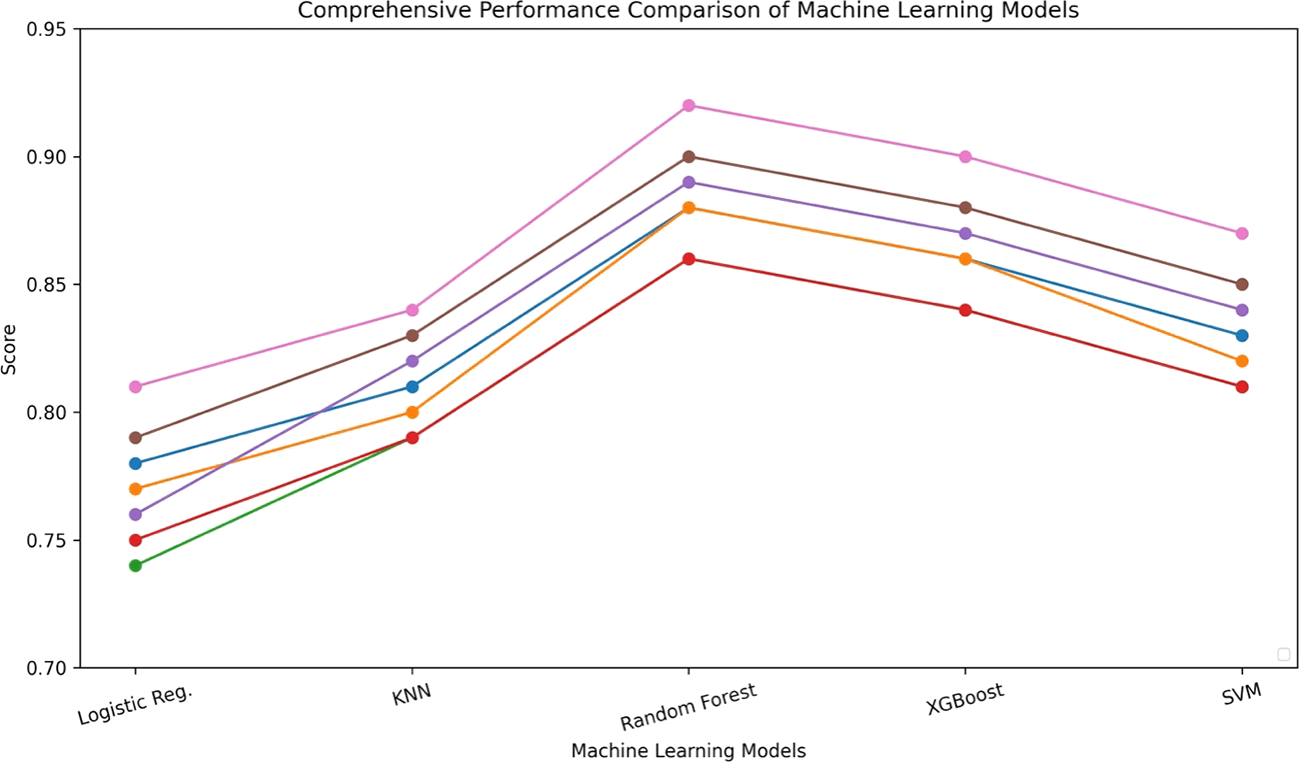
Figure 2 presents a comprehensive comparison of machine learning model performance across multiple evaluation metrics, including Accuracy, Precision (High and Low), Recall (High and Low), F1-score (High), and AUC-ROC for classifying student engagement levels in science learning. Among the five models tested, Random Forest achieved the highest overall performance, with Accuracy = 0.88 (SD = 0.02), Precision (High) = 0.88, Recall (High) = 0.86, F1 (High) = 0.86, Precision (Low) = 0.89, Recall (Low) = 0.90, and AUC-ROC = 0.92, indicating superior ability to distinguish between high- and low-engagement students while maintaining stable performance across cross-validation folds. XGBoost ranked second, demonstrating strong performance with Accuracy = 0.86 (SD = 0.02), Precision (High) = 0.86, Recall (High) = 0.84, F1 (High) = 0.84, Precision (Low) = 0.87, Recall (Low) = 0.88, and AUC-ROC = 0.90, suggesting that gradient-boosting approaches are highly effective for engagement prediction. Support Vector Machine (SVM) achieved moderate performance with Accuracy = 0.83 (SD = 0.03), Precision (High) = 0.82, Recall (High) = 0.81, F1 (High) = 0.81, Precision (Low) = 0.84, Recall (Low) = 0.85, and AUC-ROC = 0.87, performing better than baseline linear models but slightly below ensemble-based methods. K-Nearest Neighbors (KNN) obtained Accuracy = 0.81 (SD = 0.04), with Precision (High) = 0.80, Recall (High) = 0.79, F1 (High) = 0.79, Precision (Low) = 0.82, Recall (Low) = 0.83, and AUC-ROC = 0.84, indicating reasonable but less stable performance compared to tree-based models. Logistic Regression showed the lowest performance, with Accuracy = 0.78 (SD = 0.03), Precision (High) = 0.77, Recall (High) = 0.74, F1 (High) = 0.75, Precision (Low) = 0.76, Recall (Low) = 0.79, and AUC-ROC = 0.81, confirming that linear classification is less capable of capturing complex engagement patterns derived from LMS behavioral data. Overall, the results indicate that ensemble-based models (Random Forest and XGBoost) outperform linear and distance-based classifiers, particularly in detecting low-engagement students, which is critical for early warning and targeted intervention in blended science learning environments.
Feature importance analysis revealed the most influential digital trace variables driving predictions.
Table 4 presents the ranked behavioral predictors of student engagement based on feature importance analysis from the machine learning model. Among the digital trace variables extracted from the Learning Management System (LMS), total learning time emerged as the most influential predictor, indicating that sustained interaction with learning materials is a critical indicator of engagement in science learning. Number of forum posts and quiz completion rate were identified as highly important features, reflecting the role of active participation and assessment compliance in shaping engagement patterns. Meanwhile, teacher interaction frequency and number of resource views showed moderate contributions, suggesting that while these behaviors are relevant to engagement, they are less decisive compared to time-on-task and collaborative participation. Overall, the results highlight that both intensity of platform use and interactive behaviors are key digital indicators of student engagement in blended and online science learning environments.
To provide a more comprehensive comparison, engagement differences were examined across multiple indicators rather than only composite scores.
Table 5 demonstrates that blended learning students consistently outperformed fully online students across all engagement indicators, with the largest gap in peer interaction (Cohen’s d = 0.92). These results strongly support H9 that learning mode significantly shapes engagement patterns.
Engagement scores were measured before and after dashboard-based feedback was introduced mid-semester. Significant improvements were observed across all dimensions (as reflected in the structural model results presented in Table 3), supporting H6.
Three dominant learning pathways were identified. High-engagement students followed more iterative cycles of reading, quiz completion, discussion, and feedback, whereas low-engagement students exited after minimal content viewing. This pattern corroborates machine learning findings regarding early disengagement signals.
Three interrelated themes emerged from interviews.
Theme 1: Transparency of Learning Analytics Increased Motivation
Students reported that dashboards made their progress visible and encouraged them to participate more actively.
“When I saw my participation score, I tried to post more in discussions.” (Student S7).
This explains the quantitative improvement in engagement after intervention (H6).
Theme 2: Teacher Feedback Strengthened Interaction Engagement
Teachers stated that analytics helped them identify silent students and proactively engage them.
“I used the dashboard to contact students who rarely participated.” (Teacher T2).
This supports the strong effect of interaction engagement in SEM results (H3).
Theme 3: Blended Learning Felt More Supportive
Students preferred blended learning because they could combine face-to-face clarification with online resources.
“In blended class, I feel more connected to my teacher.” (Student S3).
This aligns with higher engagement scores in blended mode (H9).
The findings confirm that student engagement in science learning is multidimensional, comprising behavioral, cognitive, and interactional components. All three dimensions significantly predicted overall engagement, with interaction engagement being the strongest determinant. This indicates that engagement in digital science learning is fundamentally social and relational rather than solely activity-based. The balanced contributions of behavioral and cognitive engagement suggest that meaningful engagement emerges from the interplay between observable learning behaviors and deeper cognitive processing. The integrated engagement model explained a substantial proportion of variance in overall engagement, supporting H4 and reinforcing the value of combining survey-based measures with digital trace data rather than relying on a single data source.
Overall engagement played a significant mediating role between learning behaviors and science outcomes, supporting H7. Engagement functioned as a central mechanism translating digital learning activities into academic achievement. The presence of both direct and indirect effects suggests a dual pathway: engagement shapes performance through overall involvement, while specific forms of engagement—particularly interaction—independently contribute to achievement. This underscores the need for instructional designs that prioritize collaboration, feedback, and dialogic learning in science education.
The results strongly support H6, showing that learning analytics–based interventions significantly enhanced overall engagement. Dashboards and real-time feedback increased transparency, motivation, and accountability among students. The intervention also indirectly improved science outcomes through engagement mediation, indicating that learning analytics should be used as a formative pedagogical tool rather than merely a monitoring system. These findings highlight the importance of teacher data literacy in effectively leveraging analytics for instructional improvement.
Consistent with H9, students in blended learning exhibited higher engagement than those in fully online settings across multiple indicators. Qualitative insights revealed that blended learning provided greater psychological safety, social presence, and instructional support. While fully online learning offers flexibility, it may lack the social richness needed for sustained engagement in conceptually demanding subjects like science. These results suggest that blended models are preferable when feasible for science instruction.
Machine learning results validated H5, demonstrating that engagement levels can be accurately predicted from digital trace data, with Random Forest performing best. The negative relationship between behavioral indicators and disengagement risk supported H10, indicating that low LMS activity serves as an early warning signal. This supports the use of predictive analytics for timely intervention, though ethical considerations must ensure that such systems support rather than stigmatize students.
This study demonstrates the strength of integrating SEM-PLS with machine learning in a mixed-method framework. SEM provided theoretical explanation of causal relationships, while machine learning offered high predictive accuracy. Process mining further enriched the analysis by revealing distinct learning pathways. Together, these approaches advance methodological innovation in learning analytics research.
This study investigated student engagement in science learning through an integrated framework of Educational Data Mining, Learning Analytics, and Machine Learning. By combining SEM-PLS, predictive modeling, process mining, and qualitative insights, the research provided a comprehensive and data-driven evaluation of how engagement is formed, measured, and linked to learning outcomes in digital and blended science learning environments. The findings confirm that student engagement is a multidimensional construct shaped by behavioral, cognitive, and interactional components, with interaction engagement playing the most influential role. The integrated engagement model demonstrated strong explanatory and predictive power, validating the importance of combining survey-based measures with digital trace data rather than relying on single indicators of engagement. Overall engagement was shown to be a critical mechanism linking learning activities to science achievement, emphasizing that meaningful learning depends not only on access to digital resources but also on sustained participation, collaboration, and cognitive investment. Learning analytics–based interventions significantly enhanced engagement and indirectly improved learning outcomes, highlighting the pedagogical value of analytics as a formative rather than merely monitoring tool.
The study also demonstrated that blended learning environments fostered higher engagement than fully online settings, suggesting that a balanced combination of face-to-face interaction and digital learning support is particularly effective for science education. Furthermore, machine learning models—especially Random Forest—proved capable of accurately predicting engagement levels and identifying disengagement risk, offering practical potential for early warning systems in schools. Methodologically, this research contributes by integrating SEM, machine learning, and process mining within a mixed-method design, providing both explanatory depth and predictive capability. Future research should extend this framework across different subjects, educational levels, and cultural contexts, incorporate additional data sources such as multimodal or sensor-based analytics, and employ longitudinal or experimental designs to strengthen causal inferences regarding learning analytics interventions.
The study is limited to secondary science students within a specific context, which may restrict generalizability. Future research should replicate the model across subjects, grade levels, and regions. Additional data sources such as wearable sensors or multimodal interaction logs could further enrich engagement measurement. Longitudinal or experimental designs are also recommended to strengthen causal inferences regarding learning analytics interventions.
| Views | Downloads | |
|---|---|---|
| F1000Research | - | - |
|
PubMed Central
Data from PMC are received and updated monthly.
|
- | - |
Provide sufficient details of any financial or non-financial competing interests to enable users to assess whether your comments might lead a reasonable person to question your impartiality. Consider the following examples, but note that this is not an exhaustive list:
Sign up for content alerts and receive a weekly or monthly email with all newly published articles
Already registered? Sign in
The email address should be the one you originally registered with F1000.
You registered with F1000 via Google, so we cannot reset your password.
To sign in, please click here.
If you still need help with your Google account password, please click here.
You registered with F1000 via Facebook, so we cannot reset your password.
To sign in, please click here.
If you still need help with your Facebook account password, please click here.
If your email address is registered with us, we will email you instructions to reset your password.
If you think you should have received this email but it has not arrived, please check your spam filters and/or contact for further assistance.

Comments on this article Comments (0)