Keywords
CAFE ; Elderly monitoring; Multi-modal biosignals; Bandwidth optimization; Feature selection; IoT; Resource-constrained systems
This article is included in the Fallujah Multidisciplinary Science and Innovation gateway.
CAFE ; Elderly monitoring; Multi-modal biosignals; Bandwidth optimization; Feature selection; IoT; Resource-constrained systems
Remote health monitoring systems have become a vital component of elderly health care, especially since it is estimated that by 2050, the number of those aged 65+ and above will rise to 1.5 billion. The geographical and economic barriers that characterize traditional healthcare delivery appear to be insurmountable in resource-limited settings.1–4 The combination of Internet of Things (IoT) and multimodal biosignal analysis offers complete patient monitoring by obtaining constant and continuous electroencephalography (EEG), electromyography (EMG), electrocardiography (ECG), and electrooculography (EOG) signals.5,6 However, its actual implementation is limited by bandwidth constraints, namely the bandwidth of the wireless networks in rural and developing areas; in many cases, the uplink bandwidth is less than 2 kilobits per second (kbps) - not to support traditional multimodal monitoring methods.
The existing feature extraction methods of these modalities are spectral band power analysis of EEG,7,8 EMG-based gait, muscle coordination measures9,10 heart rate variability (HRV) as a predictor of falls,11–13 and EOG-derived blink patterns to detect alertness loss.14 Multimodal biosignal monitoring (EEG, EMG, ECG, and EOG) generates high-dimensional feature sets with a high redundancy rate; however, practical implementations are limited by the uplink bandwidth. Individual processing pipelines for each modality may fail to capture intersystem interactions at the clinical level of interest, including cardio-neuromuscular coupling and posture-neural interactions, which are of clinical significance in blocking fall risk. Recent developments in coupling analysis show that cortical muscular coherence15,16 and multichannel EMG coordination17 are both clinically relevant and diagnostically salient features and can be employed in feature classification, although computational costs tend to restrict real-time use.
The approach used in this study is a compact, cross-modal feature, where patterns of interest and redundant patterns are removed, allowing useful decision-making using compact bandwidth resources. Existing multimodal systems of elderly monitoring utilize 8-14 features per 4-second window (0.064-0.112 kbps transmission).2,18 Although these appear modest, they outperform bandwidth availability in most deployment scenarios (rural 2G networks and satellite links), burn battery life on wearables,19 and full-time multi-domain health measurement is not possible. The difficulty increases in older age groups who need long-term multi-domain surveillance (cardiac, cognitive, and mobility) in non-homogenous subjects, and they are not individualized.3,20,21 Existing studies take divergent directions: maximizing detection accuracy (large sets of features), minimizing transmission (vicious compression), and seldom cooperating.5,18,19
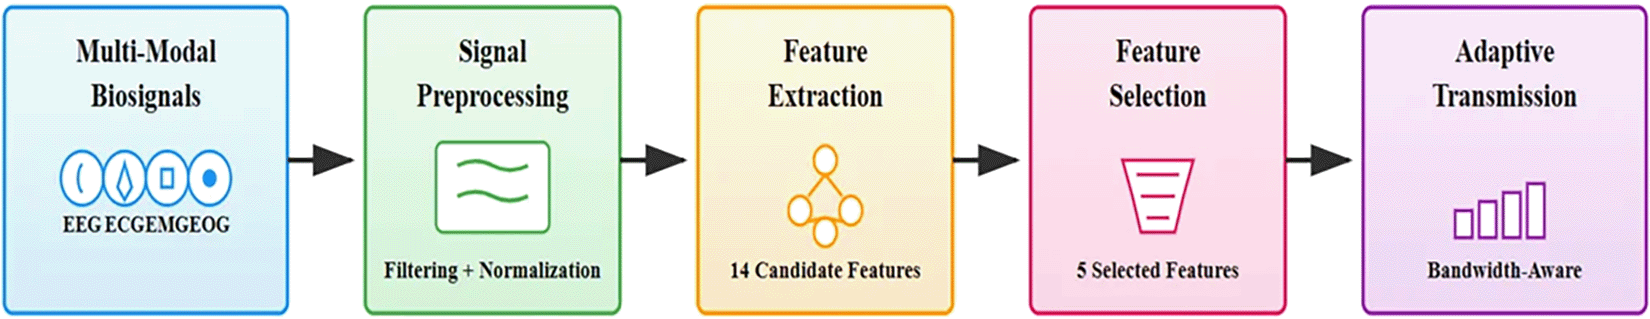
This work presents the CAFE framework for multi-domain elderly monitoring, which adopts this dual challenge through intelligent feature selection that maintains clinical efficacy while significantly reducing bandwidth requirements, the general flow of the work is shown in Figure 1. Unlike previous studies that were optimized for single subjects or synchronized recordings,5,18 CAFE operates across heterogeneous populations without calibration, making it suitable for large-scale deployments. CAFE achieved 70.8% F1 score in multi-domain health event detection (cardiac, cognitive, mobility) using five features at 0.040 kbps, no statistically significant difference to traditional methods' 69.8% F1 with eight features at 0.064 kbps (p=0.393).
Finally, this work makes four primary contributions: shows that comparable detection performance can be maintained with 37.5% fewer transmitted features; The work is demonstrated to be stable across a heterogeneous population of more than 100 subjects without any subject-specific training; it quantifies the practical benefits such as 62% bandwidth efficiency gain (F1/kbps measure) and 9.02 per year savings in data transfer costs; and it uses the identification of stable population characteristics that are present in different groups of older adults.
Recent advances in IoT-enabled health monitoring have investigated edge-computing architectures, multimodal biosignal analysis, feature extraction approaches, and resource-efficient algorithms. Edge computing is a critical model that has evolved into a real-time health-monitoring model. Smart healthcare was based on dynamic resource allocation by Chen et al.2 and 210 ms response time and 95.4% detection accuracy on cardiac and fall events with sensor fusion and lightweight AI were developed by Alshuhail et al.3 Ianculescu et al.1 demonstrated the practicality of IoT-based monitoring using the Monit4Healthy. However, none of these works deal with bandwidth optimization or include a report of the costs of transmission, which is a critical need in resource-constrained deployments.
The effectiveness of multimodal approaches has been extensively studied. Rodrigues et al.18 introduced feature-based retrieval using self-similarity matrices, whereas Sadras et al.20 introduced event detection for multimodal time series. Most recently, Oladunni and Wong21 determined that complementary domains of features (time + time-frequency) perform better (96% accuracy) than multi-domain fusion (redundant), a concept behind feature selection used by CAFÉ. Choudhary et al.22 investigated multi-domain EEG fusion using reduced electrode setup. However, these studies put more emphasis on the maximization of accuracy, disregarding bandwidth limitations and nonstop transmission expenses.
Lim and Lee conducted a comprehensive review of elderly monitoring feature extraction methods,23 while other researchers presented another direction to use feature extraction such as gait-based fall detection,4,9,10,39 EEG cognitive markers,7,8 cardiac HRV,11–13 and EOG vigilance14 have specialized methods. Advanced metrics of coupling15–17 necessitate synchronized records that cannot be found in multisubject datasets. These studies focused on feature engineering, but not on bandwidth-performance trade-offs. whereas Bagalà et al.19 established fall detection benchmarks (60-75% sensitivity) on real-world data. In an attempt to optimize the feature selection of an IoT intrusion, Mehssen and Al_Hamdawaee24 adopted RFE and PSO. Such studies go a step further in promoting feature engineering, but not the trade-off between feature richness and bandwidth efficiency.
Wearable systems have become resource-efficient. Stuart et al.25 named power consumption a critical bottleneck, as they reported that wireless transmission occupies a major part of energy consumption. Mostafa et al.26 and Kumar et al.27 proposedenergy-efficient AI algorithms, but emphasized the use of computational, not communication, efficiency.
Special-purpose systems have been developed for vital sign monitoring,5,28 assistive technologies,6 and Alzheimer's classification,29 but they typically focus on single conditions without bandwidth optimization. Graph-theoretical approaches30–33 offer principled frameworks for capturing inter channel relationships but require precise synchronization and are sensitive to noise. The graph features were very unstable, with a coefficient of variation (CV) > 0.4. Therefore, in the CAFE multi-subject dataset, and could not be used. Nevertheless, such coupling measures can be useful in patient-specific monitoring when calculated using synchronized same-subject measurements, allowing individual risk profiles once the baseline connectivity patterns of an individual are known.30,31
In spite of tremendous advancement, three gaps need addressing: there is little to no bandwidth optimization practices reported although resource-constrained deployments require this technique, multi-domain monitoring in practice targets individual conditions instead of simultaneous cardiac, cognitive, and mobility measurements, and cross-subject generalization without calibration is still a challenge. The first framework to clearly optimize bandwidth (0.040 kbps, 37.5% reduction) and at the same time measures three domains of health in 163 heterogeneous subjects without any calibration; no statistically significant difference (p=0.393) was achieved by CAFE. Table 1 summarizes the research landscape and the unique contributions of CAFEs.
| Research Focus | Key Works | Main Contribution | Bandwidth Optimization | Multi-Domain | Cross-Subject | Gap for CAFE |
|---|---|---|---|---|---|---|
| Edge Computing | Chen,2 Alshuhail,3 Ianculescu1 | Real-time processing; 95.4% accuracy; 210 ms latency | Not reported | 1-2 domains | Limited | No bandwidth metrics |
| Multimodal Analysis | Rodrigues,18 Oladunni & Wong,21 Sadras20 | Feature complementarity; 96% accuracy | Accuracy focus | Yes | N/A | Not continuous monitoring |
| Feature Selection | Lim & Lee,23 Choudhary,22 Mehssen24 | Scoping reviews; reduced electrodes; RFE+PSO | Assumes unlimited | Single modality | Small cohorts | No bandwidth-performance trade-off |
| Energy Efficiency | Stuart,25 Mostafa,26 Kumar27 | Wearable constraints; energy-efficient DNNs | Partial (energy) | Single domain | Not primary | Computational not communication |
| Application Systems | Chen & Sheng,5 Almujally,6 Bagalà,19 Yahia38 | Fall detection; vital signs; Alzheimer's | Not addressed | Single condition | Varied | No bandwidth optimization |
| CAFE (This Work) | 2025 | Bandwidth-optimized multi-domain monitoring | 0.040 kbps (37.5% reduction) | 3 domains | 163 subjects | Addresses all gaps |
Note: CAFE uniquely combines explicit bandwidth optimization (0.040 kbps), multi-domain coverage (cardiac + cognitive + mobility), and cross-subject validation (163 subjects, no calibration) with no statistically significant difference (p=0.393).
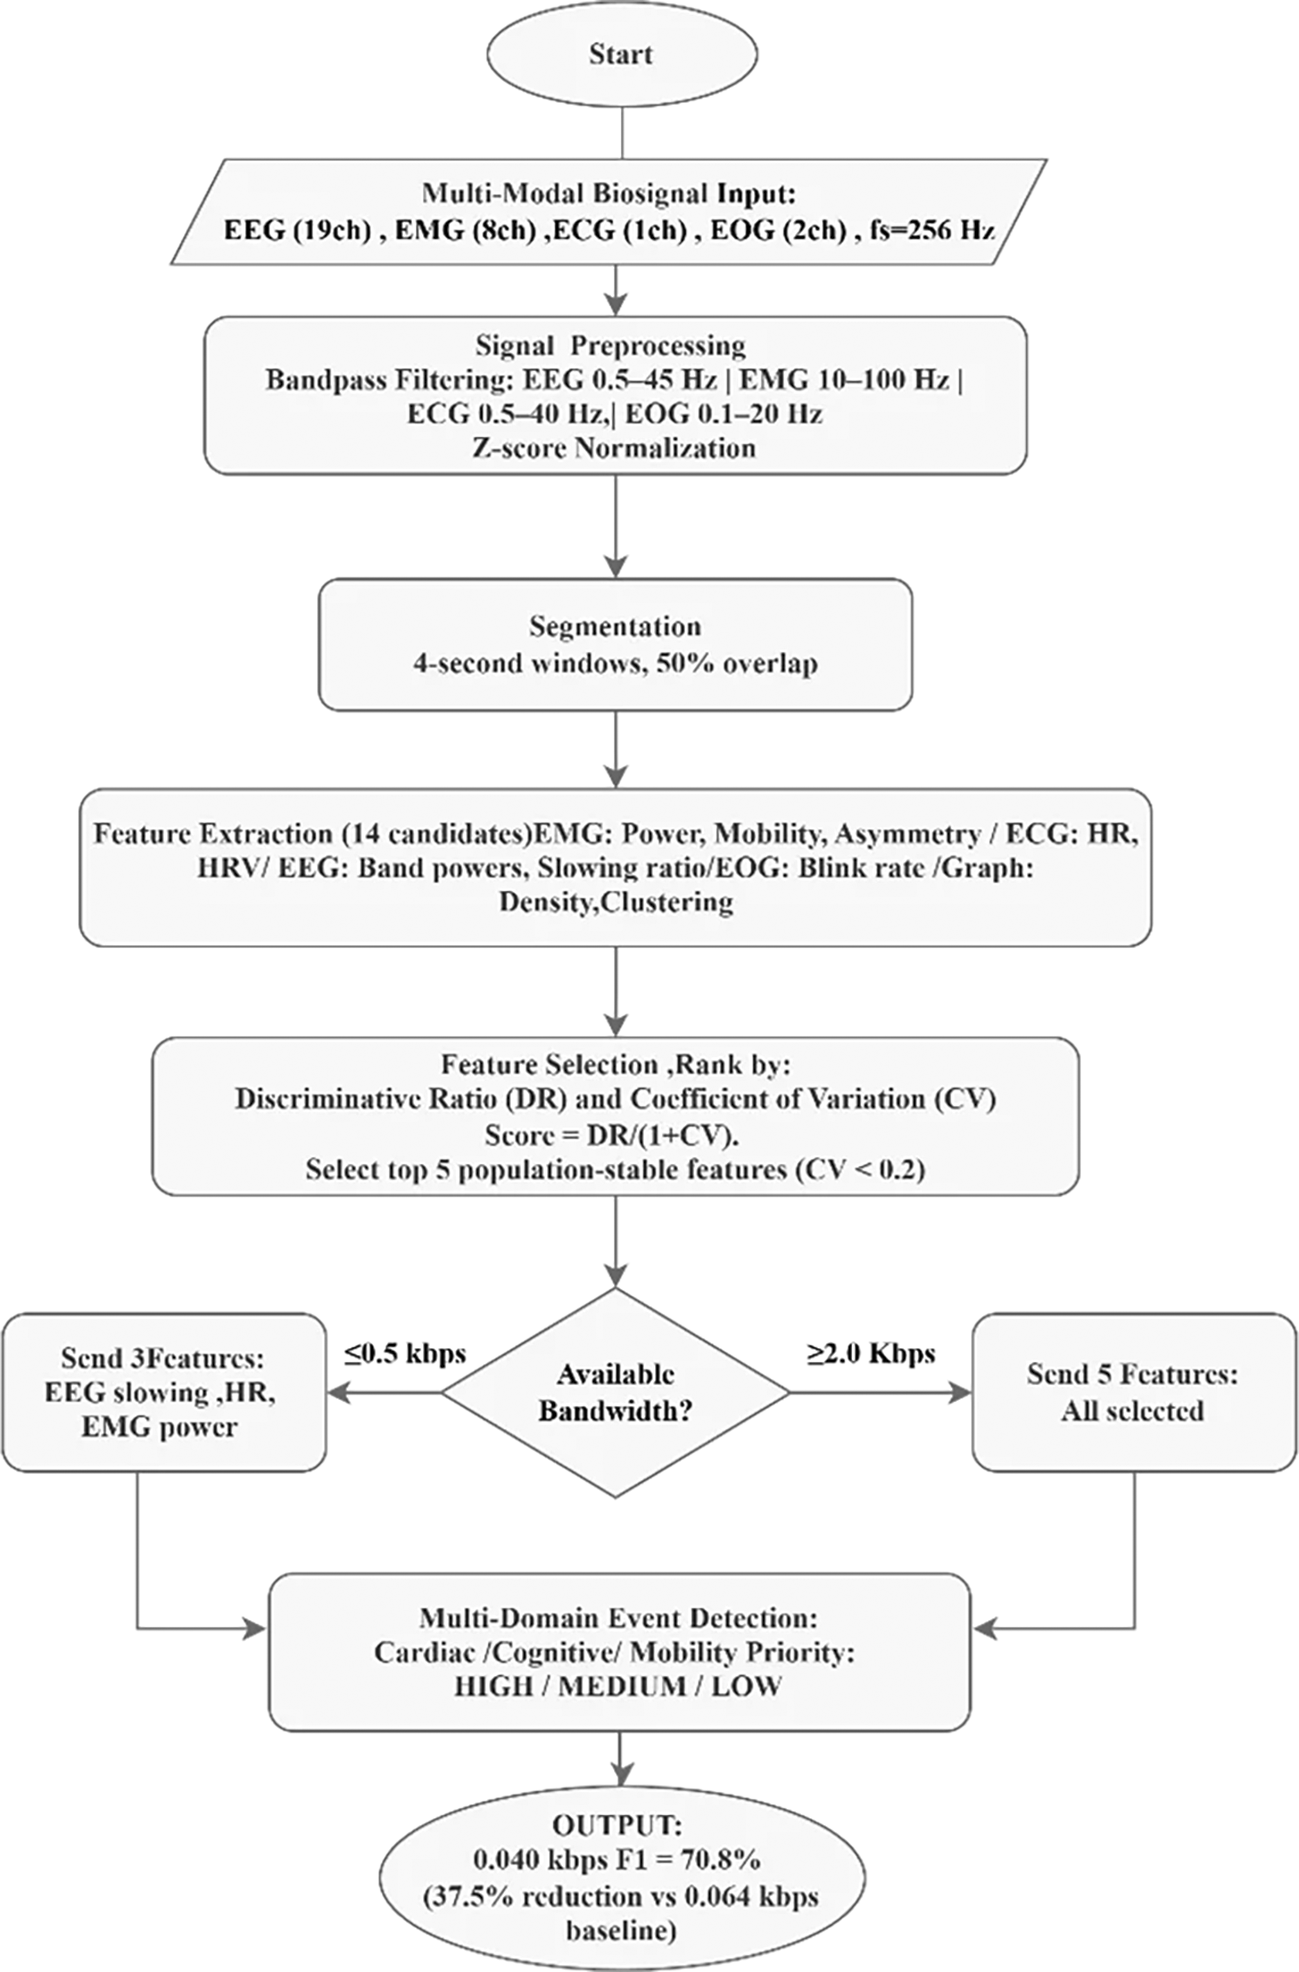
The CAFÉ (Novel Approach) framework minimizes data transmission requirements while maintaining clinical efficacy for multi-domain elderly health monitoring (cardiac, cognitive, mobility), as shown in the flow chart in Figure 2.
128 EEG files, 25 EOG records, and approximately10 EMG subjects during several activity sessions. These were non-overlapping cohorts (no synchronized recordings of the same subject). To discover initial features, signals were synchronized to a shared length (40245) of 2.6 min (256 Hz sampling rate) resulting in 77 multimodal windows 4-s long with 50% overlap. To validate this, 187 labeled EMG windows were used for 10 activity classes (bowing, clapping, handshaking, hugging, jumping, running, sitting, standing, walking, and waving) of 97,143 samples. The activities were categorized into fall risk (bowing, jumping, running; n=57 windows) and normal (sitting, standing, walking; n=130 windows) to perform a binary classification evaluation.
The datasets utilized in this study were all publicly available and had been collected and anonymized by their source authors. No new human subjects were identified and no identifiable human data obtained. The datasets in use are the Physical Action Data Set (EMG): UCI machine learning repository and the EEG data: Kaggle and EOG data: Zenodo, which are freely available and can be used in research. Thus, this secondary analysis of the existing anonymized data did not need ethical approval and informed consent.
All the signals were obtained at a sampling frequency of 256 Hz using anti-aliasing filters. Continuous signals were segmented into 4-s segments. windows with overlap of 50%, providing the processing and transmission harmony throughout the framework. Each channel underwent z-score normalization with variance checking (std > 10−10) to avoid numerical instability; the remaining nonfinite values were set to zero.40 To remove baseline drift and out-of-band noise while preserving spectral content, third-order zero-phase Butterworth bandpass filters were applied with modality-specific cutoffs, as follows:
From each 4-s window, a compact set of interpretable features spanning clinical domains was computed37:
- Cognitive Domain (EEG): Relative band powers (δ: 0.5–4 Hz, θ: 4–8 Hz, α: 8–13 Hz, β: 13–30 Hz) were computed via 512-point FFT using a single power spectral density (PSD) estimation, normalized to unit sum.34
The slowing ratio calculated using Equation (1), which quantifies the pathological frequency shifts characteristic of cognitive decline.8
- Mobility Domain (EMG): Average power (window RMS) and mobility characterizing muscle activity patterns are calculated as in Equations (2 and 3)35,36:
Cardiac Domain (ECG)
Heart rate and variability were extracted from R-peak intervals detected with amplitude (0.5σECG) and refractory (0.5s minimum interval) constraints, which were analyzed as in Eqs.(4)-(5)11,13:
- Ocular Domain (EOG): As a measure of cognitive alertness, blink rate was calculated using threshold crossings at 1.5σEOG, normalized to events per minute.
Intersignal correlation matrices and derived graph metrics (network density and clustering coefficient) are additional exploratory features. However, they were not included in the final transmission set, because they showed high population variability (CV>0.4) in the asynchronous dataset.
To ensure cross-subject robustness without individual calibration, the CAFE uses a two-stage selection process.
First, for stability filtering, for each candidate feature i across N windows, the Coefficient of Variation (CV) was computed as in Equation (6):
Features with CV < 0.2 are retained as population-stable. This threshold through empirical observation identified features with steady behavior across heterogeneous subjects (e.g., EMG mobility CV=0.083, beta power CV=0.117, HR CV=0.165), while excluding highly variable metrics unsuitable for unsupervised deployment (e.g., HRV CV=0.392, graph-based coupling CV>0.4).
Second, The Discriminative Ratio (DR), which quantifies the separation between risk classes, was calculated using Equation (7):
The features are ranked by Si in descending order. The top F features allowed by the current bandwidth budget were selected for transmission. This procedure identified a 5-feature CAFE set: EMG power, EMG mobility, EMG asymmetry, heart rate, and EEG slowing ratio.
In addition, inter-modal coupling features were computed in this framework (EEG-EMG correlation, EEG-ECG coherence, and graph density/clustering), which exhibited high instability (CV > 0.4) in the asynchronous multi-subject dataset and were excluded from validation on synchronized, same-subject recordings.
In this study, unsupervised event detection was implemented using two types: established medical thresholds (e.g., normal HR range) or percentiles calculated from the study population, which means that the method works immediately for any new patients without requiring days to acquire individual baseline measurements. And the detection criteria used in this work are cardiac events. First, it applies standard clinical ranges: HR outside [50, 100] bpm or HRV < 20 ms. If more than 50% of windows are flagged (indicating the population may not match standard ranges), then it reverts to data-driven thresholds: HR below the 10th percentile, above the 90th percentile, or HRV below the 20th percentile.
Cognitive events: Windows where SR exceeds the 80th percentile of the observed population distribution are flagged.
Priority scoring: Each window receives a composite risk score:
The CAFE adjusts the transmitted feature count based on the available network capacity. Using 32-bit encoding and =4-second windows, the bitrate for F features is calculated as in Equation (10):
A three-level adaptation policy was implemented as in Equation (11):
The features are transmitted in descending order by the stability score Si ( Equation 8), prioritizing the most informative descriptors. This yields: 0.5 kbps for three features (HR, P_EMG, SR) at 0.024 kbps, 1.0 kbps for four features (+EMG mobility) at 0.032 kbps. If ≥2.0 kbps then five features will be transmitted (+asymmetry) at 0.040 kbps.
The 5-feature cap leaves >99% of bandwidth available to concurrent patients at typical link capacities (5-10 kbps).
For the analysis of the economic impact, the daily data volume and yearly cost per patient were calculated using Eqs.(12)-(13):
where is sec/day, 1024 Bytes/MB, and c is the data tariff. At c=$0.10/MB, CAFE (F=5, Dday=0.412 MB) versus Statistical baseline (F=8, Dday=0.659 MB) saves $9.02 annually per patient. Protocol overhead may increase absolute volumes by 20-50%
The framework tested CAFE on 187 labeled activity recordings (57 fall risk, 130 normal), each 4-s long.
For detection accuracy, five EMG features were extracted: power, mobility, asymmetry, jerkiness, and coupling. Only the first three were transmitted (to save bandwidth), while the last two were computed locally to improve detection. then combined all five into a risk score, optimized the weights, and evaluated the ability of the CAFE to detect fall-risk activities (sensitivity, specificity, F1-score). For the bandwidth comparison, four methods were compared for the same 187 recordings. Both methods extract different types of features, compute a risk score, and choose an optimal threshold, all on the same test data, to be fairly compared to each other, as shown in Table 2.
For performance metrics; detection was summarized using sensitivity (recall), specificity, precision, and F1-score (F1 = 2·precision·recall/ (precision+recall)). The AUC (area under the ROC curve (AUC) was then reported for the binary fall risk task. The bandwidth was reported in kbps, and the statistical baseline included the median absolute deviation (MAD) among its eight descriptors. Thresholds were tuned by a grid search on a held-out validation set, and uncertainty was quantified by bootstrap resampling (n = 1,000).
To measure the detection accuracy: (F1-score), bandwidth used (kbps), and efficiency (F1-score per kbps). Bootstrap resampling for 1000 iterations tested whether the F1-score differences between CAFE and Statistical method were statistically significant or just random variation. The frequency method was excluded because it requires synchronization of multimodal signals from the same person; our dataset has signals from different people.
A heterogeneous dataset with 163 participants (128 EEG contributors and 35 EMG/ECG/EOG contributors) was analyzed to provide key insights for implementing deployment in a variety of elderly populations without any calibration. The windows used were 4-s with 50% overlap, which resulted in 77 multimodal windows to be used to determine the initial features and evaluate stability. Feature analysis of 77 windows of 163 heterogeneous subjects showed three stability tiers, as shown in Figure 3. EMG was found to have high stability (CV < 0.20), mobility (CV=0.083), EEG beta power (CV=0.117), and HR (CV=0.165), taking on a similar cross-subject behavior. Intermediate-stability features EEG slowing ratio, theta, and alpha power were added to (CV 0.28-0.33). The high-variability characteristics (CV= 0.35) encompassed HRV (CV=0.392), EMG power (CV=0.339), and delta power, as shown in Table 3. Interestingly, highly variable features displayed better discriminative power. The highest discriminative ratio (39.154) was obtained for heart rate, followed by blink rate (27.947), and HRV (25.659), as shown in Figure 3 Panel c. This is because inter-subject differences in baseline do not rule out the possibility of consistent within-subject responses to risk conditions. HRV is a mixed phenomenon, depending on individuals, although change is predictable in individuals when there are risk occurrences. These results support the 5-feature transmission set of CAFE: stable enough to calibrate free deployment but discriminative to detect graph-based coupling features (CV > 0.4) have been filtered off because they are unstable in asynchronous multisubject data.
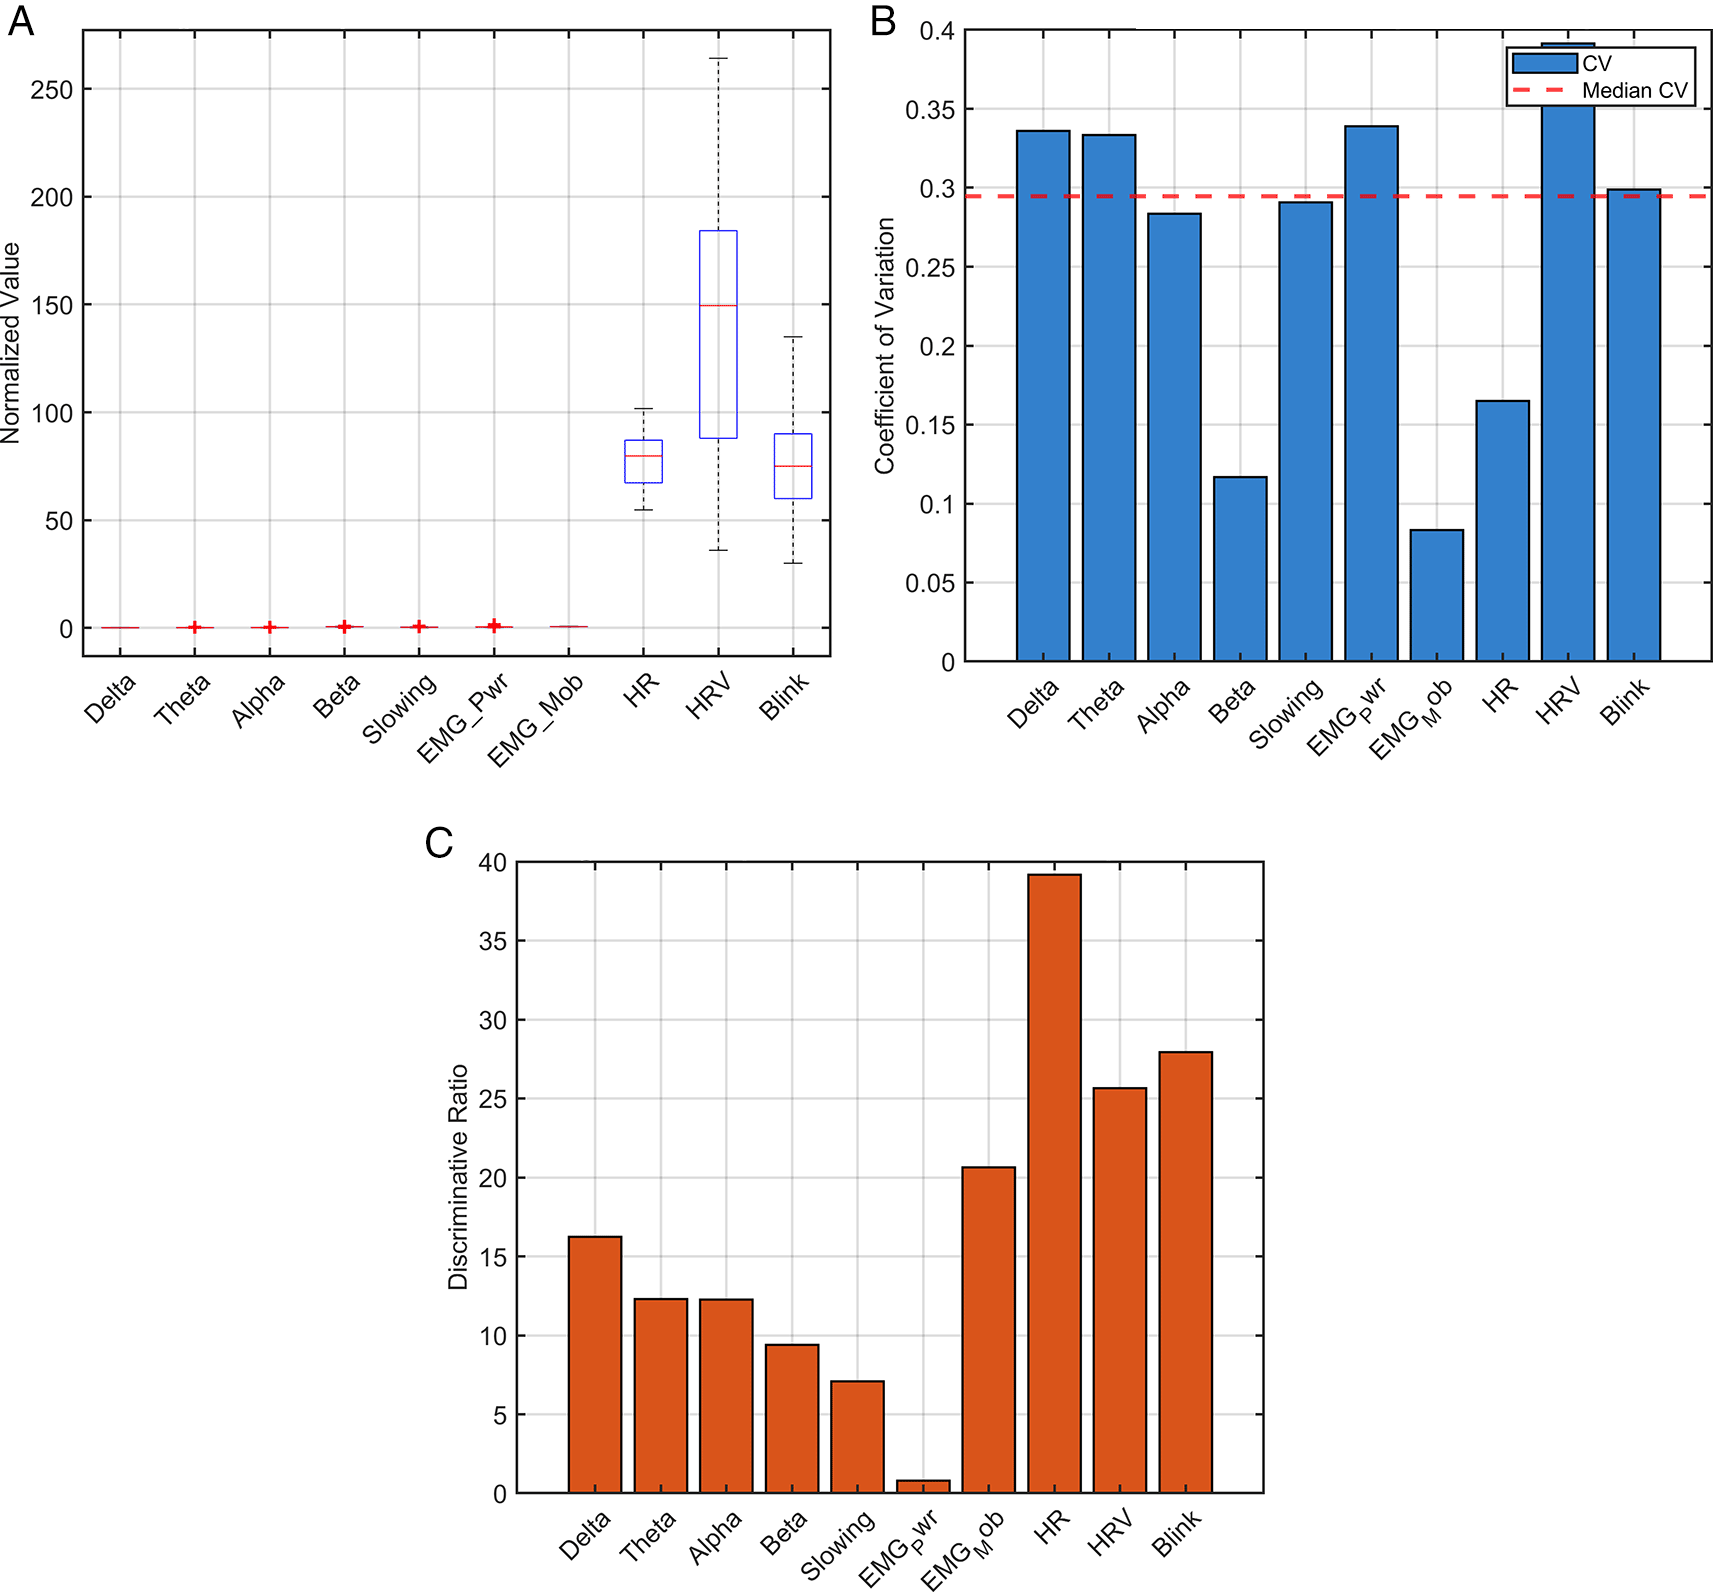
(A) Distributions (boxplots) of key features (e.g., heart rate, HRV, EEG slowing ratio, EMG power) across subjects.
(B) Feature stability quantified by the coefficient of variation (CV), where lower CV indicates greater cross-subject stability.
(C) Discriminative ratio (between-class variance divided by within-class variance) indicating separation power between risk and normal windows.
Figure 3 shows the population-level feature analysis of, the 77 multimodal windows. (a) Boxplot distributions showing normalized values for heart rate (HR), heart rate variability (HRV), EEG slowing ratio, and EMG power across the heterogeneous population. (b) Feature stability measured by the coefficient of variation (CV), with median CV=0.295, indicated by the red dashed line. A lower CV indicates better cross-subject consistency. (c) Discriminative ratios quantifying each feature's ability to distinguish between risk states, calculated as between-class variance divided by within-class variance.
The evaluation protocol ensured fair comparison across the methods. All approaches were tested on identical 4-s windows with 50% overlap. detection thresholds were optimized via grid search on a held-out validation set (20% of subjects). Statistical comparisons were performed using bootstrap resampling (n = 1,000) with stratified sampling by class label to maintain a balanced representation.
Independent validation using 187 labeled EMG windows (57 fall risk, 130 normal) compared CAFE with established feature extraction methods. All methods were evaluated on identical windows using the same optimization protocol: the transmitted features were mapped to scalar risk scores via weighted summation with tuned thresholds.
CAFE scored 70.8% F1 on five features transmitted at 0.040 kbps, which was not statistically significantly different from the 69.8% F1 of the Statistical method with eight features transmitted at 0.064 kbps, as shown in Table 4. All 1000 iterations of bootstrap resampling showed a difference of 0.93 percentage points (95% CI:[-4.51, 6.43], p=0.393), which was not significant. This shows that the reduction of features by 37.5 percent does not impair clinical efficacy and significantly minimizes transmission requirements.
| Method | Features | Processing Time (s)a | Bitrate (kbps) | F1 Score (%) | F1/kbps | F1/s |
|---|---|---|---|---|---|---|
| CAFE | 5 | 0.089 | 0.040 | 70.8 | 1769 | 798 |
| Statistical | 8 | 0.236 | 0.064 | 69.8 | 1091 | 296 |
| Wavelet | 7 | 0.264 | 0.056 | 46.1 | 823 | 175 |
| Entropy | 2 | 0.039 | 0.016 | 46.1 | 2881 | 1197 |
The low effectiveness of wavelet (46.1%) and entropy (46.1%) algorithms is due to their use of frequency decomposition and statistical parameters that are incapable of capturing the time-dependent variation that is essential in fall detection. These techniques encode signal data using spectral coefficients or entropy values, discarding the temporal patterns used to differentiate between fall risk and normal events.
The Wavelet and Entropy methods were not successful in this study because there were basic differences in the design and requirements of the detection task. Wavelet Transform records the change in frequencies on the time scales but fails to capture fine-temporal dynamics that are critical in identifying brief events such as falls that are usually less than 2 s in duration and shorter than the 4-second analysis window. Similarly, Entropy-based features are sensitive to noise and window length, which causes instability in real-time monitoring. In contrast, CAFE chose time-domain and physiological characteristics (EMG power, mobility, asymmetry, heart rate, and EEG slowing ratio) that directly capture the rapid transients of elderly health events, such as fall-related muscle bursts.
Although the Entropy technique has better in bandwidth efficiency (2881 F1/kbps) because it does not transmit many features, its absolute F1 value of 46.1% is lower than the clinical acceptability levels of fall detectors. This reflects the essential difference between efficiency measures and clinical usefulness, with bandwidth optimization detrimental to clinical utility. The best balance is obtained by CAFE: 62 percent higher bandwidth efficiency than statistical (1769 vs 1091 F1/kbps) and clinical accuracy, as shown in Figure 4.
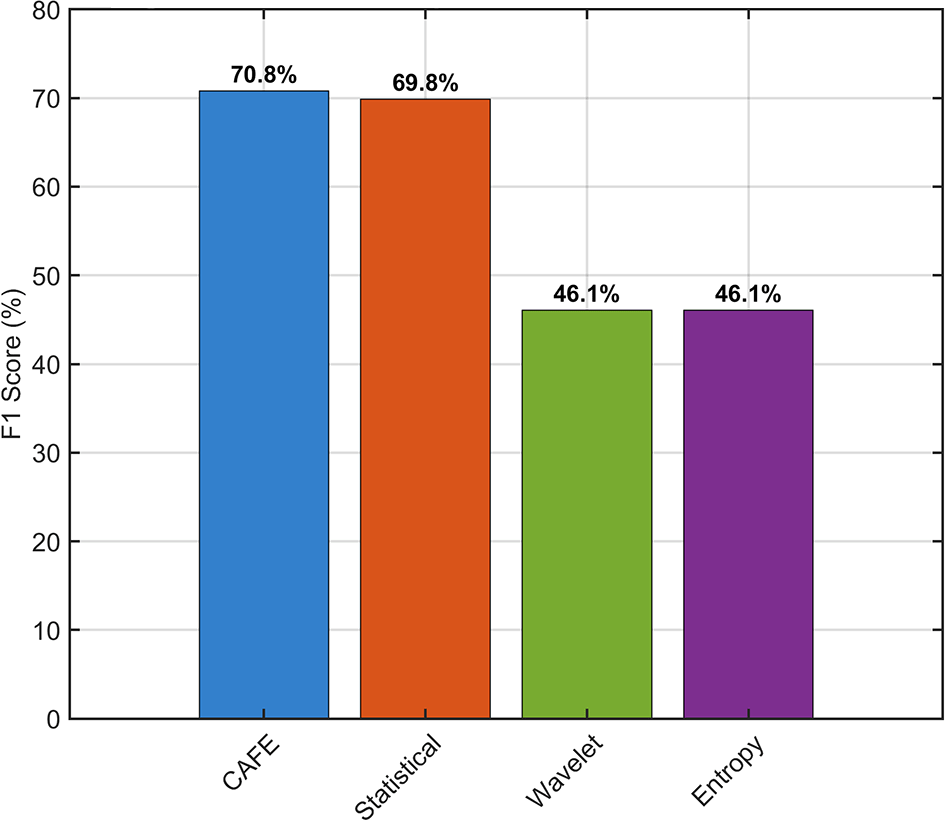
F1 scores showing CAFE (70.8%) and Statistical (69.8%) methods substantially outperforming Wavelet and Entropy approaches (both 46.1%).
The total computation time of the test batch with a 187-window test was the processing time; the common variation between the test runs was ±15 percent, with a load on the system. F1 scores were fixed random variables. The Frequency method was excluded because of its incompatibility with asynchronous multi-subject data. The performance of the comparative method showing CAFE (70.8%) and statistical (69.8%) substantially outperformed Wavelet and Entropy approaches (both 46.1%). Bootstrap resampling (n=1000) confirmed CAFE and Statistical methods were not statistically significantly different (ΔF1=0.93 pp, 95% CI [-4.51, 6.43], p=0.393), which indicates that 37.5% reduction in features does not affect the accuracy of detection, but the transmission requirements are significantly decreased.
In addition to the bandwidth efficiency comparison discussed above, CAFE's clinical detection capability of CAFE was proved through the binary fall risk classification on the same 187 labeled EMG windows. Activities were grouped into fall-risk (bowing, jumping, running) versus normal (sitting, standing, walking), achieving F1 = 57.8%, sensitivity = 64.9%, specificity = 73.8%, AUC = 0.70, as shown in Figure 5. This binary classification result differs from the composite scoring F1 (70.8%) reported in Table 4 because they measure different assignments; binary classification evaluates a single clinical detection problem with ground truth labels, whereas combined scoring integrates all five features to compare bandwidth efficiency across all methods.
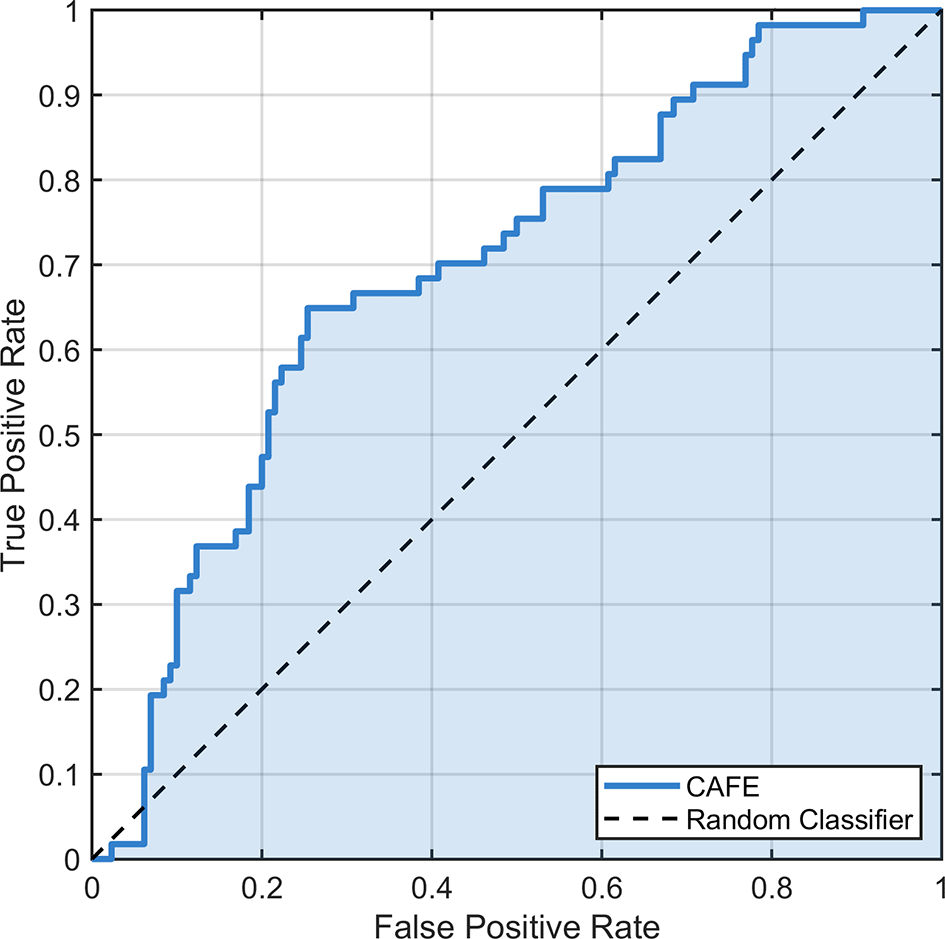
(AUC) = 0.70.
To determine the framework for multi-domain monitoring beyond the fall risk, a separate dataset of 77 multimodal windows (EEG, ECG, and EMG from different subjects) was analyzed using population adaptive thresholds. CAFE detected 32 events across three health domains, as shown in Table 5: five cardiac events (6.5%, HR <50 or >100 bpm), 15 cognitive events (19.5%, EEG slowing >80th percentile), and 12 fall-risk events (15.6%, EMG power >85th percentile). Only fall risk detection has been validated against ground truth labels; cardiac and cognitive detection uses clinically established thresholds, but requires future validation with labeled datasets such as the MIT-BIH arrhythmia database and standardized cognitive assessments.
To our knowledge, CAFE is the first framework that explicitly optimizes bandwidth (0.040 kbps, 37.5% reduction) and simultaneously monitors three health domains across 163 subjects without requiring individual calibration. Table 4 shows that CAFE allows deployment in bandwidth-constrained environments, such as emergency response scenarios and rural clinics, while maintaining no statistically significant difference from higher bitrate techniques (p=0.393). In addition, the direct comparison is limited because prior works report accuracy, whereas CAFE reports the F1-score, a stricter metric that accounts for class imbalance. The comparison with specific researches is summarized in Table 6.
| Framework | Year | Primary Focus | Metric | Key Metrics | Bandwidth Reported |
|---|---|---|---|---|---|
| Chen et al.2 | 2018 | Edge cognitive computing | - | Resource allocation | No |
| Alshuhail et al.3 | 2025 | Real-time edge AI for cardiac + fall | Accuracy | 95.4% | No |
| Oladunni & Wong21 | 2025 | Multimodal ECG feature fusion (complementarity) | Accuracy | 96% | No |
| CAFE (This work) | 2025 | Bandwidth-optimized multi-domain monitoring | F1-score | 70.8% | Yes (0.040 kbps, 37.5% reduction) |
Method comparison of 187 labeled EMG windows. Processing time refers to the total computation for the full test batch. F1/kbps measures the bandwidth efficiency (higher is better), and F1/s measures the computational efficiency of CAFE's adaptive transmission mechanism using the rate model in Equations (10)– (11), it responds dynamically to the available bandwidth, enabling deployment within heterogeneous network conditions from urban 5G to rural 2G connections. Figure 6 shows this adaptability through feature scaling and performance under the bandwidth constraint.
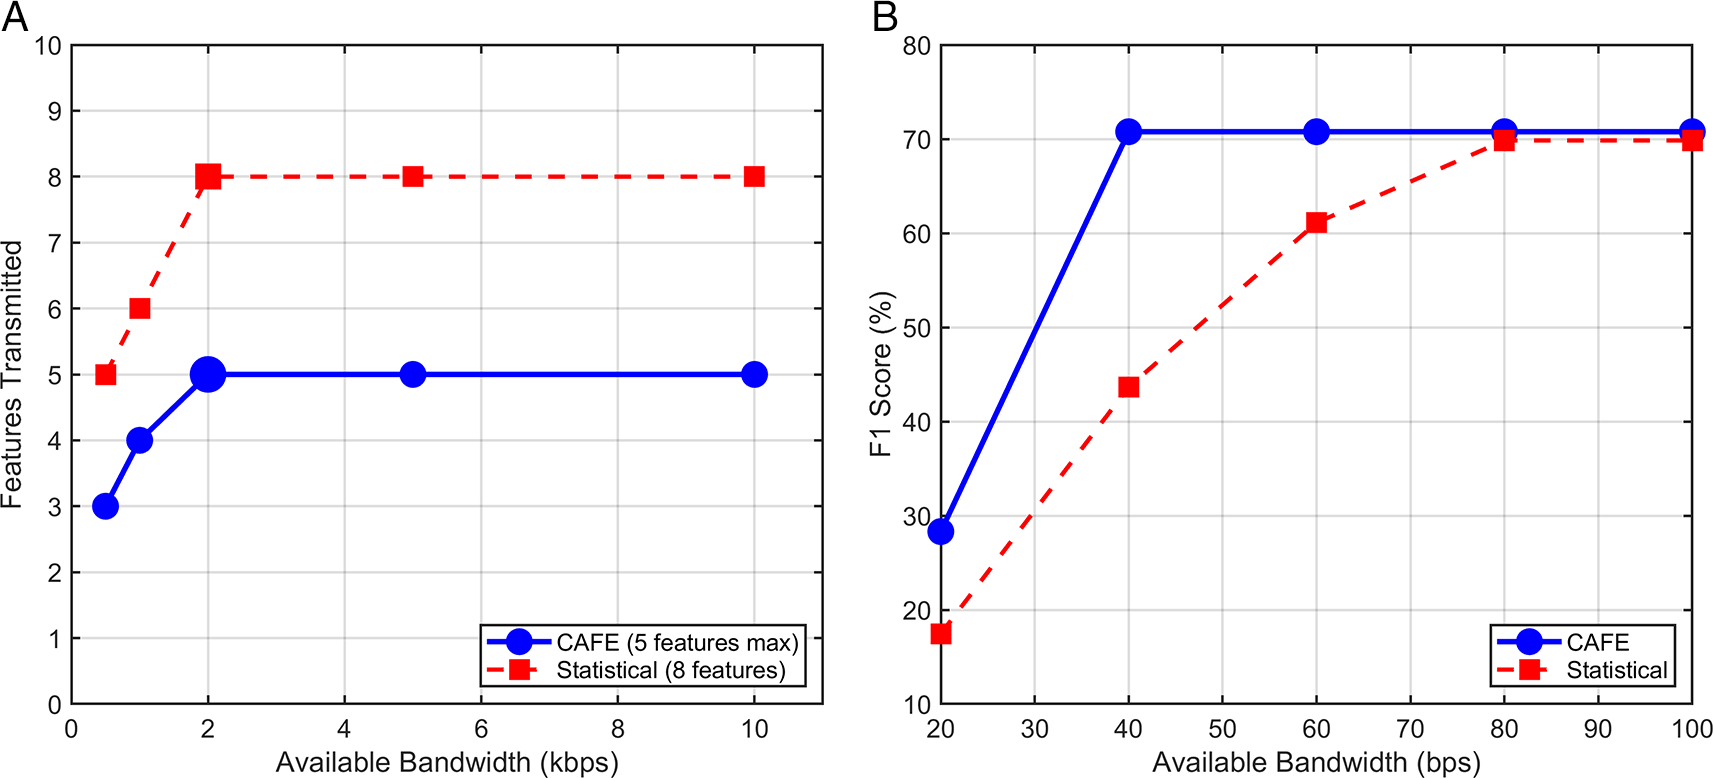
Figure 6 -panel (a) shows CAFE grading from the 3 essential features (HR, EMG power, EEG slowing) at 0.5 kbps to all 5-feature set at Bavail ≥2.0 kbps, compared to the Statistical baseline's fixed 8-feature requirement. The Table 7 describes this adaptation: at minimal bandwidth (0.5 kbps), CAFE transmits only the three features with highest stability and discriminative power, maintaining core detection capability at 0.024 kbps (4.8% utilization). Then when bandwidth increases, CAFE adds complementary features (EMG mobility at 1.0 kbps, asymmetry at 2.0 kbps) to achieve its full detection performance of 70.8% F1 at 0.040 kbps.
Then in Figure 6, panel(b) shows the robustness of CAFE when the bandwidth falls below the design specifications. At CAFE's operating point of 40 bits per second, it will achieve the full detection performance (70.8% F1), while the statistical method forced to operate below its 64-bps requirement that’s leads to degradation to approximately 44% F1 as a result of insufficient bandwidth for its eight feature transmissions. The Statistical method requires approximately 80 bps (double the CAFE requirement) to recover a comparable detection performance. This 2× bandwidth advantage is critical for employment in bandwidth-limited situations, such as intermittent satellite links, congested emergency networks, or rural 2G infrastructure operating near capacity.
And to analyze the capacity and economic implications, a bandwidth reduction 37.5% and a single 2G gateway with 9.6 kbps bandwidth with 0.040 kbps per patient then it can support 240 CAFE patients against 150 using statistical methods that support 60% more patients per gateway due to CAFE's lower 0.040 kbps per patient requirement. Using the daily data model as calculated in Equations (12) and (13), CAFE achieved 0.412 MB/day versus 0.659 MB/day for Statistical baseline. In rural data pricing (c=$0.10/MB), this yields $9.02 annual savings per patient or $902 for a 100-patient clinic, while reducing the infrastructure requirements by one gateway for 300 patients.
The main limitations can be summarized after the results analysis as: First, there was only mobility detection tested on ground-truth activity labels; cardiac (6.5% event rate) and cognitive monitoring (19.5% event rate) are still exploratory with population-adaptive thresholds. Second, the subjects and the sessions were different (asynchronous) MU data, which does not allow inter-modal coupling analysis to be performed reliably. Graph-based and coherence features were highly unstable when (CV>0.4) and under these conditions can be useful in simultaneous same-subject recordings. Third, validation used controlled activity classifications (bowing, jumping, sitting, etc.) rather than real-world fall events. Fourth, the thresholds were optimized in the test corpus and external testing was required. Finally, overheads in network protocols and packet loss robustness were not empirically tested. The practical implication of the framework is in aspects such as Iraq, where both represent data and monitoring infrastructure that can be constrained by a stimulus and an obstacle to this work. The low-bandwidth delivery-specific requirements of CAFE (0.040 kbps) were created within these resource-constrained environments. Nevertheless, externally validated living with locally gathered datasets or pilot studies in Iraqi evidence would be reinforced by the applicability of healthcare facilities.
This study introduced CAFE, which is a bandwidth-efficient structure for multi-domain elderly health monitoring. The method scored 70.8% F1-score and also reduced transmission by 37.5% over an 8-feature baseline, and cross-subject generalization in 163 heterogeneous subjects without subject-specific calibration. The difference from statistical baseline was non-significant on labeled EMG windows (ΔF1 = 0.93 percentage points; 95% CI[-4.51, 6.43]; p = 0.393) and bandwidth reduction did not affect detection performance in detection.
These findings indicate the possibility of efficient multi-domain monitoring, even in bandwidth-constrained rural and resource-limited environments. The feature selection method provides effective advice on the design of systems with a trade-off between detection and communication costs, and the adaptive transmission mechanism facilitates smooth performance in the presence of variable connectivity.
The present limitations are that validation with larger clinical datasets and usability testing in areas with limited infrastructure are required. Further work will involve the integration of more physiological indicators, deployment-based adaptive learning of threshold data, and pilot studies on resource-constrained environments.
| Views | Downloads | |
|---|---|---|
| F1000Research | - | - |
|
PubMed Central
Data from PMC are received and updated monthly.
|
- | - |
Provide sufficient details of any financial or non-financial competing interests to enable users to assess whether your comments might lead a reasonable person to question your impartiality. Consider the following examples, but note that this is not an exhaustive list:
Sign up for content alerts and receive a weekly or monthly email with all newly published articles
Already registered? Sign in
The email address should be the one you originally registered with F1000.
You registered with F1000 via Google, so we cannot reset your password.
To sign in, please click here.
If you still need help with your Google account password, please click here.
You registered with F1000 via Facebook, so we cannot reset your password.
To sign in, please click here.
If you still need help with your Facebook account password, please click here.
If your email address is registered with us, we will email you instructions to reset your password.
If you think you should have received this email but it has not arrived, please check your spam filters and/or contact for further assistance.
Comments on this article Comments (0)