Keywords
Cobalt (II)ion, Spectrophotometry, Turbidity, Flow injection analysis & Sodium nitroprusside
This article is included in the Fallujah Multidisciplinary Science and Innovation gateway.
Cobalt (II)ion, Spectrophotometry, Turbidity, Flow injection analysis & Sodium nitroprusside
Cobalt is a transition metal that belongs to the Earth’s crust and is widely used in many fields, including technology, energy and medicine.1 It is not normally found free of its combination with other elements as a metal, but it is bound in ores usually mixed with nickel and copper.2 In 2020, cobalt was still significantly important in the manufacturing of lithium-ion batteries for electric vehicle.3 In 2021, the demand for cobalt continues and is steered towards green energy applications, most notably in renewable energy system including windmills and solar cells.4 These industries require cobalt-based superalloys, magnets and other crucial materials for maximum operability.5 Ongoing research and development efforts have directed toward searching for alternatives or reducing the cobalt content in battery systems. These improvements have been focused on improving the battery performance and reducing the dependence on cobalt because of fluctuations in the market price.6 By 2022, battery development, (concentrating on no only lowering but also potentially eliminating cobalt) and improved energy density and performance have been targeted via solid-state and other alternative chemistries advances.7 Currently, cobalt is used in various industrial applications, including magnetic alloys,8–10 catalysts11–13 as well as high-strength alloy selections for aviation.14 In medicine, Co-60 is a radioactive isotope of cobalt used for medical therapies and sterilization of hospital instruments.15
Several methods based on continuous flow injection analysis (FIA) have been described for the determination of various species16–19 and cobalt (II) ions along with different types techniques like Turbidimetric continuous flow injection analysis,20–22 spectrophotometry,23 Reversed Flow Injection Spectrophotometry,24 Microexraction-spectrophotometry25 chemiluminescence26 and high-performance liquid chromatography (HPLC).27 The Flow Injection Analysis (FIA) is a versatile and powerful analytical technique, used for chemical analysis and process monitoring. The FIA approach includes a determination method in which the sample is introduced continuously into an on-line carrier stream that carries the sample to a detector for such analysis. The rapid analytical speed, low reagent consumption, and high degree of automation are some of the unique features of this method. FIA is suitable for a variety of chemical measurements such as spectrophotometry, fluorometry and electrochemistry.16–19
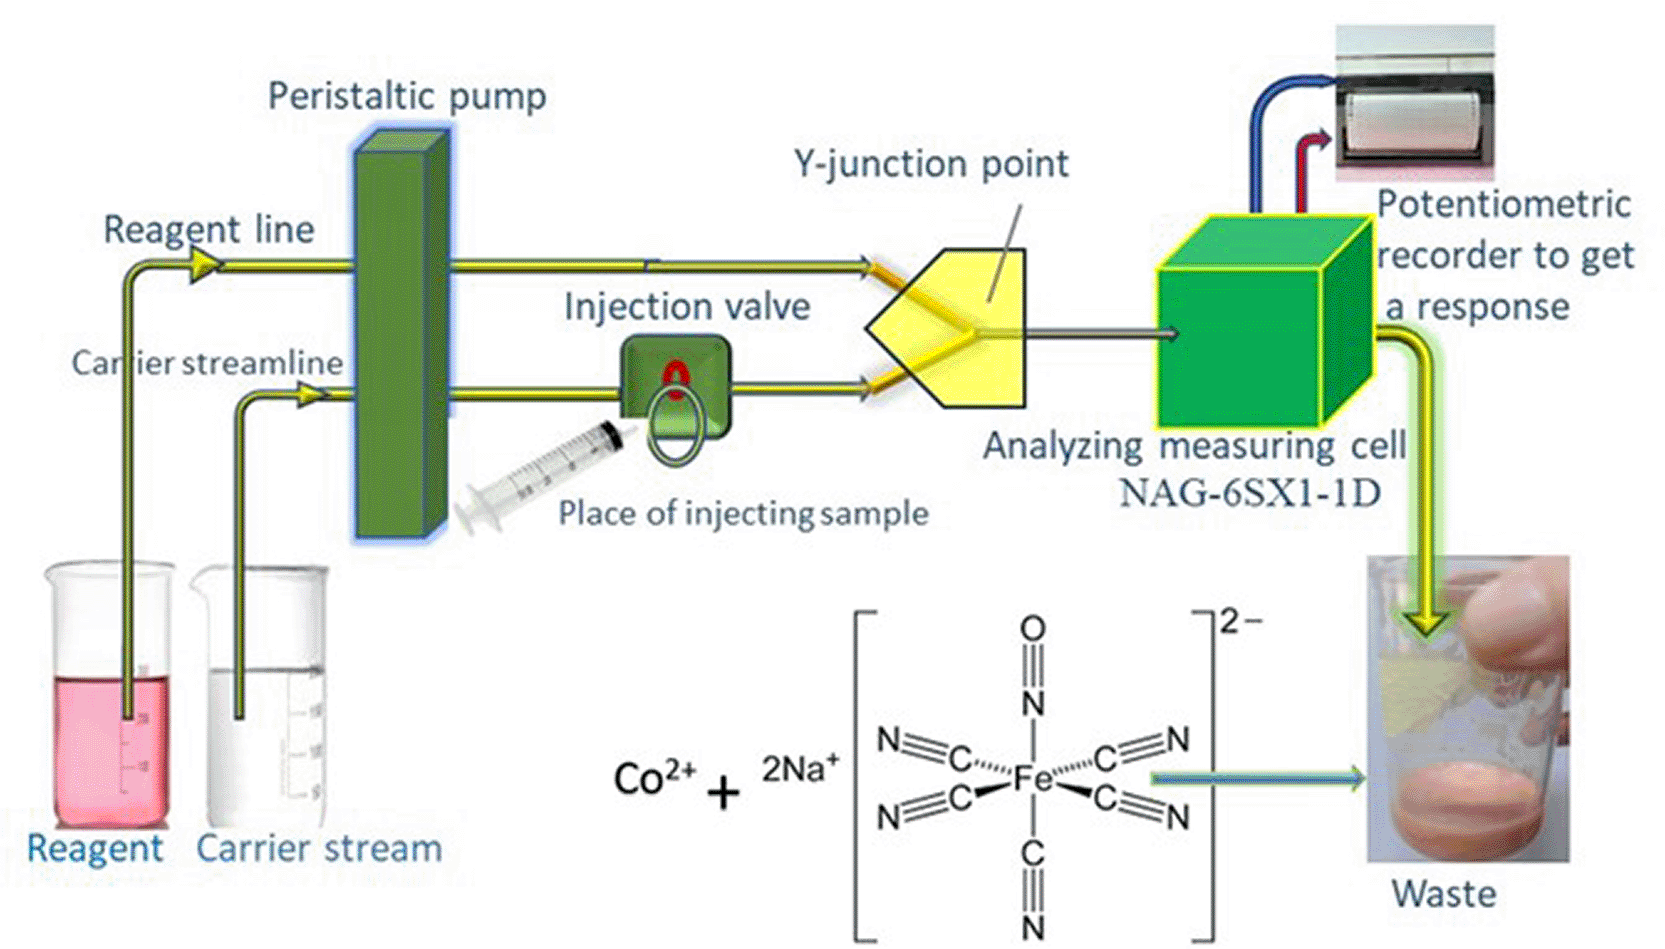
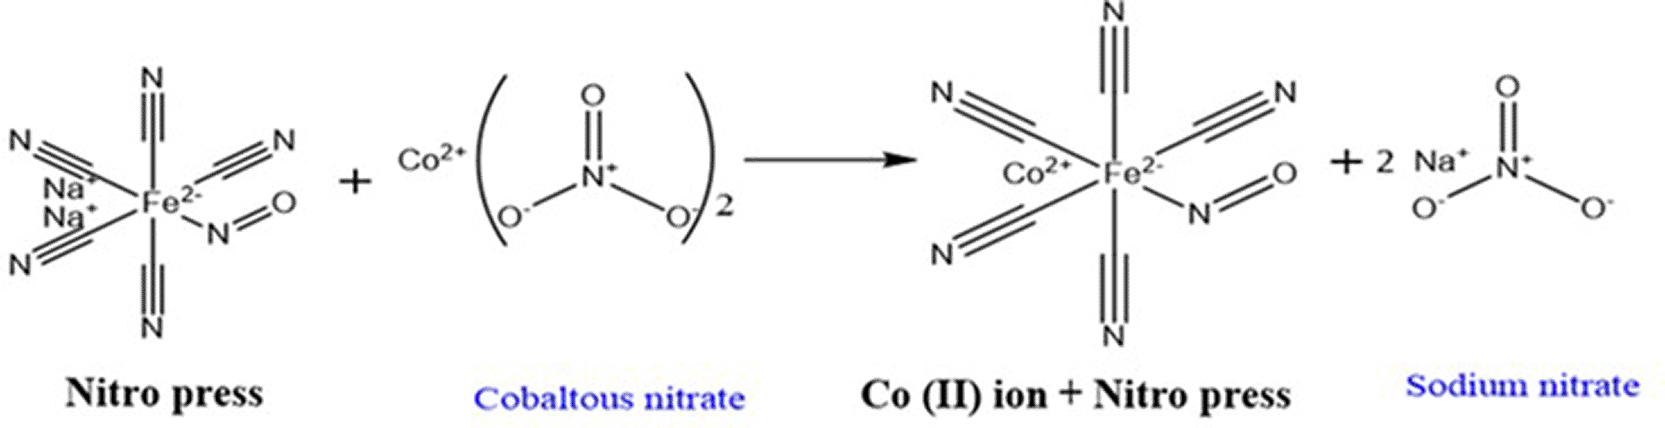
In this study, the precipitation of cobalt (II) ions was achieved using a new precipitating agent sodium nitroprusside (SNP) and reported as nitro press. This method was utilized to determine the concentrations of Co (II) ions in pure samples and alloys using a newly developed instrument (NAG-6SX1-1D Analyzer28), which was home-made as shown in Figure 1. Cobalt (II) quantification was performed using this approach based on the amount of transmitted light that passed through the turbid solution. Alternatively, another procedure was carried out in which the above reaction was performed using conventional analytical techniques such as UV-spectrophotometry (λ = 512 nm). Statistical tools were used to compare the obtained results. The instrument is simple to use, has high sensitivity low detection limit as well as excellent reproducibility of the obtained results. The main goal of this research is to introduce a feasible alternative to the traditional techniques so that high accuracy and computational efficiency can be maintained.
Cobaltous nitrate and nitro press (chemical formula Na2[Fe (CN)5NO]. 2H2O), of analytical grade from Merck, and their solutions were prepared in distilled water. A 20 mmol. L−1 Co (NO3)2.6H2O standard solution was added with a molecular weight of 291.04 g. mol−1: 1.455 g was dissolved in distilled water from BDH up to a total volume of 250 mL. Additionally, a standard nitro press solution (50 mmol. L−1) was added, with a molecular weight of 298.0 g. mol−1 from BDH was synthesized by dissolving 3.725 g of nitro press in 250 mL of distilled water. A sequence of nitro press (Fluka) solutions was synthesized by diluting a standard solution at a concentration of 50 mM with deionized water. Three alloy samples were prepared for the research using high-purity iron (B.C.S.NO.260/2), high-purity iron granules (B.C.S.NO.149/2), and high-purity copper (B.C.S.NO.197e). Fifteen grams of each alloy was accurately weighed and transferred into a 400 ml beaker, followed by the introduction of a 1:1 mixture of HCl and HNO3, which was then gently heated while maintaining constant agitation until all brown fumes had dissipated. The resulting solution was diluted to a final volume of 100 ml. The filtrate was collected after washing the filter paper multiple times, and the solution was transferred into a volumetric flask with a capacity of 100 ml. The flask was filled to the calibrated mark, and a series of diluted solutions were prepared.
In the Fourier Transform Infrared (shortened in FTIR) spectrum of the product Co (II)–nitroprusside their spectral features changed systematically with respect to free sodium nitroprusside, corroborating on-site molecular interactions and coordination between Co2+ ions and the nitroprusside ligand. As shown in Figure 2, the wide band between 3890 and 3430 cm−1, assigned to O–H stretching modes, was also over-toned by intense and distorted bands in the product probably owing to hydrogen bonding by coordinated or lattice water molecules within the newly formed precipitate. The swelling of the slab is a sign of hydration and structural change during complex formation.
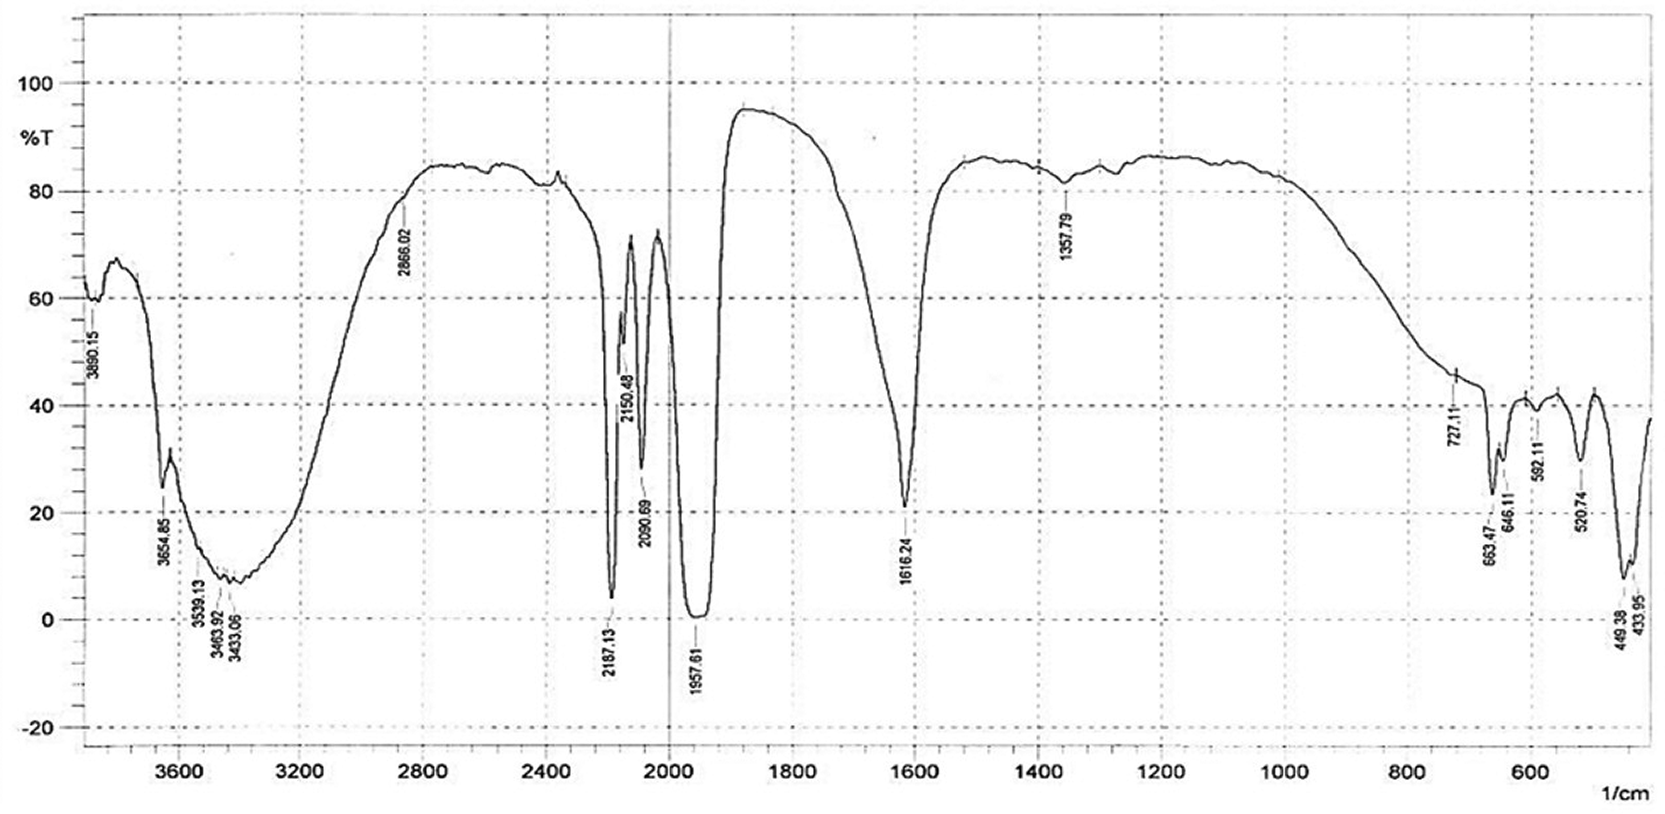
The ν(C ≡ N) stretching vibrations of nitroprusside, which are typically observed as sharp single bands at ~2200 cm−1, were present in the product as multiple bands at 2187, 2150 and 2090 cm−1; a lower frequency component was also apparent at 1957 cm−1. This splitting and low energy shift of the cyanide ion reflects electron density redistribution across the Fe–C ≡ N motif upon coordination of Co2+ via a cyanide nitrogen. Such spectral shifts are characteristic of the creation of a bridging Co–NC–Fe bonds, indicating the conversion from free nitroprusside to a bimetallic complex.
The nitrosyl stretching vibration at around 1930–1940 cm−1 in free (uncomplexed) nitroprusside, shifted significantly to 1616 cm−1 in the product spectrum. Such a large shift indicates that there is also a pronounced structural rearrangement of the Fe–NO electronic environment due to coordination-induced back-bonding effects. This is a well-known feature of metal–nitroprusside complexation and supports the presence of Co (II)–nitroprusside formation. The bands related to CN/NO bending and Fe–C/Co–N mode skeletal deformation in the range of 1357 cm−1 and 520–320 cm−1 became broader in the complex spectra. This widening indicates enhanced molecular distortion and rearrangement in the Co2+ − coordinated CN/N2O framework.
In addition, no new functional groups were observed in the IR spectrum, suggesting that the formation of Co (II)–nitroprusside precipitate is not associated with a chemical breakdown or covalent alteration of the nitroprusside moiety, but rather with non-covalent and coordination bonding mainly through metal-ligand bonding by cyanide nitrogen. The retention of basic bands of cyanide and nitrosyl indicates that the core of Fe (CN)5NO is structurally preserved in the synthesized complex.
UV-Vis spectroscopy was used to examine the electronic effects and structural changes during the formation of cobalt–nitroprusside precipitates. The resulting solid precipitate from the reaction of cobalt nitrate with sodium nitroprusside was separated, washed with water to remove any soluble nitrates, and sonicated for spectrophotometric studies after dissolving the precipitate particles in dimethylformamide (DMF). UV–Vis studies were carried out to monitor the electronic transitions associated with the Fe–CN skeleton and the coordination environment of Co2+ during cyanide-bridged complexation.
The recorded spectrum ( Figure 3) had a strong absorption at the near-UV path (280 ∼ 310 nm wavelength), with the intensity maximum located around 295–300 nm. This is a typical feature of ligand-to-metal charge transfer (LMCT) transitions from cyanide and nitrosyl ligands to the iron center of the nitroprusside moiety. The high-energy and narrow width of this band demonstrates the generation of a novel electronic structure produced by the incorporation of Co2+ ions into the Fe–CN coordination network.
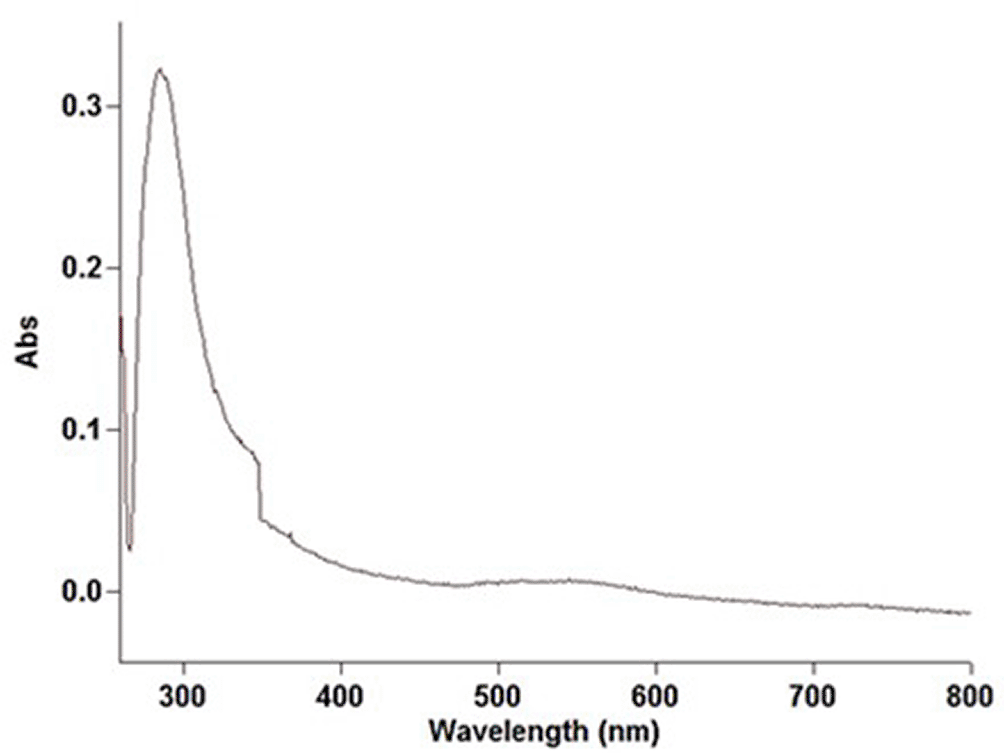
In addition to the main LMCT band, the spectrum clearly shows a featureless absorbance decrease between 330 and 380 nm with a shoulder at this wavelength. This was due to perturbations involving intra-ligand (π → π*) transitions of the coordinated nitrosyl group. These perturbations result from changes in the electron density across the Fe–NO bond upon Co2+ binding, suggesting partial charge redistribution and strengthening of the Fe–CN–Co bridging interaction. The existence of this band supports the evidence of a cyanide-mediated coupling between Fe2+ and Co2+, as previously suggested by the mechanism.
Above 400 nm, there is a very broad and weak tail that extends to at least 550–600 nm. Free hexaaquacobalt (II) ions normally show sharp d–d transitions in this region ; however, the near-absence of these bands in the current spectrum suggests that Co2+ no longer exists as an aqua-coordinated octahedral species. Instead, its electronic transitions are Laporte-forbidden and highly attenuated upon coordination with cyanides. The fact that no distinct visible-region absorptions were observed further supports the formation of a cyanide-bridged Fe–CN–Co complex and not just an ionic mixture of reactants.
The spectral features including the strong charge-transfer band and the absence of cobalt d–d bands are in good agreement with the proposed scheme where Co2+ replaces sodium counter ions and forms an inner-sphere complex with nitroprusside. The related structural motif Fe–CN–Co induces a modified electronic environment, which gives rise to the characteristic Fe3+ UV–Vis fingerprint. Considering the spectroscopic results, the obtained experimental evidence unambiguously confirms the successful precipitation of cobalt–nitroprusside and verifies that the structural rearrangement proposed in the reaction scheme occurs.
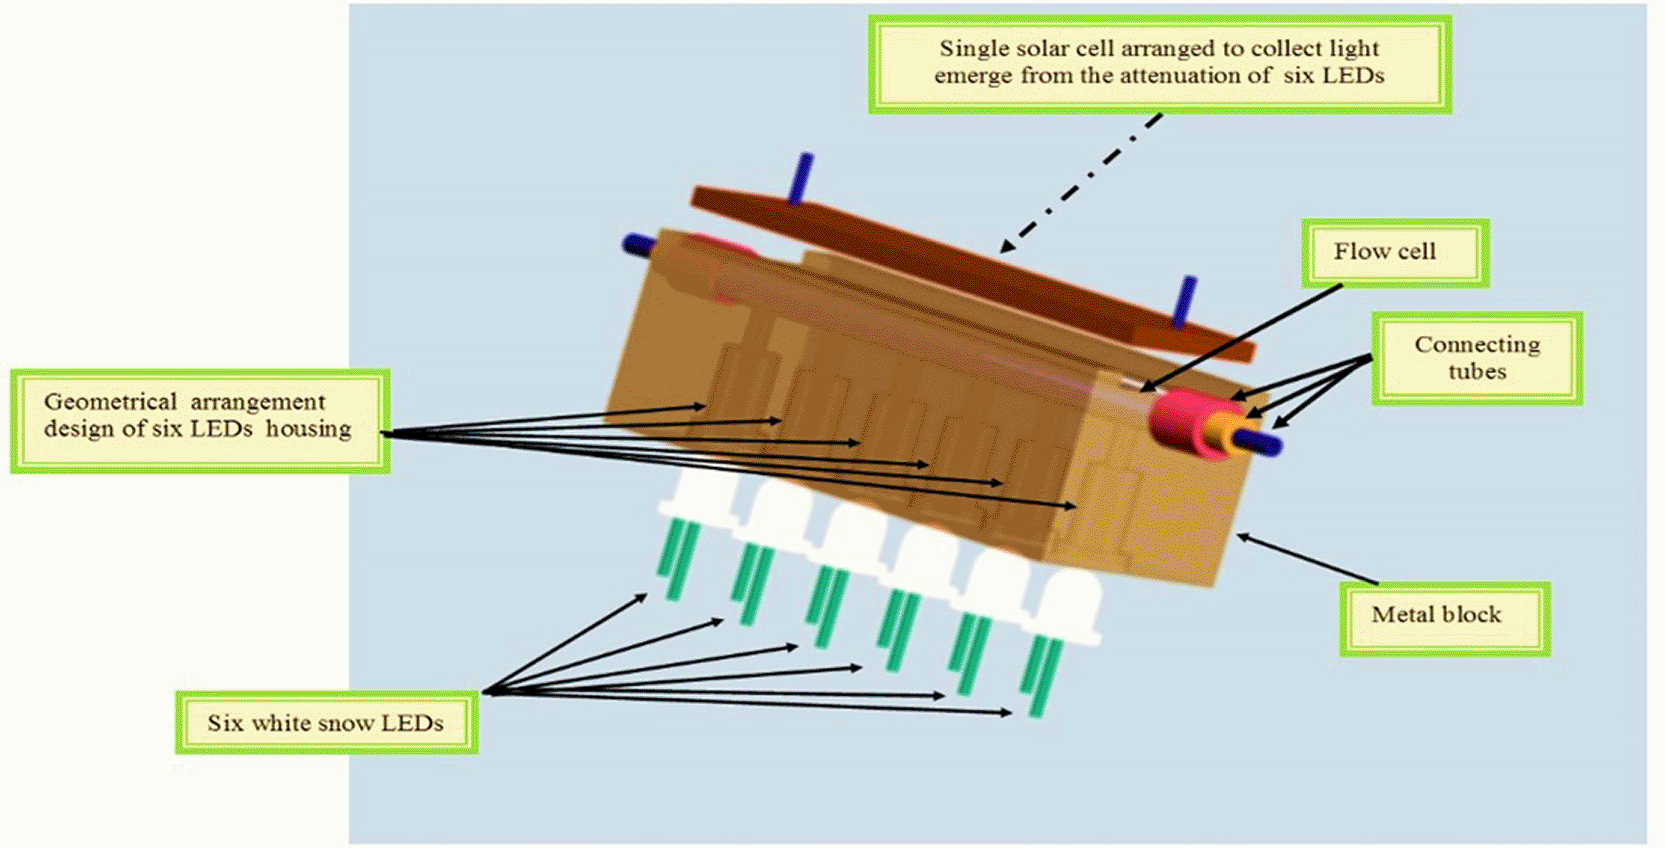
The whole instrument28 uses a linear array of irradiation sources possess a snow-white light emerging from six light-emitting diodes as shown in Figure 4. All these LEDs were arranged in a metal block made of brass with 20 x 20 and 60 cm length. The flow cell is a 70 mm in length made of a quartz tube with an inside diameter of a 2 mm and an outside diameter of 4 mm placed in a groove of brass metal with a channel width of 4 mm to enclose the flow cell in a perfect housing. Above this 4 mm groove, there is a channel of 14 mm width, 2 mm depth, and 60 mm length to form a channel to accommodate the single detector of solar cell. The solar cell detector will respond to the range of 410–1140 nm; which is capable of detecting any attenuation of light from the formed precipitate particulate (i.e.; turbidity, T).
Using the preliminary concentration of Co (II) (6.5 mmol. L−1), which reacts with Na2[Fe (CN)5NO].2H2O, the manifold system consists of two lines, as shown in Figure 1. This figure shows that the Co (II) ion is determined through its reaction with the Nitro press (0.3 mmol. L−1) in an acetic acid medium (7 mmol. L−1), forming pale orange precipitate particles in the ion pair form. To perform this determination, a carrier stream of acetic acid was used as the first line, with a flow rate of 1.7 ml. min−1. Through the injection valve, a sample segment of cobalt (II) ion (6.5 mmol. L−1) was introduced to meet with the Nitro press (0.3 mmol. L−1) in the second line, which had the same flow rate until the Y-junction point. From there, it is introduced to the NAG-6SX1-1D Analyzer, which has six irradiation sources of snow-white light-emitting diodes located on one side, while the opposite side (facing side) at 0–180° houses the solar cell.
The profile Yzi (mV)-tmin (dcm) was obtained by measuring the attenuation of the energy transducer response and expressed as an average of the peak heights in mV, repeated three successive times. The use of a flow cell with different tube diameters, that is converting from internal diameters of 1 mm to 4 mm, absorbs disturbances, modifies any noise, and reduces the distance in which the segment is viewed in front of the detector, thereby increasing the sensitivity and obtaining a noise-free profile. Additionally, a larger diameter (4 mm) allows time for the agglomeration of the formed particles by having a short segment and a high density of the precipitate, thus increasing the sensitivity. Figure 5 presents a proposed reaction mechanism that elucidates the interaction between the cobalt (II) ion and nitro press in an acetic acid environment.22,23
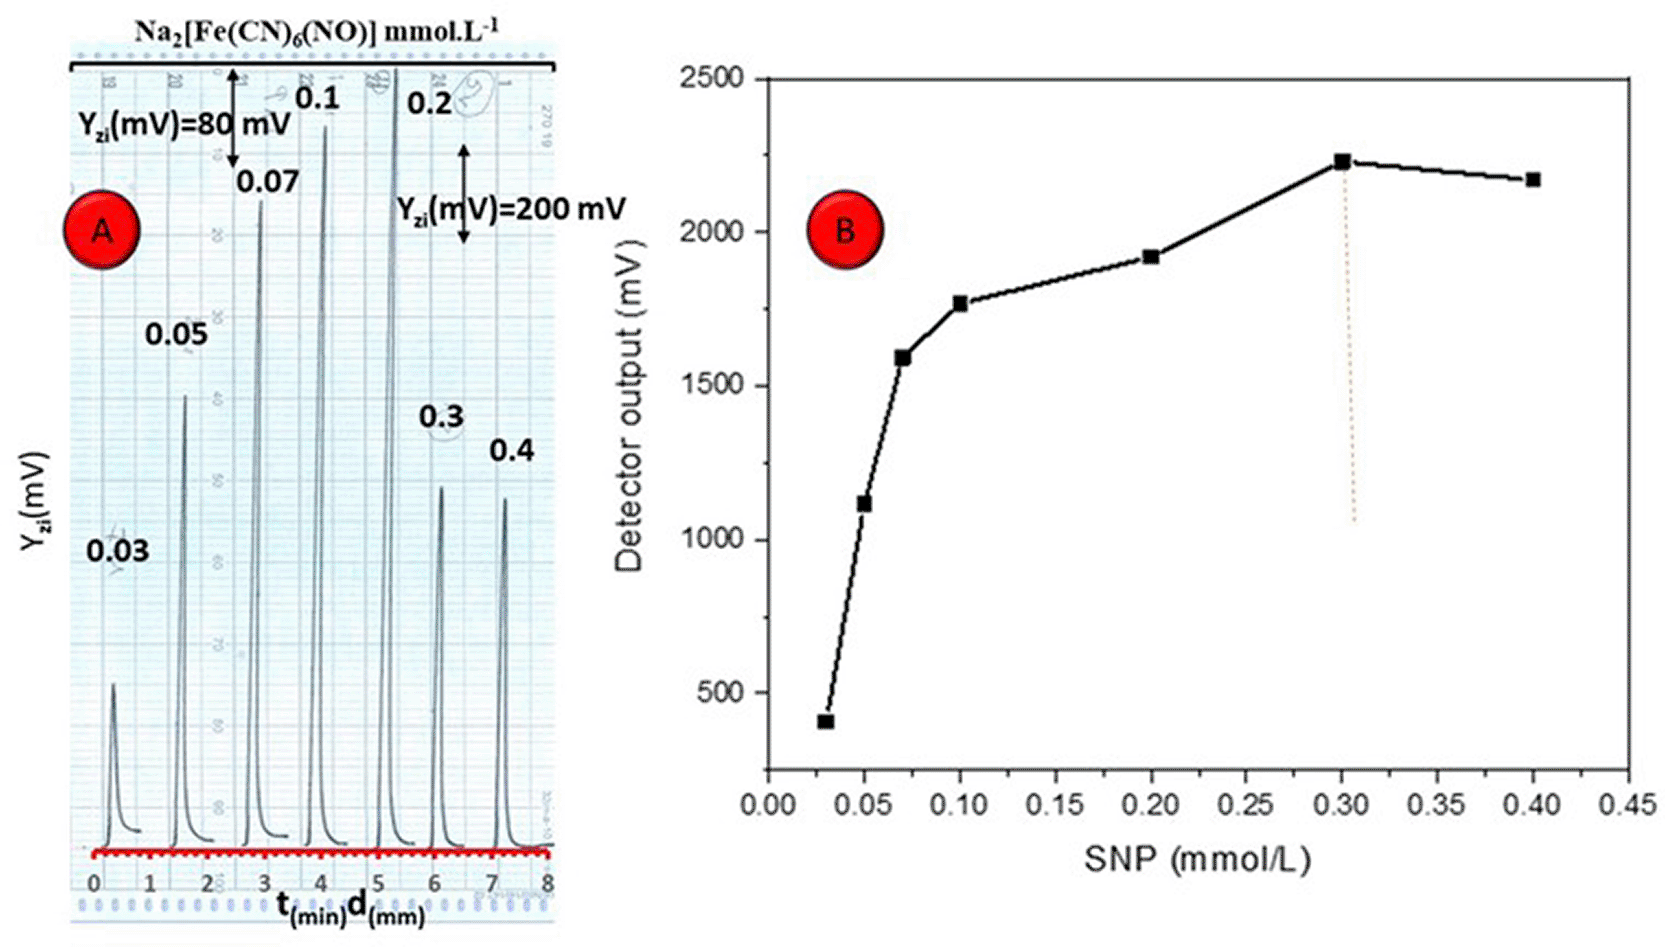
A series of Nitro press solutions were prepared by diluting the original stock solution with distilled water to achieve concentrations ranging from 0.03 to 0.4 mmol. L−1. Each concentration was assessed in triplicate, targeting a molarity of 6.5 mmol. L−1, with a sample volume of 175 μL, using an open valve mode and a flow rate of 1.5 ml. min−1 for both the carrier stream (distilled water) and the reagent. Figure 6-A illustrates the response profile of this investigation, showing that the response of the energy transducer varies with the nitro press concentration when using the NAG-6SX1-1D analyzer. The response of the colored species decreased with increasing Nitro press concentration up to 0.3 mmol. L−1 concentrations higher than 0.3 mmol. L−1 was followed by a decrease in the peak height maxima because of the agglomeration of the precipitate. Accordingly, the concentration of the nitro press 0.3 mmol. L−1 ( Figure 6-B) was selected as the optimal concentration for further studies.
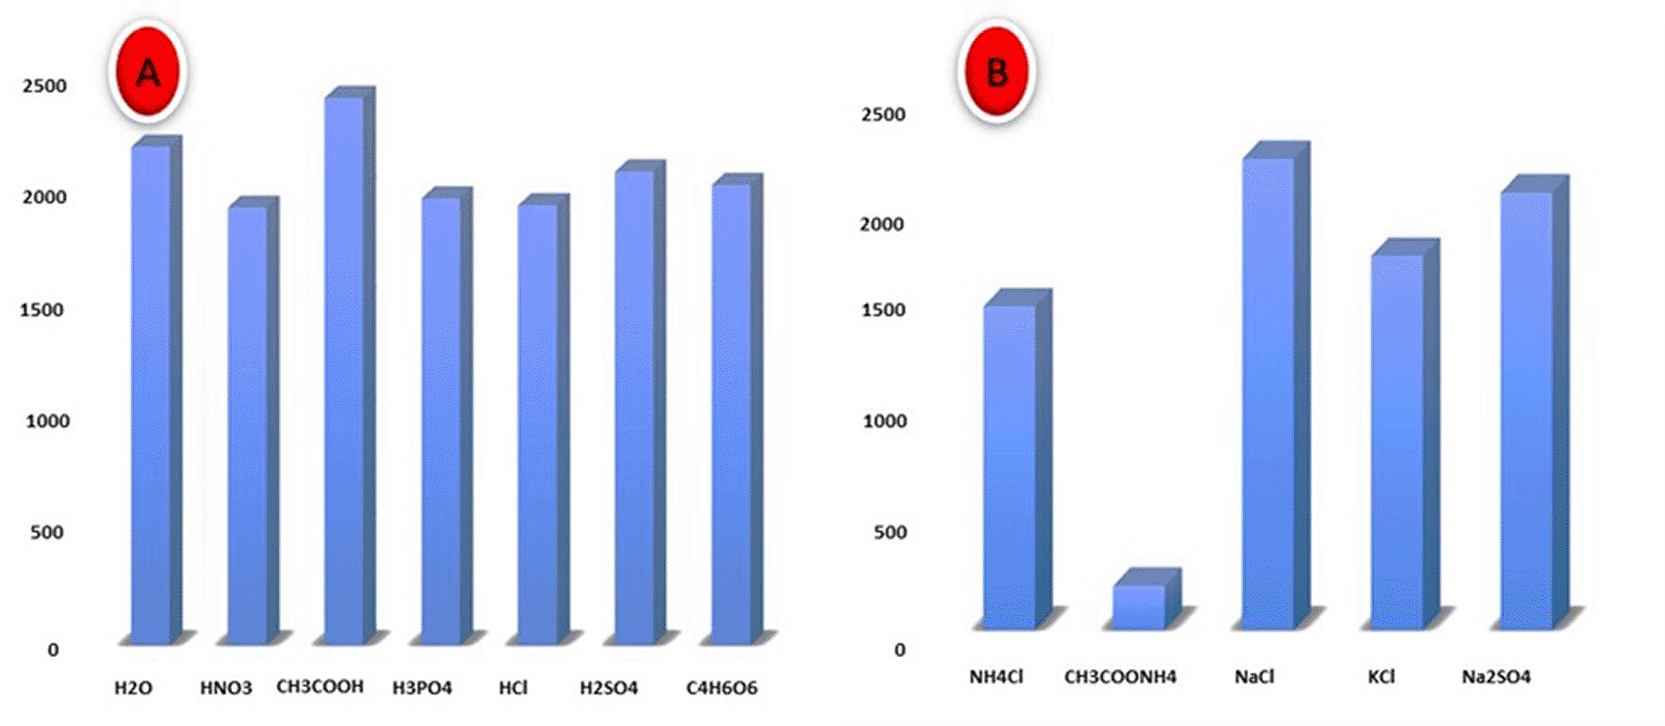
A series of experiments were performed with different aqueous solutions of salts and acids ((NH4Cl, NaCl, Na2SO4, KCl, CH3COONH4, HCl, HNO3, H3PO4, H2SO4, C4 H6O6 and CH3COOH)) instead of distilled water for the carrier stream. These experiments were performed to enhance the sensitivity and detection limits. The experiment was conducted with the following parameters: 6.5 mmol. L−1 Cobalt (II) ion concentration; both streams were passed through at a flow rate of 1.5 ml. min−1; sample volume, 175 μL open valve mode. The results showed a remarkable enhancement in detector sensitivity with the use of acetic acid (CH3COOH) as a carrier flow. However, the detector sensitivity was decreased by the addition of other aqueous salt solutions because the precipitated particles were dispersed in the presence of salts. The precipitate particles may have been invaded by the salts and subjected to disintegration. Some acids can also dissolve precipitates owing to their respective negative ions or chemical nature. Therefore, acetic acid (CH3COOH) has been selected as the best carrier stream ( Figures 7 -A and B).
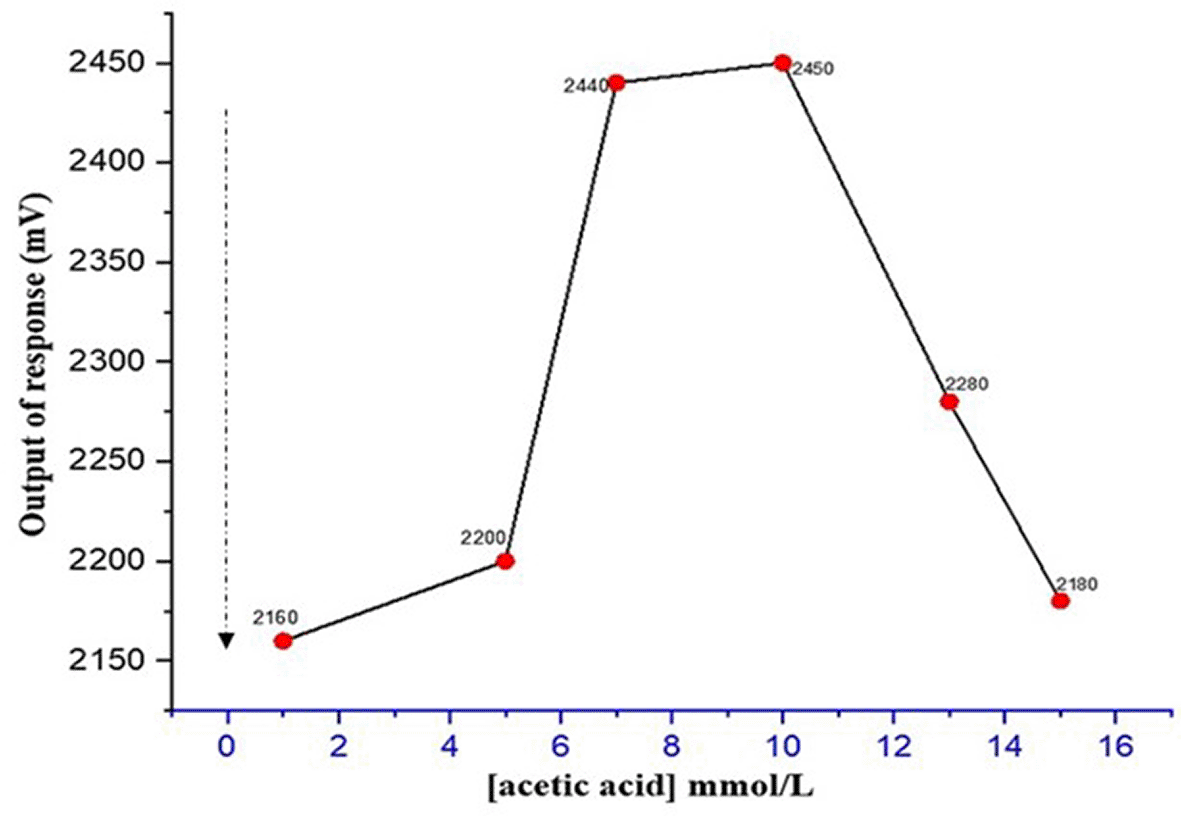
The optimal concentration of acetic acid as the carrier stream was 3 mmol. L−1, which was confirmed by the preparation of different solutions (1–15 mmol. L−1). The sample volume was 175 μL and the flow rate 1.5 ml. min−1, an open valve configuration, and a reagent concentration (Nitro press) of 0.3 mmol. L−1 provided the initial cobalt (II) ion concentration of 6.5 mmol. L−1. All experimental trials were performed in triplicate, which resulted in observed larger attenuation of the incident light at higher concentration of CH3COOH. This is also thoughts to be due to the small size of the precipitate particles, particularly when these are formed in a nucleation and growth mode and tend to aggregate in a close packed configuration, promoting agglomeration. Subsequently, as the concentration was increased to 7 mmol. L−1 and beyond, the attenuation of the incident light was further increased up to 7 mmol. L−1 owing to the enhancement by larger particles, which shows higher solubility for smaller-sized particles. In addition, high acid levels might cause the precipitate particles to be disrupted and degrade to form smaller pieces that do not scatter the incident light efficiently. The optimal carrier stream was determined to be 7 mmol. L−1 of CH3COOH. The results are shown in Figure 8.
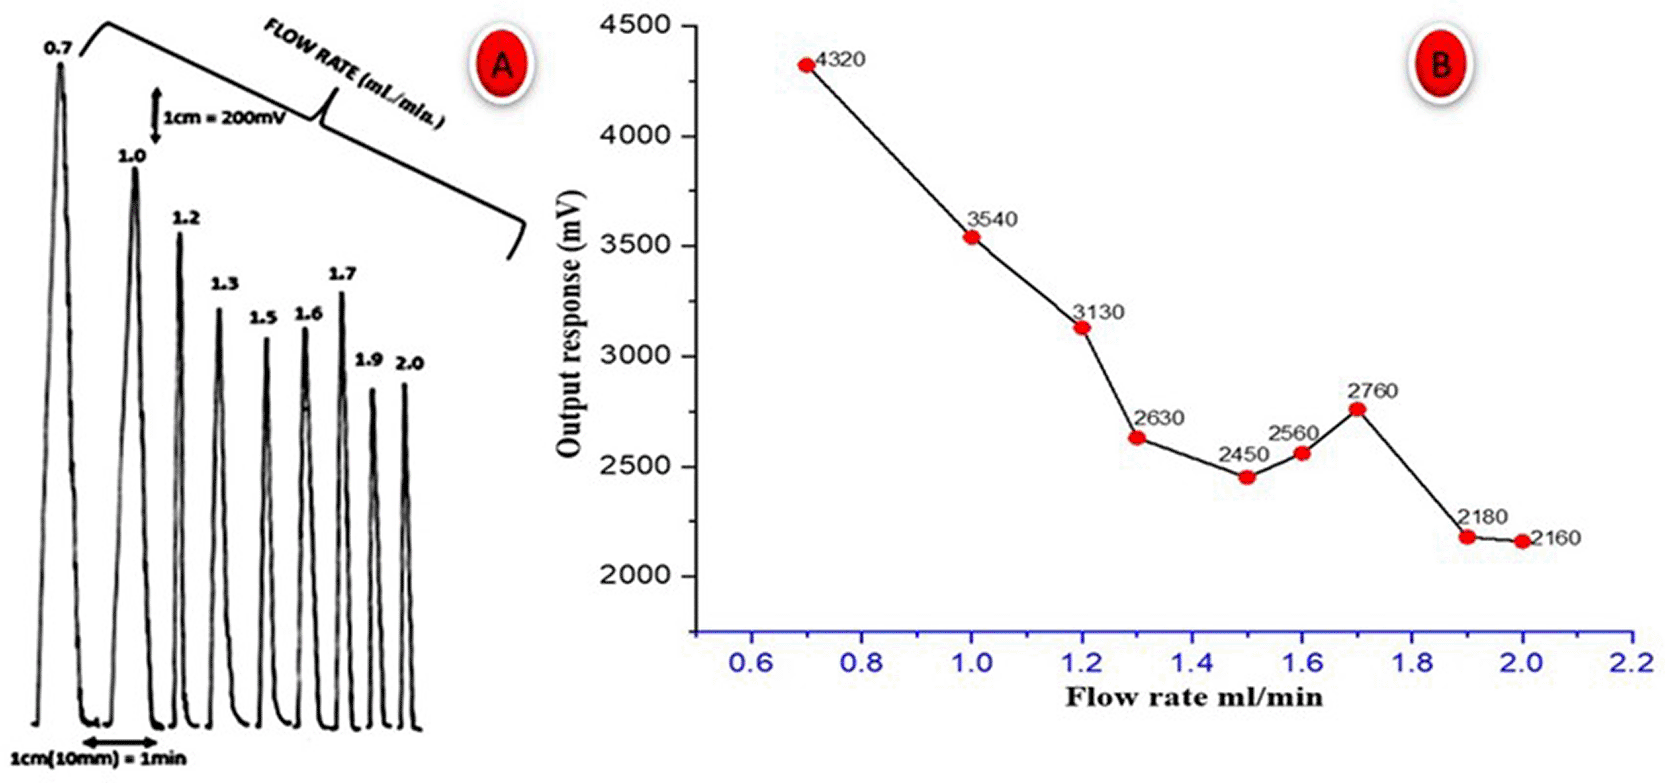
3. Study the variable of flow rates: To determine the optimal flow rate for both the reagent and carrier stream (acetic acid) line containing 6.5 mmol. L−1 cobalt nitrate, and a range of flow rates (0.7–2.0 ml. min−1) was applied to both the lines. Other experimental parameters, such as the Co2+ concentration (6.5 mmol. L−1), nitro press concentration (0.3 mmol. L−1), and 7 mmol. L−1 of CH3COOH, and the injection valve remained open until the measurement was completed.
Sensitivity was evaluated based on the height and shape of the response obtained by measuring the capability of the precipitate of the particles to attenuate light from six irradiation sources. At lower flow rates, the response time ΔtB increased, correlating with a significant deformation of the apex of the maximum peak response, as shown in Figure 9-A&B. This may be ascribed to an increase in the dispersion factor, which promotes dispersion by means of spreading or penetration. Moreover, the peak height decreased apparently at 1.7 mL.min−1, that may be due to dilution and dispersion, resulting in an anomalous response curve. The optimum flow rate for the Co2+ − Nitro press system was thus confirmed to be 1.7 mL. min−1.
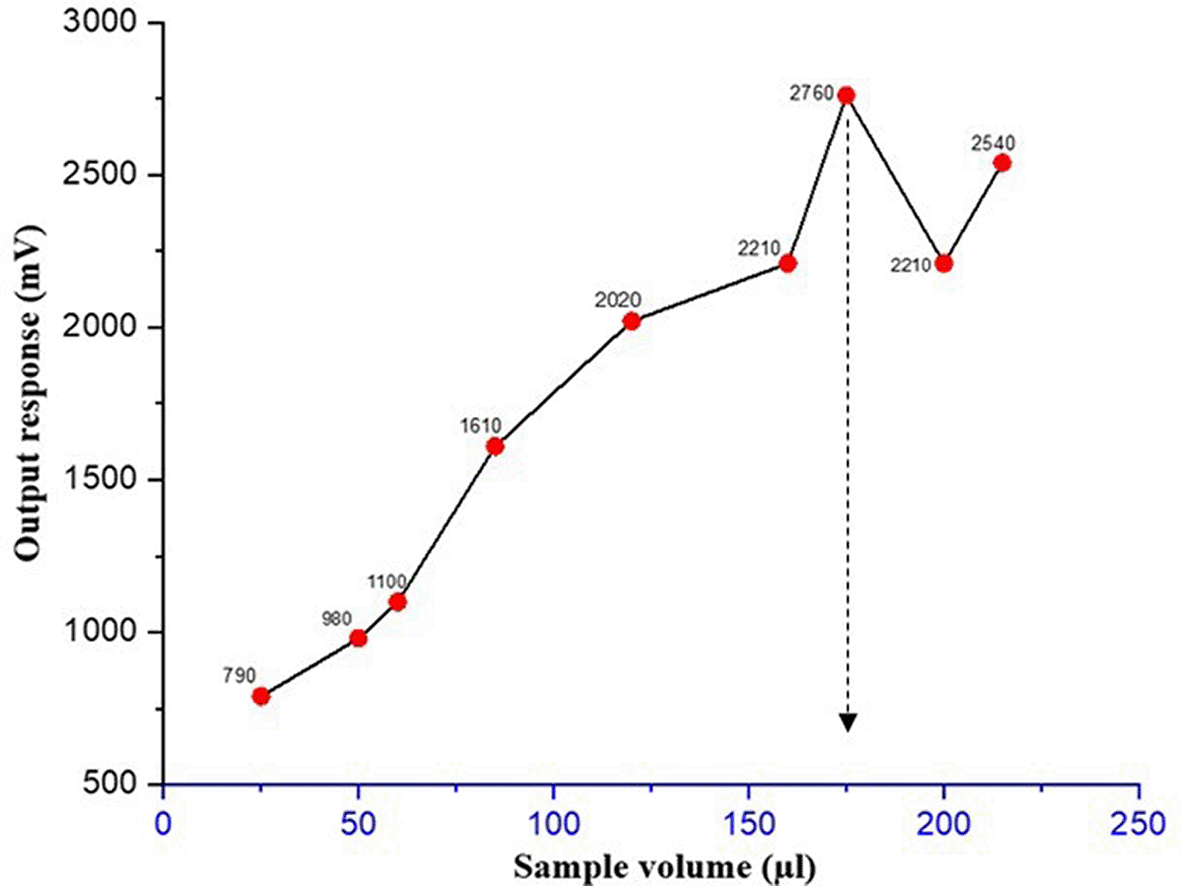
4. Effect of sample volume: In this investigation, the sample volumes were varied between 25 and 215 μL, using Teflon tubes that ranged from 3.18 to 27.39 cm in length, with a diameter of 1 mm. The results showed a significant increase in peak height with increasing sample volume, reaching a maximum at 175 μL. At this volume, the peak height was highest, corresponding to a sample segment length of 22.29 cm. Therefore, a sample volume of 175 μL was identified as the optimal volume and will be used in future experiments, as shown in Figure 10.
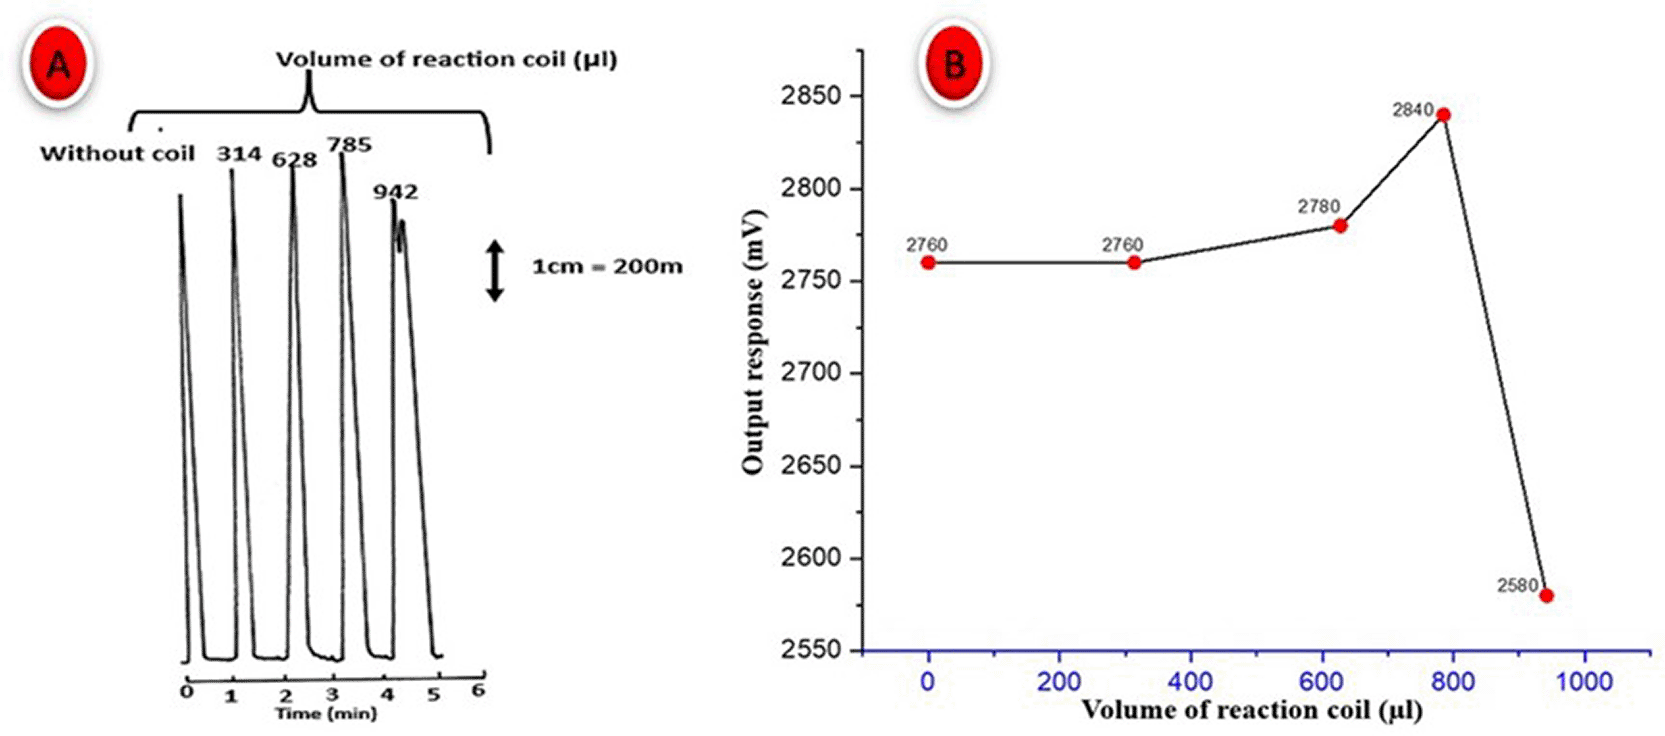
5. The effect of delay reaction coil: To determine whether the flow system requires a mixing coil to achieve optimal reactions between the cobalt ion and nitro press, various mixing coils (made from Teflon, with an inner diameter of 1 mm) of different lengths (10, 20, 25, and 30 cm) were used under optimized conditions. As shown in Figure 11, the effect of the reaction coil length on the sensitivity was evaluated using the S/N energy transducer response. Despite the increase in the reaction coil length, there was no clear increase in sensitivity (i.e., the profile remained unchanged) through the rise in the response amplitude up to 785 μL, likely due to the complete mixing and reaction at this coil length. A volume exceeding 785 μL led to a decrease in peak height and a widening of the base width (ΔtB), likely due to the prolonged duration of the presence of precipitate particles near the detector.
This newly developed methodology was used to measure the concentration of a chemical substance in an unknown sample by comparing it with a series of known concentrations. Using all the optimized analytical parameters of the proposed method, a calibration curve was created by recording the peak heights of the attenuated light for variable concentrations of Co (II) ion (0.005–10 mmol. L−1). The linear part of the curve for Co (II) ion is shown within the concentration range of 0.005–8 mmol. L−1, with a correlation coefficient (r) of 0.9959 (R2% = 99.20%), as shown in Figure 12, it is observed that there is A direct relationship was observed between the increase in signal output and the increase in concentration, likely due to the increase in precipitate particles and their aggregation, providing solid surfaces capable of attenuating the incident light up to 8 mmol. L−1. Beyond this concentration, only a slight increase in the signal output was observed, which did not correspond with the higher concentration, resulting in a decrease in the correlation coefficient to 0.9897 (R2% = 97.94%).
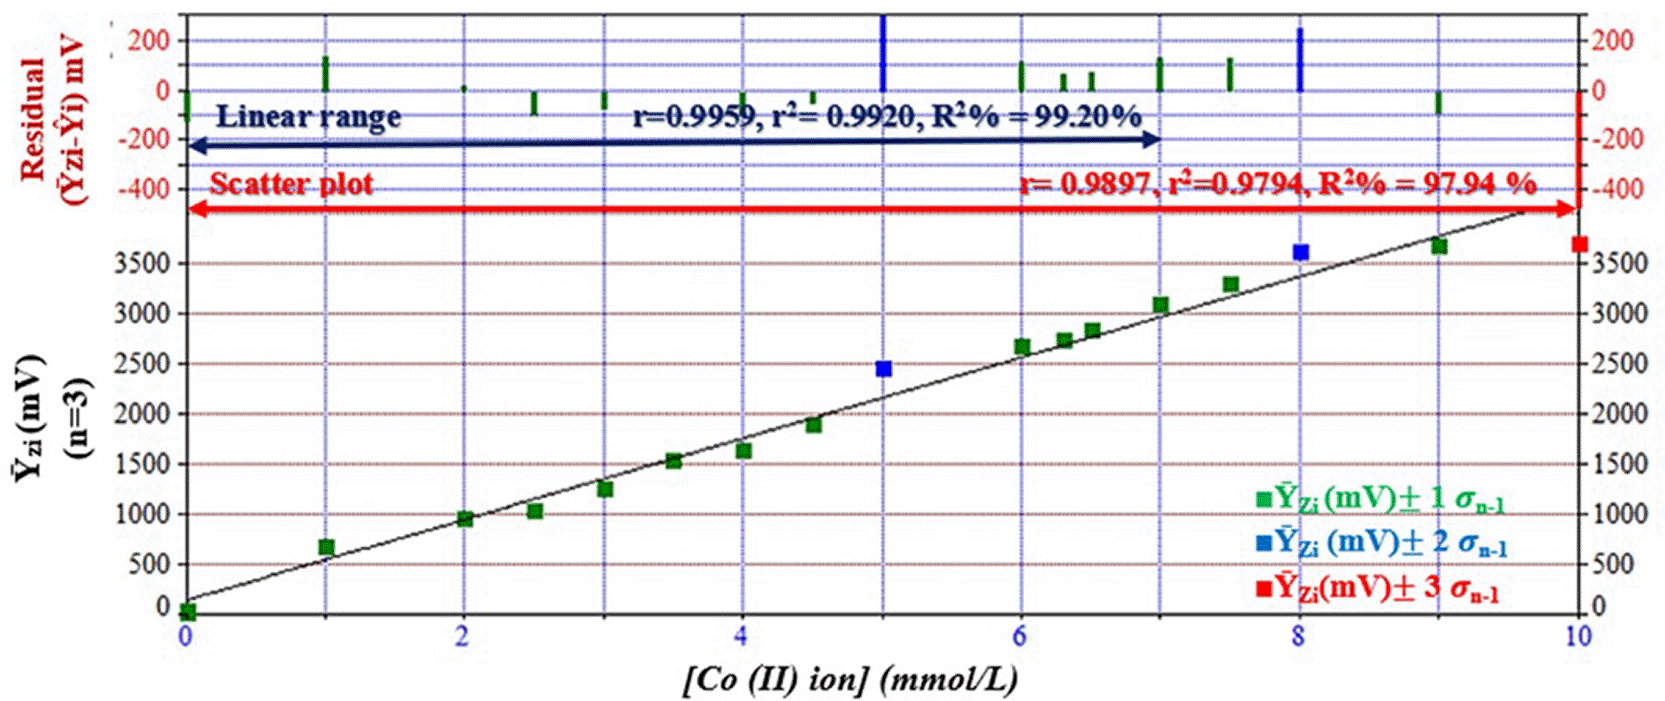
Ῡ Ƶi(mV): Analyzer response expressed as an average (n = 3) peak height in mV.
Table 1 provides a comprehensive summary of the linear regression analysis results.
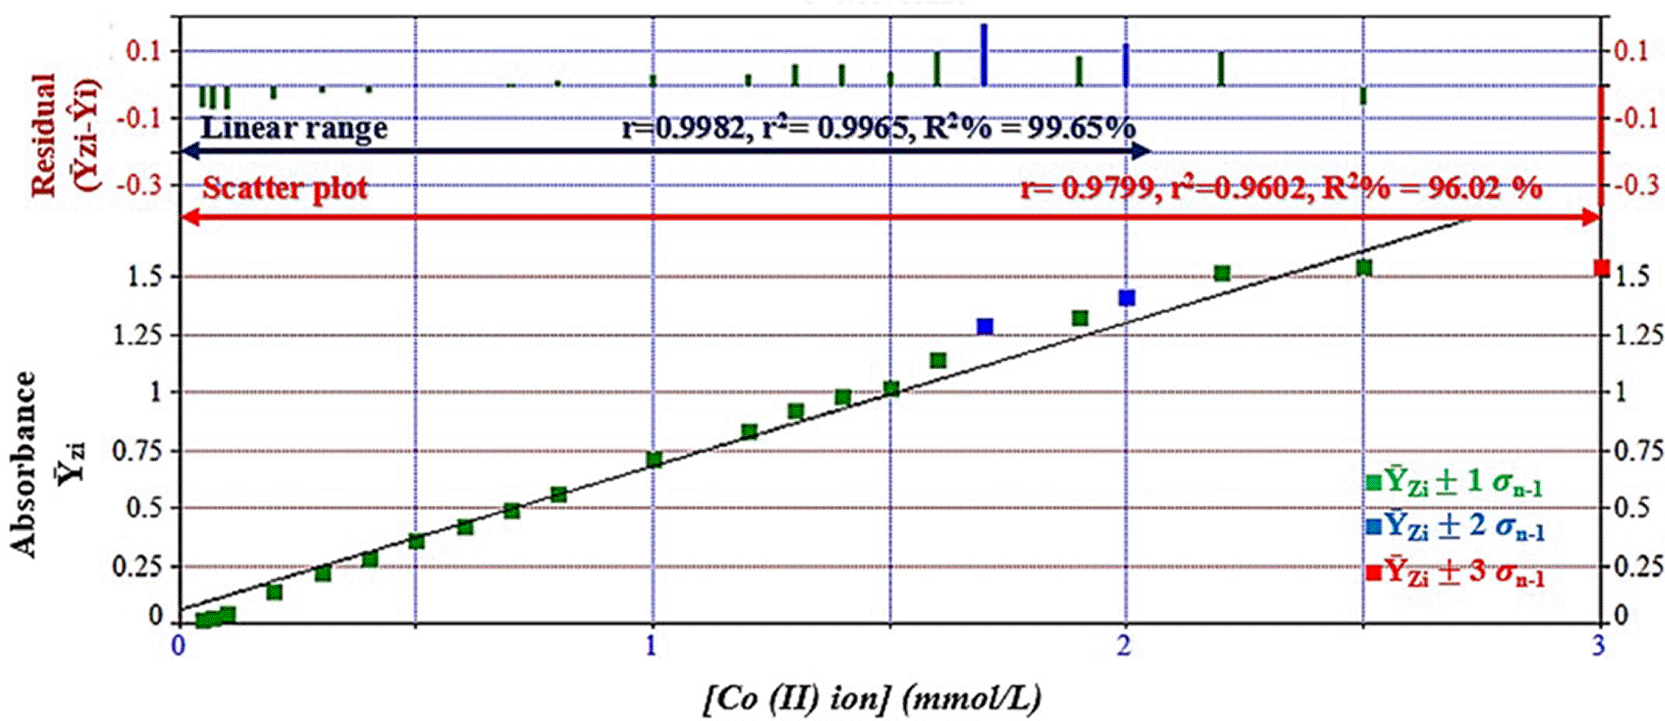
The new approach the NAG-6SX1-1D Analyzer of the determination of the Co (II) ion based on the method, was systematically compared with the conventional methodology, which involves UV-Spectroscopic technique at 512 nm in Co (II)- Na2[Fe (CN)5 NO] (0.3 mmol. L−1) – H3O+ (7 mmol. L−1). This well-established approach based on the optimal determination of absorbance detects the linearity in the concentration range between 0.05 and 3 mmol. L−1 and is commonly accepted as a reference method ( Figure 13). The linear area of the analyte was found to be at 0.05–1.7 mmol. L−1 with correlation coefficient (r) of 0.9982 and r2 = 0.9965 under the optimized conditions (derived from 17 measurements). Table 1 provides a complete overview of the results.
Three methods were used to examine the detection limit of Co2+ ions, and the overall findings are summarized in Table 2, for an injected sample volume of 175 μL. The L.O.D were calculated and the difference, the UV-Spectroscopy data results were 47.146 mg/Sample.
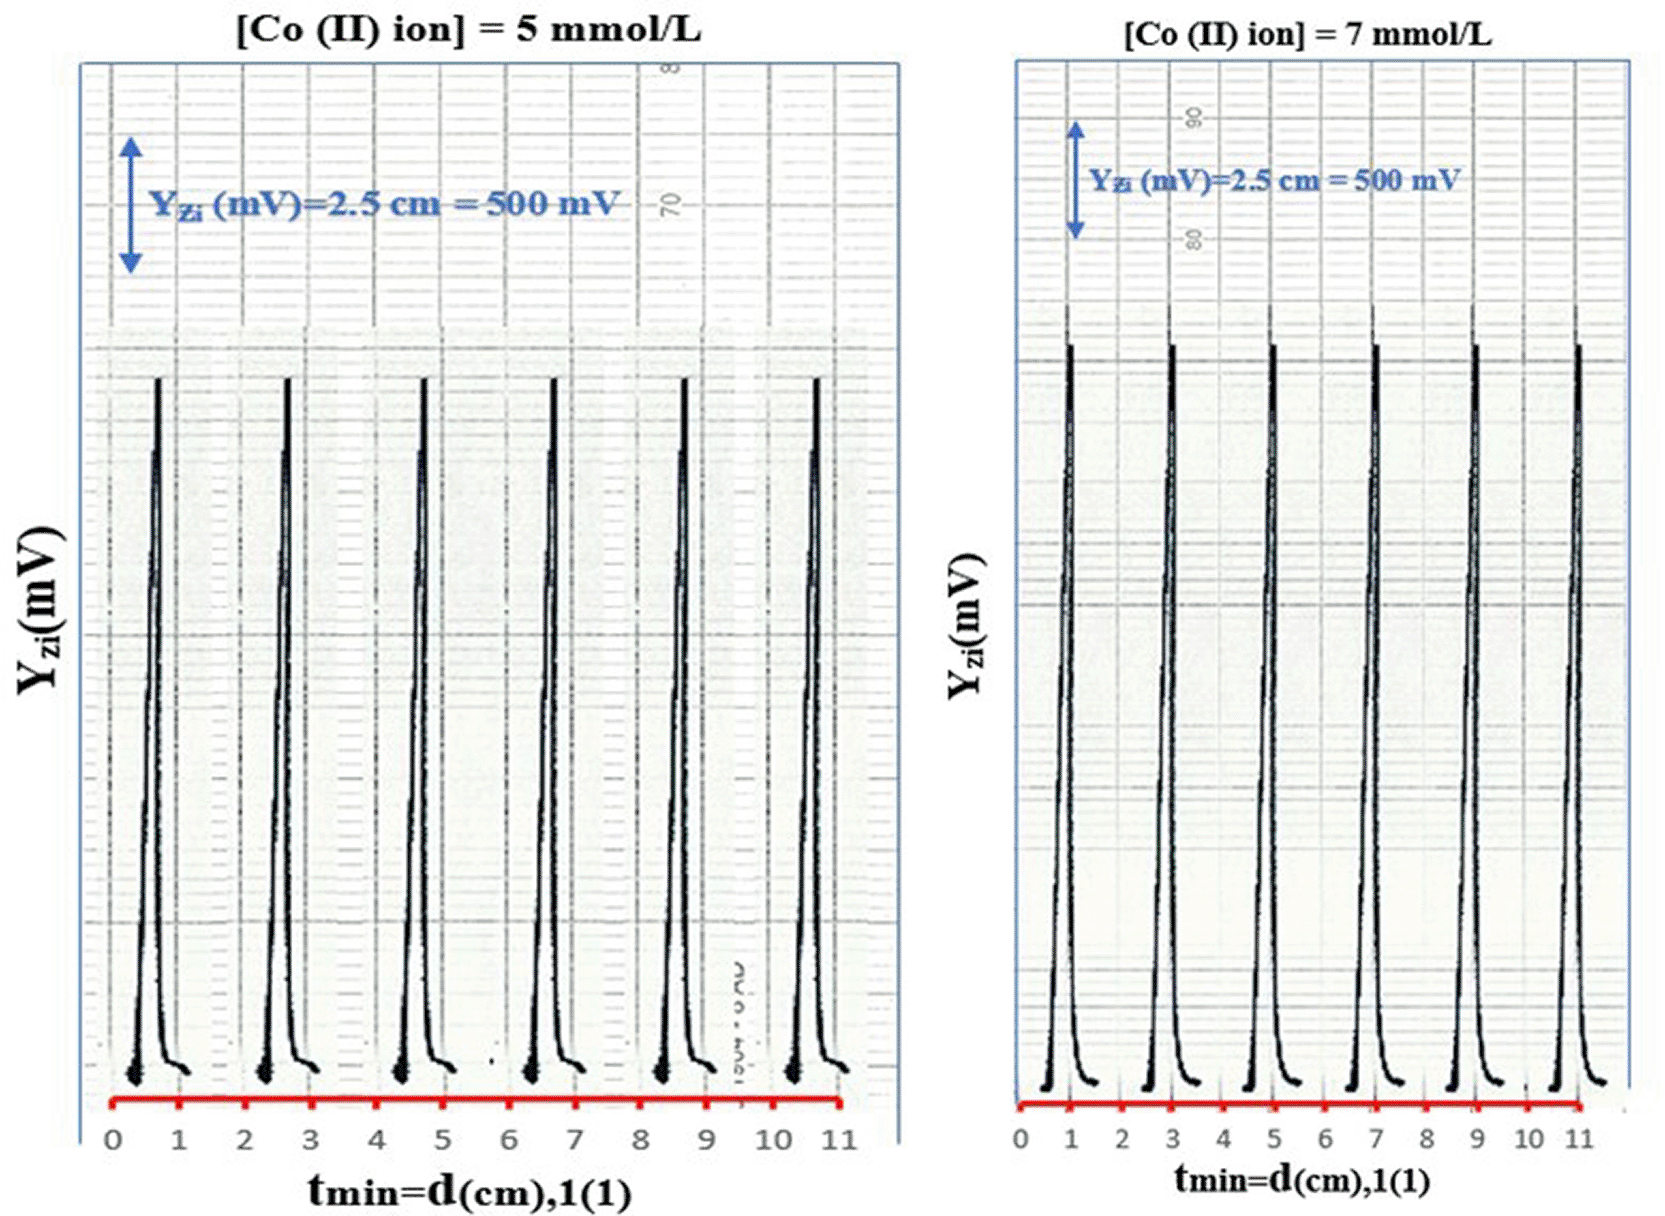
The repeatability was expressed as a percent relative standard deviation when six measurements were performed in six successive injections. They focused on the two concentrations of Co2+ ions, which were expressed in 5 mmol. L−1 and 7 mmol. L−1 in the best experimental conditions. Figure 14 shows the repeatability of as the data profile a perfect classification of the results and a minimum percent relative standard deviation of 0.21%.
A recently established analytical methodology (NAG-6SX1-1D Analyzer) was employed for the quantification of Co (II) ions across three distinct alloys: high purity iron (B.C.S.NO.260/2)-0.009%, High purity iron (B.C.S.NO.149/2)-0.012%, and High purity copper (B.C.S.NO.197e)-0.017%. The multitude flow injection apparatus is interfaced with the NAG-6SX1-1D Analyzer to monitor the transit of precipitate particles through a micro flow cell measuring 55 mm in length, which was subjected to six radiation sources and a single solar cell used as a detection device. The methodology is predicated on the assessment of the attenuation of incident light by the pale orange precipitate particles resulting from the interaction of the Co (II) ion with Na2[Fe (CN)5 NO]. This approach was juxtaposed with the traditional UV-Spectroscopic method through the evaluation of absorbance at λmax = 512 nm.
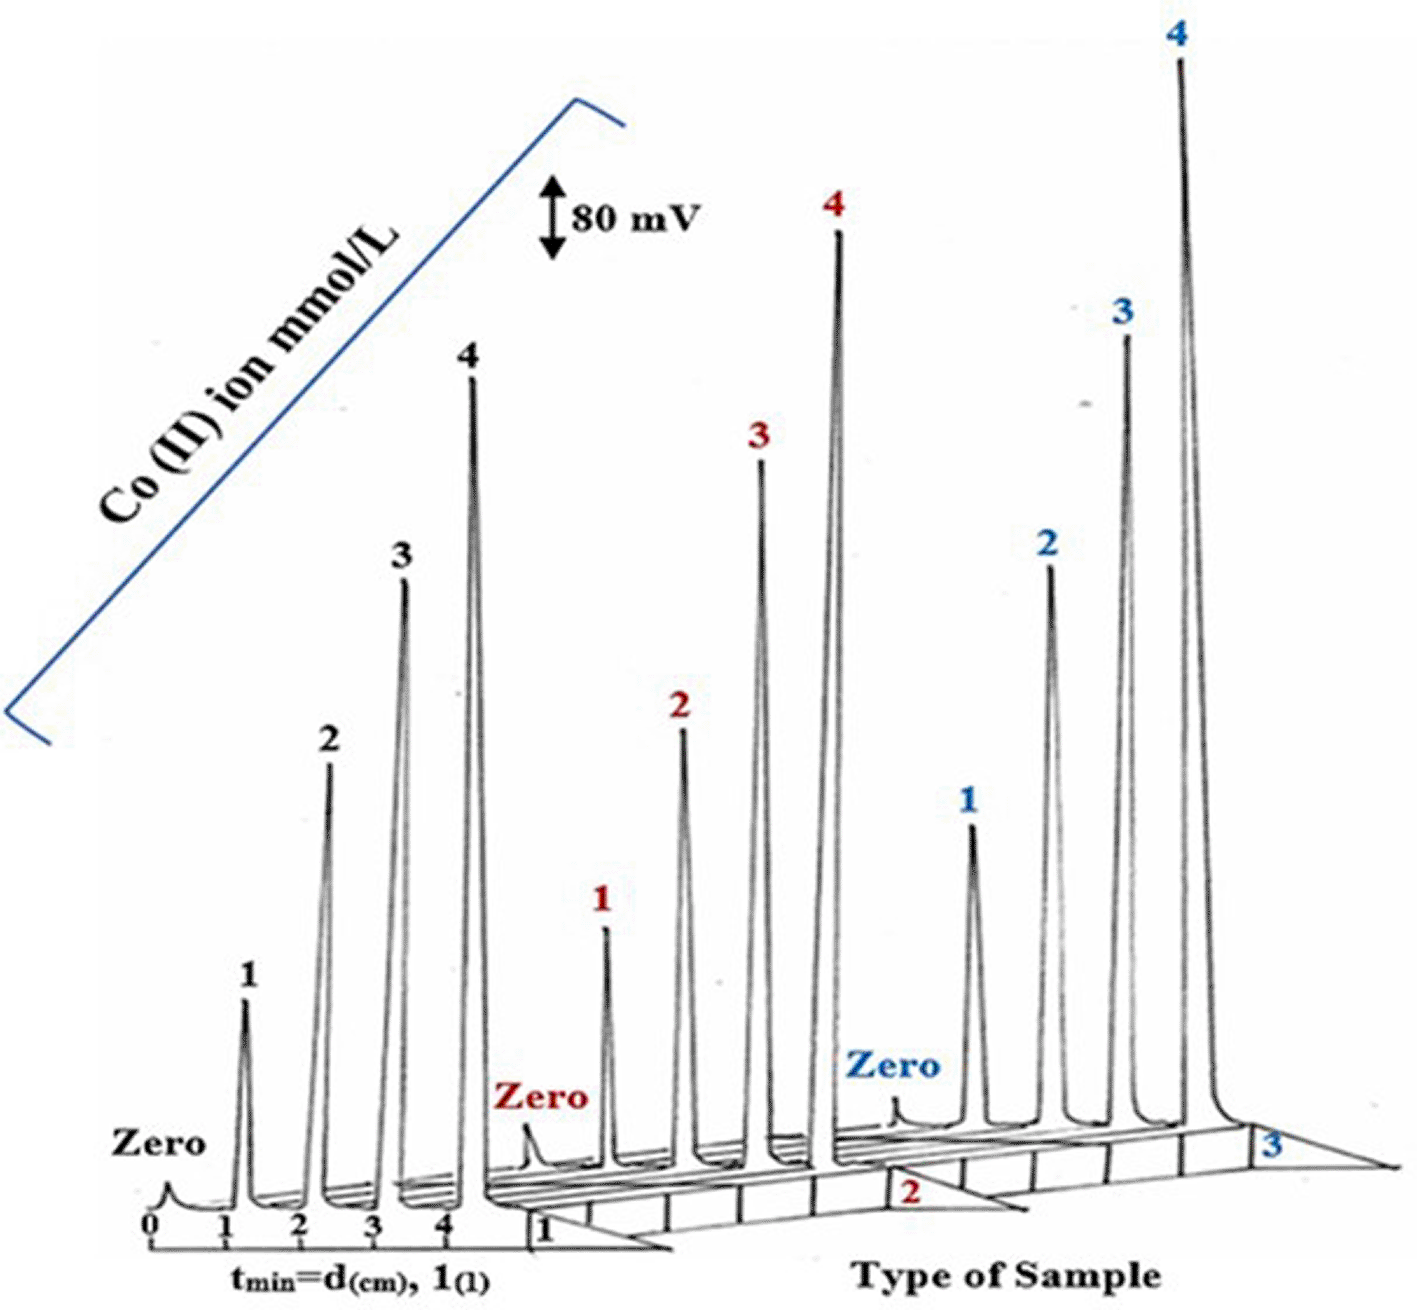
A series of solutions were meticulously prepared for each alloy (0.2 mmol. L−1) by transferring 5,3.75 and 2.65 mL, respectively, from each of three alloys to the five volumetric flasks (10 mL) followed by the increment of 0.0, 0.25, 0.5, 0.75, and 1 mL from a 40 mmol. L−1 standard solution, thereby achieving concentrations of 0, 1, 2, 3, and 4 mmol/L for the newly developed methodology as depicted in Figure 12. In contrast, the UV-Spectrophotometric method involved employing the same volumes used in the developed method but with varying amounts of the standard material. Specifically, 0, 0.125, 0.15, 0.175, and 0.2 mL of a 40 mmol. L−1 standard solution of Co (II) ion were added to yield concentrations of 0, 0.5, 0.6, 0.7, and 0.8 mmol. L−1, respectively. Measurements were performed using both methodologies. Table 3 presents a mathematically processed analysis of the results obtained using the standard addition method (the responses for this study are illustrated in Figure 12). This table also includes the outcomes from the two approaches, demonstrating the practical content of the active ingredient at a 95% confidence level, the determination efficiency, and the t-test results for comparative analysis across two distinct treatment modalities.
- First test: Comparison between quoted value (μ = 9, 12 and 17 mg) and the mean value of the developed method (NAG-SSP Analyzer) ( i(mg)). The proposed hypothesis: Ho: μ = i(mg) (i.e., the mean of any alloy that is accepted against H1: μ ≠ i(mg), due to ttab(4.303) is more than tvalue for alloys ( Table 3), “Therefore, the null hypothesis is accepted, and the alternative is rejected, indicating that there is no significant difference between the theoretical value and the mean of the observed values.”
- Second test: Comparison of the results obtained from both methods, neglecting the difference of alloy origin and companies.
| No. of sample | Type of Alloy and content | Weight of Co2+ in 100 gm of each alloy (gm) | Equation of standard addition at 95% for n-2 | Practical concentration (mmol. L−1) in 10 ml | Weight of Co2+ in each sample (100 g) i(mg) |
|---|---|---|---|---|---|
| Weight of Co2+ in 15 gm of each alloy (mg) | Ŷi = a ± sat + b ± sbt [Co2+] mmol. L−1 | Practical concentration (mmol. L−1) in 100 ml | Efficiency of determination Rec.% | ||
| [Co2+] mmol. L−1 of 15 gm alloy | r, r,2 R2% | Practical weight of Co (II) in 15 gm i(mg) | Individual t-test between claimed value & practical value by new method ( i(mg)-μ) √n /σ n-1 | ||
| Developed method using NAG – SSP Analyzer (mV) | |||||
| UV- Spectrophotometer at λ max = 512 nm. | |||||
| 1 | (High purity iron ( B.C.S.No .260/2) 0.009% | 0.009
9 mg | 44.2 ± 1.073 + 389.90 ± 10.321 [Co (II)] mmol. L −1 | 0.1134 | 8.90667 |
| 0.2267 | 98.96% | ||||
| 0.9995,0.9991, 99.91% | 1.336 | /− 1.816/ < 4.303 | |||
| 1.35 | 0.1223 ± 0.0173 + 1.114 ± 0.121 [Co (II)] mmol. L −1 | 0.1097 | 8.6271 | ||
| 0.2291 | 0.2195 | ||||
| 1.2941 | |||||
| 0.9999, 0.9999, 99.99% | 95.86% | ||||
| 2 | (High purity iron ( B.C.S.No .149/2)) 0.012% | 0.012 12 mg | 48.2 ± 1.134 + 432.20 ± 8.326 [Co (II)] mmol. L −1 | 0.1115 | 11.684 |
| 0.29739 | 97.37% | ||||
| 1.7526 | |||||
| 0.9903, 0.9967, 99.67% | /− 1.325/ < 4.303 | ||||
| 1.8 | 0.0980 ± 0.0079 + 0.8345 ± 0.094 [Co (II)] mmol. L −1 | 0.1175 | 12.308 | ||
| 0.31328 | |||||
| 1.8463 | |||||
| 0.3054 | 0.9988, 0.9975, 99.75% | 102.57% | |||
| 3 | (High purity copper ( B.C.S.No .197e) 0.017% | 0.017 17 mg | 57.6 ± 2.104 + 509.70 ± 9.806 [Co (II)] mmol. L −1 | 0.113 | 16.754 |
| 0.426 | |||||
| 2.513 | 98.56% | ||||
| 0.9999, 0.9998, 99.98% | /− 1.692/ < 4.303 | ||||
| 2.55 | 0.1287 ± 0.0131 + 1.18438 ± 0.043 [Co (II)] mmol. L −1 | 0.10868 | 16.1132 | ||
| 0.41012 | |||||
| 2.41698 | |||||
| 0.1147 | 0.9993, 0.9985, 99.85% | 94.78% | |||
| Paired t –test Compared between two methods tcal= d(mg) √n/Sd | d (mg) = 0.099, Sd = 0.6516, t cal (0.263) < t tab(4.303) | ||||
The proposed hypothesis for the method is as follows:
Null hypothesis H o: NAG-6SX1-1D Analyzer = μ UV-Sp. (for the three alloys) which means that there is no significant difference between the means of the two methods, see Figure 15.
Contrary to the alternative hypothesis: there was a significant difference between the mean of the two methods. i.e.; H1: NAG-6SX1-1D Analyzer = ≠ μ UV-Sp. (for the three alloys respectively). The obtained results are presented in Table 3, clearly indicates that there was no significant difference between the NAG-6SX1-1D Analyzer and UV-Spectrophotometric at the 95% confidence level (α = 0.05) as the calculated tcal (0.263) is less than ttab (4.303) for the determination of Co (II) ion in different alloys.29,30
The turbidimetric CFIA procedure can be considered as an alternative method for the analytical monitoring of Cobalt ions and its usefulness in the batch control assay can be hypothesized. The method is based on the precipitation of Co (II) ions and Nitro press in acidic medium, resulting in a pale orange product. From an experimental point of view, the application of this approach is quite simple and allows for serial testing at a rate of up to 40 samples per hour. Moreover, this method requires less expensive instruments and reagents. In this study, a quicker and more potent role determination was achieved using the NAG-6SX1-1D Analyzer with six LED as the excitation light and a UV solar cell as a detector. The standard addition technique was thus employed to reduce any potential matrix effect and obtain the maximum sensitivity, as heating or extraction procedures were not required.
| Views | Downloads | |
|---|---|---|
| F1000Research | - | - |
|
PubMed Central
Data from PMC are received and updated monthly.
|
- | - |
Provide sufficient details of any financial or non-financial competing interests to enable users to assess whether your comments might lead a reasonable person to question your impartiality. Consider the following examples, but note that this is not an exhaustive list:
Sign up for content alerts and receive a weekly or monthly email with all newly published articles
Already registered? Sign in
The email address should be the one you originally registered with F1000.
You registered with F1000 via Google, so we cannot reset your password.
To sign in, please click here.
If you still need help with your Google account password, please click here.
You registered with F1000 via Facebook, so we cannot reset your password.
To sign in, please click here.
If you still need help with your Facebook account password, please click here.
If your email address is registered with us, we will email you instructions to reset your password.
If you think you should have received this email but it has not arrived, please check your spam filters and/or contact for further assistance.
Comments on this article Comments (0)