Keywords
Weekend effect; Epidemiologic studies; Suicide, completed; Poisson Distribution; Biostatistics.
Weekend effect; Epidemiologic studies; Suicide, completed; Poisson Distribution; Biostatistics.
• The Poisson distribution may reveal hidden public health problems masked by the Binomial distribution.
• Identifying the weekend effect in the distribution of completed suicides is a strategic step toward reorganizing mental health services.
• The methodology can be used to identify differential measurement bias in other public health issues.
The occurrence of negative clinical and administrative outcomes in prehospital care, emergency departments, and hospitalizations is called the weekend effect (WE).1,2 The WE has been studied in the care of cardiovascular and cerebrovascular diseases, sepsis, and emergency surgeries, among others; however, there is little evidence regarding the WE in completed suicides (CS).1–3
CS is the third leading cause of death among adolescents and young adults. Approximately 727.000 CS occur worldwide each year, with an estimated rate of 9 per 100.000 people.4 In the Americas, the estimated annual rate is 6.2 per 100.000 people (65.000 CS). However, in Colombia, the rate increased from 4.6 to 6.0 (an increase of 30.4%) between 2011 and 2021.5,6
A multicenter study analyzing more than 1.7 million CSs between 1971 and 2019 showed a higher risk on weekends in Central and South American countries, South Africa, and Finland, compared with countries in North America, Europe, and Asia, where CS occurred mainly on Mondays and Wednesdays.7 In Colombia, ~25,000 CSs over eleven years were analyzed, and an average of 6.2 events per day was observed, increasing to 8 CS on holidays. Likewise, a higher risk of death was observed in the Eastern Plains, especially among young adults and older adults, as well as among residents of rural areas.8
As mentioned, the WE has been studied in cardiovascular emergencies, obstetric complications, and both general surgical and trauma-related emergencies. However, it has been shown that the maturation of trauma systems and the 24/7 model of care are health determinants that can significantly reduce the WE, especially in injuries from external causes, such as CS.1,2,7,9–11
CS events during the week (n/5 days) and at weekends (n/2 days) may follow a Poisson distribution (Poi(λ)), given that events occur in defined periods, in this case, asymmetric periods.12 In most studies, the statistical methods used to determine the WE in CS rely on logistic regression or comparisons of proportions using hypothesis tests for Binomial distributions (X ~ B(n, p)), and only rarely use multivariate methods or compare event frequency during the week and at weekends using Poi(λ).1,2,7–14
The impact of the WE was first recognized in the commercial sector, and, contrary to the health sector, the effect is positive, with increases in visits to shopping centers, sales, alcohol consumption, among other financial indicators.15,16 In response to the WE, the economic sector makes logistical, administrative, and operational adjustments to meet the demand for services. Conversely, such strategies are not commonly seen within the health sector. This is often due to a lack of research or evidence regarding the WE, financial limitations, constraints on care, and various other factors that influence the reorganization or modification of health service delivery.
This study compared the frequency of suicides during the week and at weekends, using Binomial and Poisson distributions, to show the WE in the occurrence of CS in Colombia. The results will serve as academic support for adjusting and reorganizing the distribution of mental health services.
An analytical cross-sectional study was conducted using information from a public administrative database of confirmed suicides in Colombia between 2015 and 2023 (updated December 5, 2024; National Institute of Legal Medicine and Forensic Sciences [INMLCF]).17 Due to the study design, all records were analyzed, and those with missing information in the “day of the event” variable were excluded. The database did not contain information that could identify the deceased individuals.
The study adhered to the ethical principles of the Declaration of Helsinki, as well as Resolution 8430 of 1993 issued by the Colombian Ministry of Health. This is a retrospective, no-risk study based on a database review.18,19
The database contained thirty-five sociodemographic variables related to the scene and context of suicide. However, ten variables were analyzed: five in the personal dimension (life cycle, gender, education, nationality, marital status), four in the temporal dimension (year, semester, quarter of occurrence, and time of the week [weekend, weekday]), and one in the location dimension (department). The variable “day of the event,” which indicated the day on which the suicide occurred, was transformed into “time of the week”: weekends (Saturday and Sunday) and weekdays (Monday to Friday). Additionally, the variable “department” was transformed into geopolitical regions (Andean, Caribbean, Pacific, Orinoco, Amazonian, Insular).
Qualitative variables were analyzed and presented as counts and proportions (95%, CI) (Binomial distribution, X ~ B(n, p)); In addition, the average number of occurrences on weekdays (n/5 days) and weekends (n/2 days) was calculated using a Poisson distribution (X ~ Poi(λ)).12
To compare the frequency (proportions, π) of suicides on weekends vs. weekdays using X ~ B(n, p), a one-sided hypothesis test (Z-test) was applied (Epidat Sergas, version 4.2):
Likewise, to compare the frequency of suicides using X ~ Poi(λ), a one-sided hypothesis test (E-test) was applied20:
The presence of the WE was established when comparing weekend and weekday frequencies with a p-value <0.05. Confidence interval plots (95%, CI) were used to compare the frequency of suicides on weekends and weekdays (X ~ B(n, p); X ~ Poi(λ)) by department within each geopolitical region.
Finally, to describe the relative excess of weekend versus weekday frequency, the ratio of frequencies was calculated using X ~ B(n, p) (π_weekend /π_weekday) and compared with the ratio obtained using X ~ Poi(λ) (λ_weekend/λ_weekday).
During the study period, there were 23.544 CS events. Thirty CS were excluded from the analysis due to missing information on the date of the CS (0.13%). The excluded CS occurred in 2015 and involved Colombian nationals. Most were men (n = 25/30) and adults (n = 18/30). Additionally, missing data were observed for the variables education (weekends: 16.0%; weekdays: 15.7%), geographic area (weekends: 0.013%; weekdays: 0.012%), nationality (weekends: 0.45%; weekdays: 0.39%), and marital status (weekends: 10.75%; weekdays: 10.33%). Therefore, analyses were performed using the subtotal for weekends and weekdays, excluding the missing absolute frequency within each category from the denominator ( Table 1).
| Variables | Weekends | Weekdays | P-Value | ||
|---|---|---|---|---|---|
| n: 7.497 | % (95%, CI) | n: 16.017 | % (95%, CI) | ||
| Age, life cycle | |||||
| Early childhood | 4 | 0.05 (0.01–0.13) | 14 | 0.09 (0.04–0.14) | 0.811 |
| Middle childhood | 22 | 0.29 (0.18–0.44) | 42 | 0.26 (0.18–0.35) | 0.334 |
| Adolescence | 712 | 9.50 (8.84–10.1) | 1.708 | 10.7 (10.1–11.1) | 0.997 |
| Early adulthood | 2.405 | 32.1 (31.0–33.1) | 4.596 | 28.7 (27.9–29.4) | 0.000 |
| Middle adulthood | 3.295 | 44.0 (42.8–45.0) | 6.945 | 43.4 (42.5–44.1) | 0.197 |
| Late adulthood | 1.059 | 14.1 (13.3–14.9) | 2.712 | 16.9 (16.3–17.5) | 1.000 |
| Sex | |||||
| Male | 6.026 | 80.4 (79.4–81.2) | 12.877 | 80.4 (79.7–81.0) | 0.512 |
| Female | 1.471 | 19.6 (18.7–20.5) | 3.140 | 19.6 (18.9–20.2) | 0.488 |
| Education † | |||||
| Basic – High School | 5.586 | 88.7 (87.9–89.5) | 11.673 | 86.5 (85.8–87.0) | 0.000 |
| Technical - Universitary | 493 | 7.80 (7.18–8.52) | 1.286 | 9.50 (9.03–10.0) | 1.000 |
| No schooling | 216 | 3.40 (2.99–3.91) | 538 | 4.00 (3.66–4.33) | 0.971 |
| Nationality ††† | |||||
| Colombian | 7.304 | 97.9 (97.5–98.1) | 15.641 | 98.0 (97.8–98.2) | 0.804 |
| Foreigner | 159 | 2.13 (1.81–2.48) | 313 | 1.96 (1.75–2.18) | 0.196 |
| Marital status †††† | |||||
| Single | 3.491 | 52.2 (50.9–53.3) | 7.605 | 53.0 (52.1–53.7) | 0.855 |
| Common-law marriage | 1.839 | 27.5 (26.4–28.5) | 3.515 | 24.5 (23.7–25.1) | 0.000 |
| Married | 902 | 13.5 (12.6–14.3) | 2.156 | 15.0 (14.4–15.6) | 0.998 |
| Separated, divorced | 328 | 4.90 (4.39–5.44) | 743 | 5.17 (4.81–5.54) | 0.798 |
| Widowed | 125 | 1.87 (1.55–2.22) | 322 | 2.24 (2.00–2.49) | 0.960 |
| Not applicable | 6 | 0.09 (0.03–0.19) | 20 | 0.14 (0.08–0.21) | 0.830 |
| Years | |||||
| 2015 | 635 | 8.47 (7.84–9.12) | 1.403 | 8.76 (8.32–9.20) | 0.769 |
| 2016 | 755 | 10.1 (9.39–10.7) | 1.555 | 9.71 (9.25–10.1) | 0.192 |
| 2017 | 806 | 10.8 (10.0–11.4) | 1.765 | 11.0 (10.5–11.5) | 0.731 |
| 2018 | 864 | 11.5 (10.8–12.2) | 1.832 | 11.4 (10.9–11.9) | 0.423 |
| 2019 | 821 | 11.0 (10.2–11.6) | 1.822 | 11.4 (10.8–11.8) | 0.831 |
| 2020 | 767 | 10.2 (9.55–10.9) | 1.653 | 10.3 (9.85–10.8) | 0.583 |
| 2021 | 844 | 11.3 (10.5–11.9) | 1.845 | 11.5 (11.0–12.0) | 0.721 |
| 2022 | 977 | 13.0 (12.2–13.8) | 1.975 | 12.3 (11.8–12.8) | 0.065 |
| 2023 | 1.028 | 13.7 (12.9–14.5) | 2.167 | 13.5 (13.0–14.0) | 0.352 |
| Semiannually periods | |||||
| January–June | 3.677 | 49.0 (47.9–50.1) | 7.969 | 49.8 (48.9–50.5) | 0.844 |
| July–December | 3.820 | 51.0 (49.8–52.0) | 8.048 | 50.2 (49.4–51.0) | 0.156 |
| Quarter of the year | |||||
| January – March | 1.817 | 24.2 (23.2–25.2) | 3.891 | 24.3 (23.6–24.9) | 0.538 |
| April – June | 1.860 | 24.8 (23.8–25.8) | 4.078 | 25.5 (24.7–26.1) | 0.858 |
| July – September | 1.899 | 25.3 (24.3–26.3) | 3.974 | 24.8 (24.1–25.4) | 0.196 |
| October–December | 1.921 | 25.6 (24.6–26.6) | 4.074 | 25.4 (24.7–26.1) | 0.379 |
| Geographical area †† | |||||
| Andean | 4.670 | 62.3 (61.1–63.3) | 10.150 | 63.4 (62.6–64.1) | 0.945 |
| Caribbean | 1.120 | 14.9 (14.1–15.7) | 2.416 | 15.1 (14.5–15.6) | 0.614 |
| Pacific | 1.160 | 15.5 (14.6–16.3) | 2.373 | 14.8 (14.2–15.3) | 0.094 |
| Orinoco | 334 | 4.46 (4.00–4.94) | 699 | 4.36 (4.05–4.69) | 0.375 |
| Amazon | 208 | 2.77 (2.41–3.17) | 363 | 2.27 (2.04–2.50) | 0.009 |
| Insular | 4 | 0.05 (0.01–0.13) | 14 | 0.09 (0.04–0.14) | 0.811 |
In general, the annual frequency of CS increased progressively, with the lowest and highest numbers of suicides occurring in 2015 and 2023, respectively. The semiannual and quarterly distributions were symmetrical ( Table 1). Three out of four CS events occurred during adulthood, at least 80% occurred in men, and approximately 90% occurred in people with a high-school education or less. More than half of the cases were single, and one in four were in a common-law relationship. Additionally, most CS involved Colombian nationals, and approximately two-thirds occurred in departments in the Andean region, particularly in Antioquia and Bogotá ( Table 1, Table S1).
Tables 1 and S1 compare the frequencies of CS on weekends and weekdays using a Binomial distribution (X ~ B(n, p)). Overall, no statistically significant differences were found in CS frequencies between weekdays and weekends over the nine years analyzed. Among the variables evaluated, four characteristics showed a higher frequency of CS on weekends: early adulthood, basic or high-school education, the Amazon region, and common-law marital status (p < 0.05). In addition, only 5 of 33 departments showed a higher frequency of CS on weekends (Fig. 1).
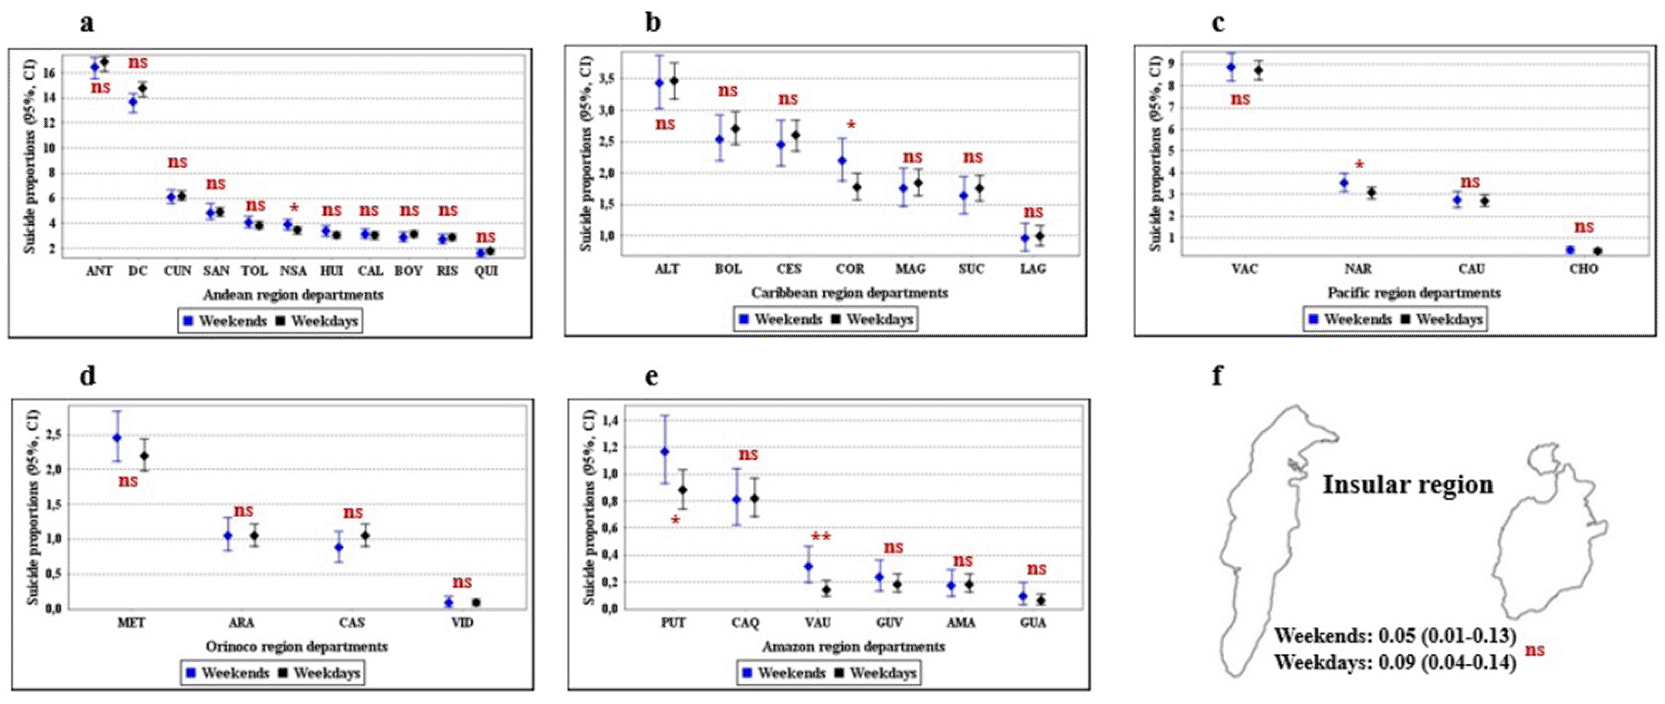
Each table (Fig. 1a to Fig. 1f) shows the frequency (%, 95%, CI) of suicides on weekends and weekdays in the six geopolitical regions of Colombia. The departments are found by the abbreviations of the ISO-3166 system. Statistical differences between weekends and weekdays are identified with asterisks (P-Value <0.05*, <0.01**, <0.001***) and the absence of statistical differences with ns (not significant).
Tables 2 and S2 compare the frequencies of CS on weekends and weekdays using a Poisson distribution (X ~ Poi(λ)). For each year of the study period, the average number of CS per day on weekends (λweekends) was higher than the average number of CS per day on weekdays (λweekdays). Additionally, across the other dimensions analyzed, 17 characteristics showed higher λ_weekend than λweekdays (p < 0.05). Likewise, λweekends was higher in 16 of 33 departments (p < 0.05) (Fig. 2).
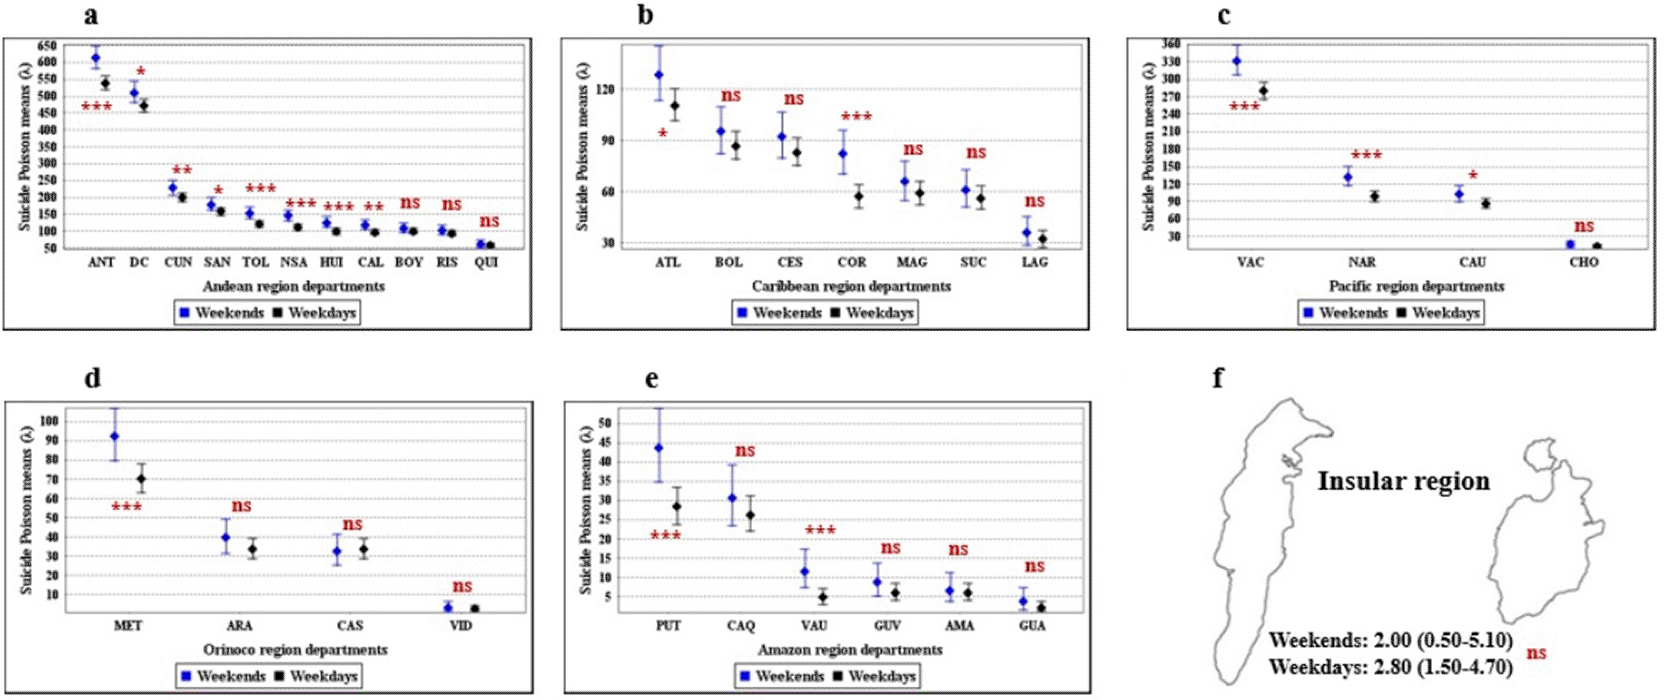
Each table (Fig. 2a to Fig. 2f) shows the average number of suicides per day (λ, 95%, CI) on weekends and weekdays in the six geopolitical regions of Colombia. The departments are found by the abbreviations of the ISO-3166 system. Statistical differences between weekends and weekdays are identified with asterisks (P-Value <0.05*, <0.01**, <0.001***) and the absence of statistical differences with ns (not significant).
Finally, Figure 3 shows the CS frequency ratio calculated using the Binomial (πweekends /πweekdays) and Poisson (λweekends/λweekdays) approaches to highlight the relative excess of CS in these two periods. Overall, and across each characteristic analyzed within the person, time, and place dimensions, the relative excess of CS estimated using the Poisson approach was greater than that estimated using the Binomial approach.
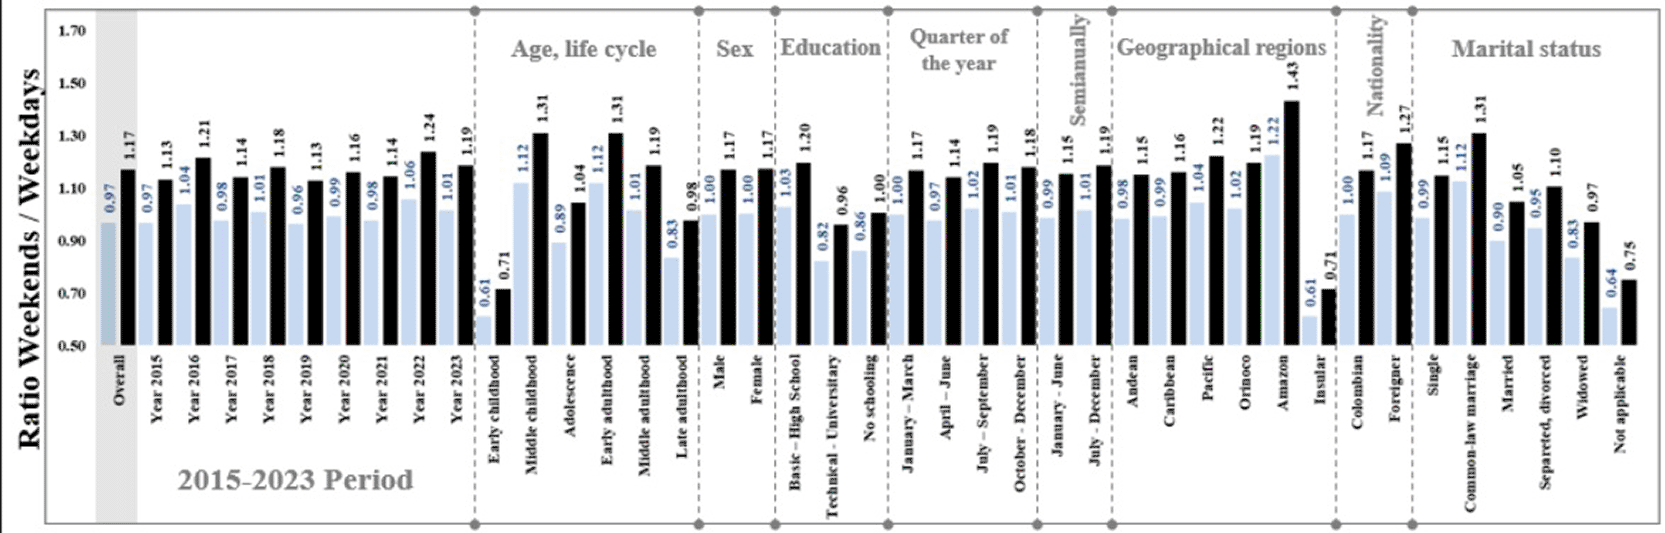
The figure shows the suicide frequency rate calculated using Binomial distribution (light blue bars, πweekends /πweekdays) and Poisson distribution (black bars, λweekends/λweekdays), according to the characteristics analyzed in the dimensions of time, person, and place. On the far left, at the beginning, the global rate is highlighted in gray.
Using an analytical cross-sectional design and administrative data from the INMLCF, we demonstrated the usefulness of the Poisson distribution compared with the Binomial distribution to confirm the presence of the WE in CS events that occurred over nine years in Colombia.
Over the past three five-year periods, Colombia has faced socioeconomic challenges that may explain the progressive increase in CS frequency. One of these was the 2014 economic crisis, which significantly increased unemployment; in the most affected departments, the frequency of CS rose by approximately 50%.21 Additionally, between 2016 and 2018, two out of three CS were related to domestic disputes or family crises, and 12% were related to economic problems.22
During the SARS-CoV-2 pandemic, CS frequency also increased, partly due to the effects of social isolation, such as anxiety, depression, domestic violence, and reduced access to mental health services. It is important to note that “social isolation” was often a misinterpretation of “physical distancing,” a non-pharmacological measure designed to minimize person-to-person transmission.23,24
Reports suggest that mental health services often face serious problems on weekends, including insufficient specialized staff for psychiatric emergencies and administrative hurdles that limit access to necessary medications.7,25 In Colombia, these weekend access barriers have not been studied; however, increased alcohol consumption has been reported during this time, often combined with other psychoactive substances that may induce agitation, impulsivity, and impaired judgment-conditions that can contribute to interpersonal and intrafamilial violence.26,27
Interpersonal and domestic violence are acute stressors that may increase the risk of CS on weekends. For example, in Colombia, 35% of CSs are associated with alcohol consumption, 20% with other psychoactive drugs, and 12% occur after episodes of domestic violence or aggression, particularly on weekends.26,28,29
In addition to the findings reported here, recent studies in various countries agree that the occurrence of suicides varies significantly by day of the week and contextual conditions associated with free time, leisure, or reduced institutional support. In Japan, Australia, and the United States, there has been a significant increase in suicides during weekends and holidays, a phenomenon that has been particularly marked in young age groups and working-age adults, with findings similar to those observed in this study.30 These patterns reinforce the hypothesis that the temporal structure of the week includes changes in routine, less work or formal supervision, greater availability of alcohol, and reduced access to health services modulate suicide risk.
In Latin American countries, several studies confirm this trend. In Peru, Roman-Lazarte et al. reported marked variations by department and documented a significant increase in suicides on Sundays, similar to that observed in Colombia and Brazil.8,31 In Argentina, Leveau et al. showed that social fragmentation increases suicide risk.32 In Mexico, Borges et al. found a predominance of CS associated with acute alcohol consumption during weekends, especially among young men, highlighting the role of impulsivity and disinhibition in suicidal behavior.26,27,33 Similarly, the combined use of alcohol and psychoactive substances increases the likelihood of a suicide attempt six- to eightfold.34,35 These findings are consistent with the results of this research and with Colombian reports in which alcohol consumption is related to about one-third of suicides and increases markedly on weekends.28
Furthermore, accumulated evidence suggests that the lack of mental health services with effective weekend coverage worsens this phenomenon. Studies in the United Kingdom, Canada, and South Korea have shown that suicide mortality is lower in regions with 24/7 community mental health services or crisis hotlines staffed by specialized clinical personnel. These interventions have reduced suicides related to periods of low care availability by 15% to 22%, supporting the need to reorganize service provision according to temporal patterns of risk.3,36,37
Finally, methodological evidence is also consistent with our findings. In analyses of rare events occurring independently over time, the Poisson distribution can provide more stable and sensitive estimates than the Binomial approach or simple proportional comparisons. Statistical studies in the temporal epidemiology of CS indicate that Poisson methods, or extensions such as multivariate Poisson models or Poisson regression with offsets, may better capture relative increases on specific days, particularly when the time windows are asymmetric, as in comparisons of two weekend days versus five weekdays.38
In conclusion, the Poisson distribution detected the weekend effect in CS more clearly than the Binomial distribution. The relative excess of suicides on weekends was more evident when analyzed using Poisson methods. These findings suggest that reorganizing mental health services according to temporal risk patterns could improve responsiveness to weekend demand.
| Views | Downloads | |
|---|---|---|
| F1000Research | - | - |
|
PubMed Central
Data from PMC are received and updated monthly.
|
- | - |
Provide sufficient details of any financial or non-financial competing interests to enable users to assess whether your comments might lead a reasonable person to question your impartiality. Consider the following examples, but note that this is not an exhaustive list:
Sign up for content alerts and receive a weekly or monthly email with all newly published articles
Already registered? Sign in
The email address should be the one you originally registered with F1000.
You registered with F1000 via Google, so we cannot reset your password.
To sign in, please click here.
If you still need help with your Google account password, please click here.
You registered with F1000 via Facebook, so we cannot reset your password.
To sign in, please click here.
If you still need help with your Facebook account password, please click here.
If your email address is registered with us, we will email you instructions to reset your password.
If you think you should have received this email but it has not arrived, please check your spam filters and/or contact for further assistance.
Comments on this article Comments (0)