Keywords
Honeybee, spike patterns, GABA, GAD, protocerebro calycal tract, spike patterns, sychrony, antisynchrony, feedback neurons
Honeybee, spike patterns, GABA, GAD, protocerebro calycal tract, spike patterns, sychrony, antisynchrony, feedback neurons
Synchrony of spike trains in the brain has a major function for the strengthening of synaptic contacts and the formation of phenomena such as long term potentiation (LTP) (reviewed by Brown et al.1). Synchrony is one proposed mechanism for the formation of a neural syntax and inhibitory interneurons are believed to play an important role in the underlying cell assembly formation2. Gap junction-mediated electrical coupling has been shown to be a potential source of not only synchrony but also asynchrony3. Apart from mere synchrony effects, axo-axonal gap junctions in blowfly visual interneurons have been proposed to introduce a linear interpolation system between coupled neurons in order to visually extract the axis of rotation4. Gap junctions between pyramidal neurons in the rat hippocampus are suggested to contribute to sharp wave/ripple local field potentials5. In the human brain, gap junction-mediated quantum entanglement of microtubules has been proposed as a mechanism for very fast states of conscious perception6. The mushroom bodies intensively studied neuropiles of the insect brain involved with learning and memory7,8. The mushroom body in each brain hemisphere of the honeybee consists of about 170 000 intrinsic Kenyon cells9. The dentritic arborizations of these cells form the cup shaped calyces which are characterized as the main input region of the mushroom body10. Each calyx of a mushroom body is further subdivided into a lip, a collar and a basal ring neuropile11. The lip receives mainly olfactory input, the collar receives visual input and the basal ring receives mixed modality sensory input11. The Kenyon cell axons are bundled and form the two peduncles that connect the input region of the mushroom body, the two calyces, with the output regions, the alpha and beta lobes12 (Figure 1, Figure 2). The modality-specific topographic organization of Kenyon cells in the calycal regions is maintained throughout the mushroom body and causes a layered pattern of the lobes11,13. Feedback neurons are apparent in the mushroom bodies of a great variety of insect species (ant (Formica rufa, F. pratensis)14, grasshopper (Acheta domesticus)15,16, fly (Musca domestica)17 and bees (Apis mellifera)11,18).
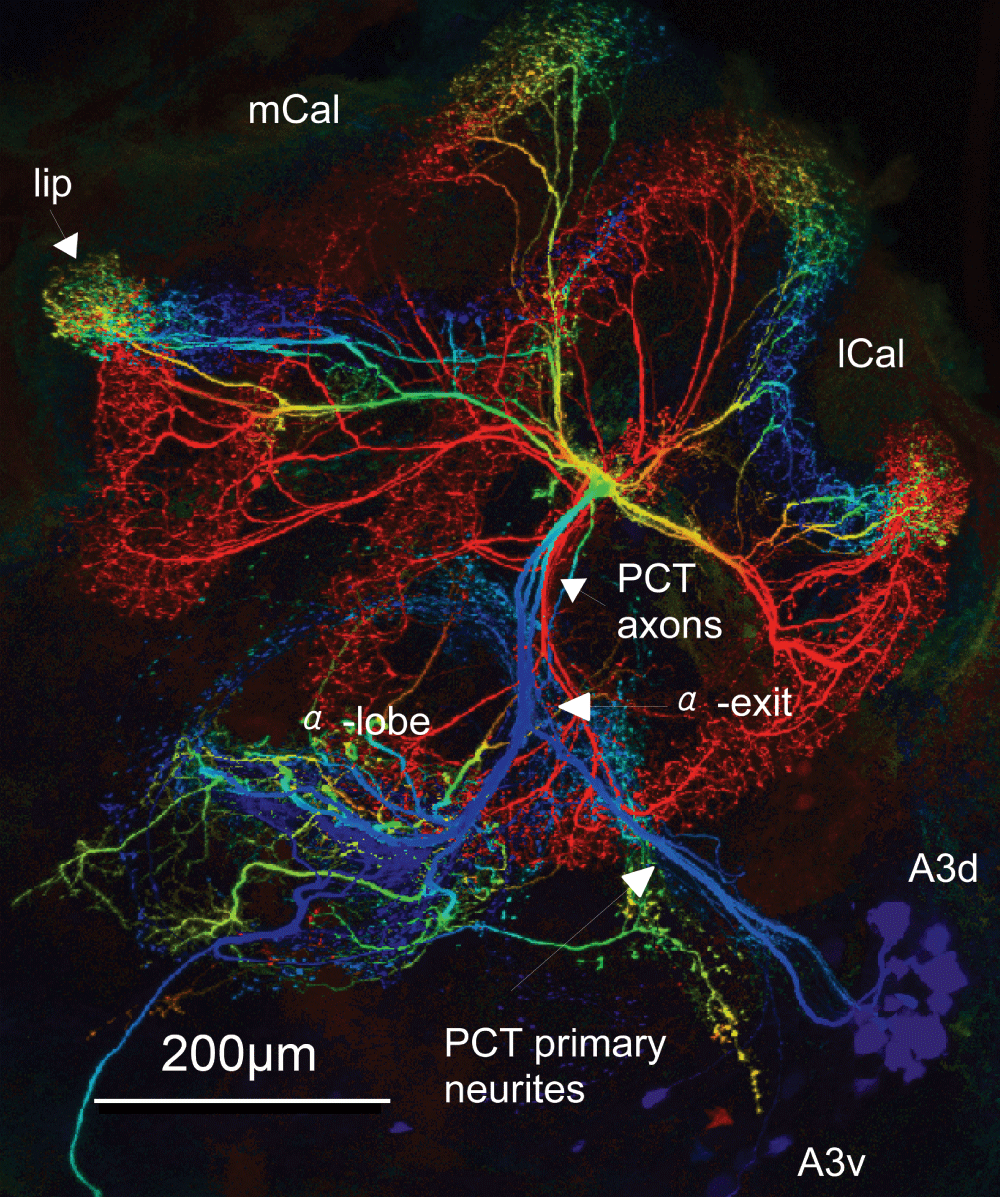
The primary neurite runs from the lateral protocerebral lobe towards the lateral margin of the alpha lobe (alpha-exit) in one hemisphere of the bee brain. Reaching the alpha lobe, the PCT bifurcates, sending dendritic branches to both the alpha lobe and parallel axonal projections towards the calyces. The lateral and median calyces (lCal, mCal) are intensely innervated by PCT neurons, especially the lip region. The resulting cup shaped dendritic innervation areas are seen on top of the figure. Depth is color coded, the ventral and dorsal somata cluster (A3v, A3d) are superficial. Warm colors indicate a deep layer (ventral), whereas cool colors indicate a superficial (dorsal) position in the brain (blue, green, yellow, red), with blue most superficial and red for the deepest layers. Confocal scanning with a factor of 100x magnification.
Protocerebro Calycal Tract (PCT) neurons are anatomically described feedback neurons in the honeybee brain, which receive inputs from the lobes and calycal regions19 and form spiny endings in the calyces which are interpreted as post-synapses10,20. It has been shown that PCT neurons do not exclusively connect corresponding regions between the calyces and lobes but also layers with different sensory modality in the mushroom body20. Due to the location of the somata in the lateral protocerebral lobe, a ventral (A3-v) and a dorsal (A3-d) cluster of feedback neurons can be distinguished13. The somata of the A3-v cluster are located in the anterior, ventral, lateral protocerebral lobe. The A3-d somata are located in the vicinity, slightly dorsal of the A3-v soma cluster13 (Figure 1). The primary neurites of both tracts run separately through the protocerebral lobe and cross half way to the alpha lobe13. Both tracts invade the alpha lobe at its lateral border, the A3-d approximately 20 µm more anterior than the A3-v13. The A3-v tract is identical to the anterior lateral protocerebral tract (a.l.p.t.), described by Mobbs11,13. The cells of the A3-v branch dichotomously in the protocerebral lobe, dorsolaterally to the alpha lobe. One branch continues in the PCT, the other branch benches ventrally and enters the alpha lobe at its lateral margin, the alpha exit point11 (Figure 1). The whole bee brain is shown in Figure 3B. The PCT neurons form layered innervation patterns in the alpha lobe. Some branches run posterior to the alpha lobe, in parallel to the Kenyon cells, towards the beta lobe (orange dendrites in Figure 2). The branch towards the beta lobe is more prominent for A3-d PCT neurons. The dendrites run via the alpha-lobe-to-beta-lobe-tract (a-b.t.13) and invade the beta lobe at its lateral margin at a depth of approximately 160 µm. The second branch of A3-v PCT neurons runs via the inner ring tract (i.r.t.11) towards the ipsilateral calyces. A3-v-PCTs innervate the entire calycal neuropile. Nevertheless, the highest density of dendritic branches of A3-v PCT neurons has been observed in a small region between the collar and basal ring (dorsal basal ring, d-br,13). The lip and the basal ring neuropiles are also common targets of A3-v innervation. In the lobe region postsynaptic spines have been described13.
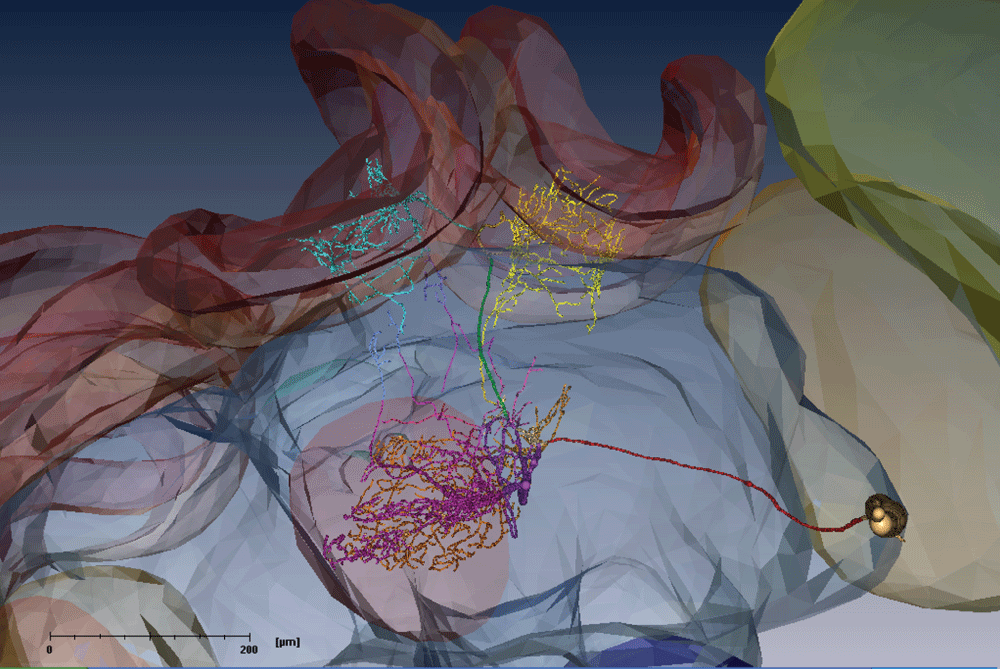
Unlike most PCT neurons stained in the examples beforehand, this PCT neuron has no dendrites in the calyces. The dendritic arborizations are restricted to the pedunculi (cyan and yellow). Additionally, the neuron has large dentritic trees in the alpha (magenta) and beta (orange) lobes.
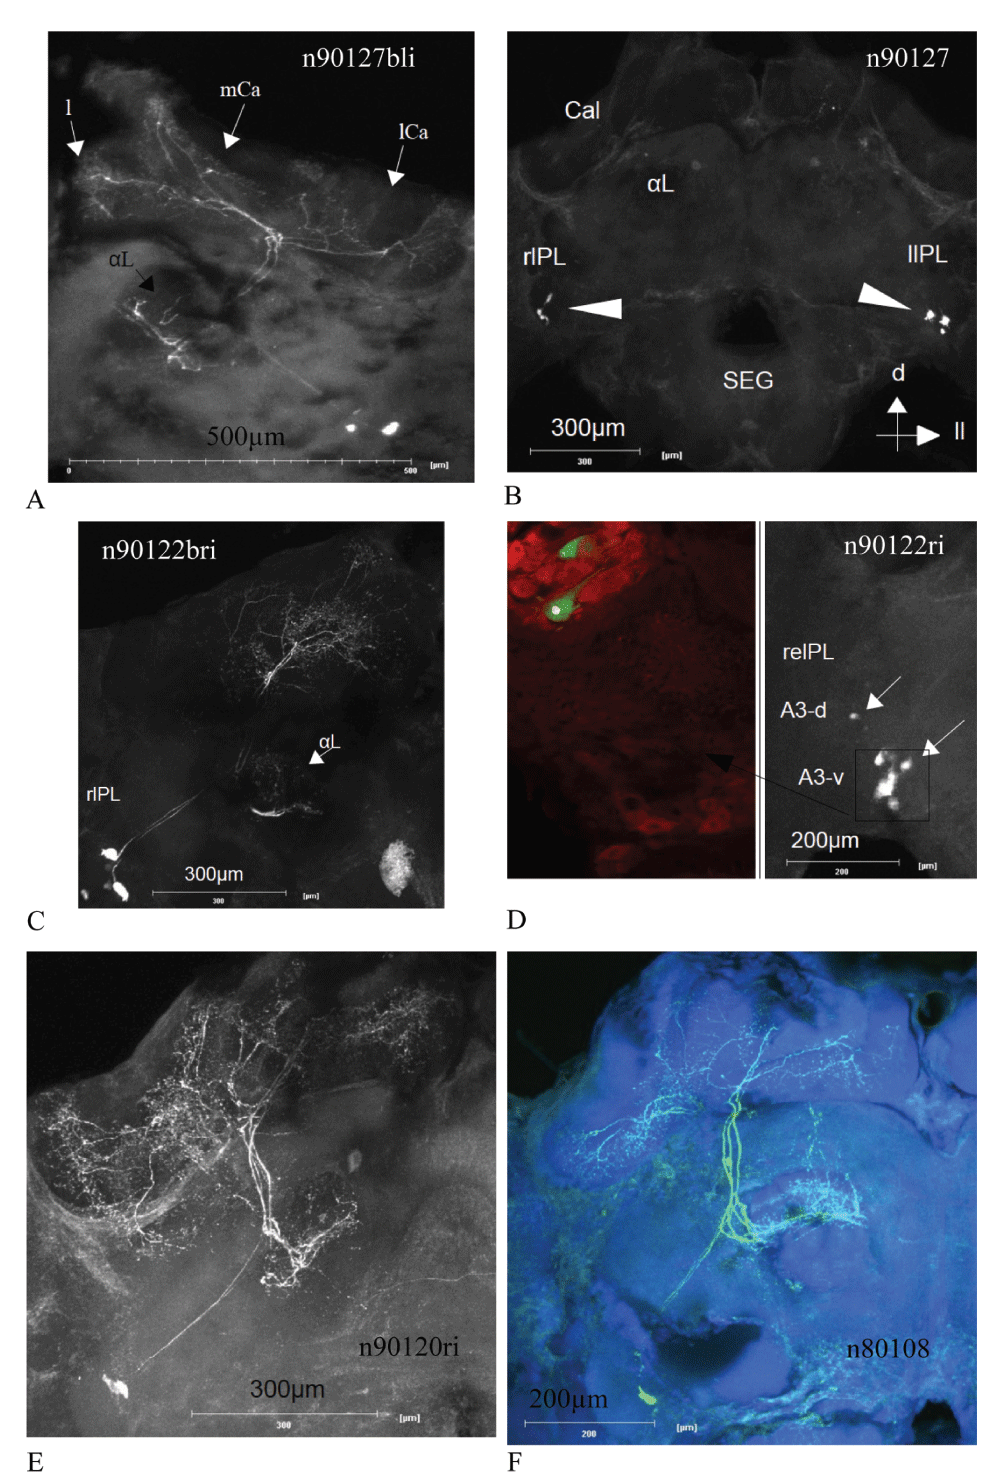
The images are anatomical correlates for the recordings presented in Figure 4. Identification of PCT neurons was achieved by either full staining (panels A, C, E and F) or characteristic soma clusters (panels B and D). Panel B gives an overview of a whole bee brain, with right and left lateral protocerebral lobe (rlPL, llPL), subesophageal ganglion (SEG), alpha lobe (α-L) and calyces (Cal). The arrowheads indicate the PCT soma cluster. The arrows indicate dorsal (d) and lateral left (ll) direction. In panel A, the median and lateral Calyx (mCa, lCa) as well as the lip region (l) are indicated for one brain hemisphere. The inset in panel D corresponds to the colocalization between some intracellularly stained PCT somata of the ventral cluster (A3v). The anti-GABA staining is color coded in red, a colocalization with the intracellular staining (white) is indicated in green (200x magnification). The region of the nucleus does not contain any GABA staining and is therefore seen as small white spot (panel D, inset).
The majority of PCT neurons are GABAergic18 and in locusts, GABAergic interconnections have been shown between the lobes21. The occurrence of post- and presynaptic GABAergic terminals in the lobes has been confirmed in the bee brain22. For the A3-v PCT neurons with dendritic arborizations in the basal ring as well as pedunculus neuropile, claw-like dendritic endings have been observed. In contrast, the majority of dendritic endings for A3-v neurons that arborize in the basal ring reveal a round, bleb like character13. The physiological properties of PCT neurons are less uniform. The spontaneous firing rate is between 0 and 45 Hz20 or between 0 and 24 Hz and bursts occur frequently23. The spontaneous activity is not homogenous with respect to the spike distribution. The intracellular recorded spikes at the lateral margin of the alpha-lobe are lacking clear after-hyperpolarization "spikelets"23. Grünewald23 observed phasic-tonic excitatory responses (3.3–48 Hz above the respective spontaneous activity) to odorant stimulation, with a 500 ms phasic period after a latency of 75 to 128 ms. 22% of feedback neurons showed excitatory off-responses with a short duration but longer latency than on-responses23. Typically, their response to stimuli is excitatory with an extended latency between the stimulus and the increase in spike rate (25–70 ms for light stimuli, up to 400 ms for odorants)20. Nevertheless, inhibitory responses to odor stimuli have been observed20. PCT neurons respond to different sensory modalities, for example visual, olfactory or tactile stimulation but not movement20. The responses of PCT neurons to odor stimulation are more different between neurons for the same odor than in the same neuron for different odorants23. The relative spike rate is decreased after one trial odor conditioning in contrast to sensitisation23. 92% of the PCT neurons show excitatory responses after stimulation of the ipsilateral antenna with sugar solution23. Gronenberg20 observed after-effects, which are responses with latencies longer than 500 ms (up to 30 s after stimulation has been observed). Interestingly, Gronenberg20 described complex spike characteristics in an individual feedback neuron, which completely changed its response characteristics regarding latency, spike frequency and response type (inhibitory vs. excitatory) during the experiment.
This article aims to investigate the functional relationship between anatomy and physiology in PCT GABAergic feedback neurons in the mushroom body of the bee brain. The experimental results presented here point towards the occurrence of electric coupling between PCT neurons. This hypothesis will be discussed in the context of recent findings and earlier results.
No specific permissions were required for the experiments with invertebrates (honey bees), owned by Freie Universität Berlin.
Forager honey bees (Apis mellifera, n=7) were caught from a winter indoor flight room with small glass vessels. The bees were chilled on ice and fixed in small plastic holders with a slit for the neck. The head was additionally stabilized towards the holder with a small piece of plastic sheet, which was adjusted with beeswax. The body was held in place with wax inside the recording chamber to prevent turning movement of the body against the head. After a recovery period of 30 minutes in a dark and moist chamber, the bees were fed to saturation with 1.25 M sucrose solution. At least one hour later the bees were operated on. The antennae were fixed with Eicosan (Sigma-Aldrich, Germany) to the head capsule. The mandibular muscles were cut and the mandibles fixed with Eicosan to the recording chamber in order to prevent movement artefacts. A trapezoid shaped cut at the clypeus between antennal joints and mandibles allowed for the removal of the oesophagus. The reference electrode was placed in the median ocellus. The head capsule was cut between the ocelli, compound eyes and antennae (without damaging the antennal nerves) in order to make the brain accessible. Trachea on the surface of the brain and mandibular glands were removed with a fine forceps. The bees’ abdomen was pressed with a piece of wax (Boxing wax sticks, Kerr Corporation, United States) in order to prevent pumping movements. A two component silicon sealant (Kwik-Sil, World Precision Instruments, Inc., United States) was used to build a fluid barrier and stabilization ring at the border of the window in the head capsule. After polymerization of the two component silicon ring, the single, fluid component A was used as surface medium on top of the brain tissue in order to prevent drying.
Borosilicate glass capillaries with filament (Hilgenberg, Germany) were used for intracellular recordings (outer diameter 1 mm, length 75 mm, wall thickness 0.21 mm). A laser puller (P-2000, Sutter Instrument Co., United States) was used for capillary production. The resulting electrode resistance was between 100 and 300 Mohm, depending on the dye filling. The tip of the capillary was filled with a 5% solution of Neurobiotin Tracer (Vector Laboratories Inc., United States) in 0.2 M or 1 M K-Acetate. The electrode was inserted with a micromanipulator under visual control on the lateral margin of the alpha lobe towards the lateral protocerebral lobe neuropile at three o'clock for the left alpha lobe and nine o'clock for the right one. The onset of tissue contact to the glass capillary was indicated by the silencing of an acoustic signal (Intra767, Electrometer, World Precision Instruments, United States). From the offset of the acoustic signal for the touching point of the tissue surface, the electrode was slowly driven into the brain until a depth of 60 to 160 µm was reached. Analogue data were visualized with an oscilloscope (630, Voltcraft, United Kingdom). For data acquisition, the combination of Spike2 software and the corresponding analogue to digital converter (Micro 1401 MKII, Cambridge Electronic Design, CED) was used with a sampling rate of 20 000 Hz. Intracellular stainings (Neurobiotin) was achieved by iontophoresis with a depolarizing current of 3–4 nA for a duration of 10–20 minutes. The staining procedure was observed and interrupted in the case of unstable recordings.
Spike2 was used to control a relais card (or8, bmcm, Germany) which was connected to different odor valves (The Lee Company, United States). A continuously presented air stream (1.5 m/s) without odorant was applied throughout the experiments. During the presentation of an odor the valve switched from the neutral airstream to an odorant laden airstream. The strength of the air stream was constant throughout the experiments. Each odorant supplier was filled with a small piece of filter paper, soaked with 2 µl of one odorant (orange oil, carnation oil, linalool, limonene, cineole, geraniol, hexanol, nonanol, hexanal, heptanal, octanal, 2-nonanone or 2-octanone). Blue, green, white and UV light were presented manually with an LED device. Both the olfactory and the visual stimulation took place for a duration of 4 s. Tactile stimulation was induced by a dry toothpick towards the antennae. For sugar stimulation the toothpick was soaked in 1.25 M sugar solution. The sugar stimulation consisted of one short touch towards the antennae.
The post iontophoresis circulation time in the living bee took at least 3 h or overnight in a dark and moist chamber with a temperature of 20°C. Afterwards the Kwik Sil was removed from the brain. The pre-fixed brain was dissected from the head capsule and thereafter carefully lifted from the silicon layer. The brain in the head capsule was pre-fixed in 4% paraformaldehyde (PFA, Electron Microscopy Science, United States) in PBS (NaCl: 137 mM, KCl: 2.7 mM, Na2HPO4: 8 mM, KH2PO4: 1.4 mM, pH: 7.2) for 30 minutes. The brain was carefully removed from the head capsule, the silicon and surrounding tissues as well as the trachea. The brain was retained in PFA solution during this cleaning procedure. Each brain was separately fixed for an additional 4–6 h in 500 µl 4% PFA solution in a small glass vessel. The fixed brain was dehydrated in an alcohol series on a shaker at room temperature (at 50%, 70% , 90%, 99% and then 3 times at 100% ethanol and step wise back to 50% ethanol again, each step taking 10 minutes). Subsequently the brain was washed in PBS on a shaker for 10 minutes twice at room temperature and incubated in 1% TX (TritonX, Sigma, Germany) in PBS for 2 h on a shaker at room temperature. The Streptavidin conjugation (Cy5, dianova, Germany) took place over night but not longer than 20 h at 4°C on a shaker in a Streptavidin Cy5 solution 1:1000 in PBS plus 1 µl sodium acid (saturated stock solution). For confocal microscopy 1 µl of a 5% Lucifer Yellow (Invitrogen, Germany) solution in Aqua Dest (custom made) was added to achieve a background staining of the brain neuropile. From this step on the preparation was light sensitive and needed to be shielded from bleaching. Unbound Streptavidin was removed from the brain via 6 washing cycles in PBS at room temperature on a shaker (brief washing for 10 minutes, 20 minutes, two times 30 minutes and one time 60 minutes). For dehydration, an ascending alcohol series was used (50%, 70%, 90%, 99%, and twice at 100%, each step for 10 minutes on a shaker at room temperature). Afterwards the brain was stored and cleared (tissue transparency was required for confocal microscopy) either in methylsalicylate (Roth, Germany) or in a 2:1 mixture of benzylbenzoate and benzyl alcohol (Sigma, Germany). Prior to storage in methylsalicylate, the brains were washed twice for 15 minutes at room temperature on a shaker or at least twice for 30 minutes in the benzylbenzoate benzylalcohol mixture. In order to apply an antibody staining in addition to the intracellular staining, the brains were washed in a descending ethanol series, to bring them back into PBS (as described before, twice at 100%, then 99%, 90%, 70%, and 50% ethanol and PBS, each step for 10 minutes on a shaker at room temperature). The brains were dried on a piece of absorbent tissue and subsequently embedded in agarose gel (0.3 g agarose in 5 ml PBS). A Leica vibratome (VT 1000 S, Germany) was used to achieve vertical sections of 50, 80 or 100 µm thickness. The slices were washed 3 times for 30 minutes in 1% TX on a shaker at room temperature. Unspecific binding sites were blocked with 10% Normal Goat Serum (NGS, Invitrogen, Germany) in PBS 1% TX for 1 h on a shaker at room temperature. The incubation in the primary antibody (rat anti-rabbit GABA, Sigma A2052 Germany, 1:400 in PBS 1% TX plus sodium acid and NGS) took 6 days at 4°C on a shaker. Subsequently the brain was washed 6×30 minutes in PBS 1% TX and thereafter incubated in the secondary antibody (goat anti-rabbit Cy5, Cy3 or Cy2, 1:200 in PBS 1% TX plus 1 µl sodium acid) for 3 days on a shaker at 4°C. The slices were washed for 30 minutes in PBS 1% TX and 5 times for 30 minutes in PBS at room temperature on a shaker. The slices were transferred in 60% glycerine in PBS and finally in 80% glycerine in PBS for confocal microscopy.
Additionally, antibody staining against glutamic acid decarboxylase (GAD, Millipore, Chemikon, United States, AB 1511, GAD67GAD65) were conducted. The procedure was the same as described for GABA except bovine serum albumin (BSA, Sigma, Germany) was used for blocking instead of NGS.
For confocal microscopy (Leica TCS, Germany), the whole mounts were cleared in methylsalicylate or a mixture of benzyl alcohol and benzyl benzoate, as described previously and the slices in 80% glycerine in PBS. The whole mounts were embedded on metal microscope slides with a hole (diameter approximately 1 cm) in the middle. A cover slip was fixed on top of the hole with super glue on the metal surface. The resulting cavity was big enough to allow for embedding of the whole bee brain.
Three lasers were used for the excitation of fluorescent dyes. Cy5 was excited with an He/Ne laser at 633 nm wavelength, Cy3 as well as micro Ruby (Invitrogen, Germany) and tetramethylrodamine (TRITC) were excited with the He/Gre laser at 543 nm, Cy2 and Lucifer yellow were excited with the Ar/Kr Laser at 488 nm wavelength. If one brain was excited with 633 nm as well as 543 nm, sequential scanning was used in order to prevent cross excitation and bleaching. The PMT (photo multiplier tubes) was chosen between 400 V and 500 V, and for intensity compensation in whole mounts, the PMT setting "linear by gain" was chosen. The offset was between 0 and -1 (background subtraction). For the scanning procedure, the beam expander 6, the format 1024×1024 and the frame average 2–3 was used. In the case of the 20× magnification water objective scanning steps of 1.5 to 2 µm were used, with 10× magnification water and air objectives up to 2.5 µm steps were used. Slices were scanned with 40× oil or glycerine objectives.
The gray scale of the confocal slices was reconstructed with the skeleton tree tool (Amira). Two additional algorithms allowed for a thickness adjustment and straightening on the basis of the grey scale data of the scans and the skeleton tree. Background neuropile staining with Lucifer Yellow or the (less clear) Streptavidin background were used to reconstruct the neuropiles. In accordance with the standard atlas of the honeybee brain24 the neuropiles were subdivided as follows: mushroom body with alpha lobe, beta lobe, pedunculus, medial and lateral calyx. The calyces were subdivided into lip, collar and basal ring. Additionally the protocerebrum with the central body was labelled. During the affine registration the labelled brain was coarsely adjusted to the standard brain. An affine transformation of the skeleton tree was necessary to adjust the neuron to the stretched neuropiles. During the last step, the elastic registration and transformation, a fine tuning to the standard brain was achieved.
This time consuming procedure was used for qualitatively excellent single neuron staining. In other cases the neurons have been visualized with less elaborate Amira tools, such as projection views, volrens, ortho slices or isosurfaces (Amira version 5.2).
The raw intracellular recording channels were high pass filtered (high pass 220 Hz, transition gap 150 Hz, in most cases) with the program digital filters in Spike2 (CED, United Kingdom) in order to eliminate baseline fluctuations. This procedure was necessary in order to set a continuous threshold for the spike sorting (Spike2, CED, United Kingdom). The spike sorting result was confirmed by principal component analysis (Figure 4). Only separated scatterplots in the 3D space have been used as different units. Nevertheless, errors due to the sorting procedure cannot be excluded. Taking this inevitably occurring inaccuracy into account, the results of the spike sorting were called ‘units’. For each set of units, extracted from one recording, the coefficient of correlation (Spearman’s Rho, MATLAB 2010, Simulink) was calculated. Since long term effects have been described for PCT neurons20, unbinned spike times and binned spiketimes (1 s bins) were calculated and used for the correlation measurement. The correlation measurement of original (unbinned) spike times of different unit pairs was done in order to measure simultaneous spiking on the millisecond timescale. On the other hand, the comparison on the level of 1 s bins of unit spike times includes the correlation of spike trains (bursts). Only in the case of antisynchrony of spike trains on the longer timescale (1 s bins) can the effect be seen by eye (Figure 5). Antisynchrony on the short timescale (unbinned spike times) can also be achieved by the alternating occurrence of two units (unit1, unit2, unit1, unit2...etc.). A negative coefficient of correlation on the short timescale is the rule, rather than the exception. Contrarily, synchrony on the short time scale is a strong hint for the measurement of potentials of different cells. Potentials in a single (non-electrically coupled) cell should theoretically have a low coefficient of correlation (low synchrony) for original spike times on the short timescale (original spike times) due to the refractory period. In order to achieve maximal transparency, both values were calculated and summarized in Table 1.
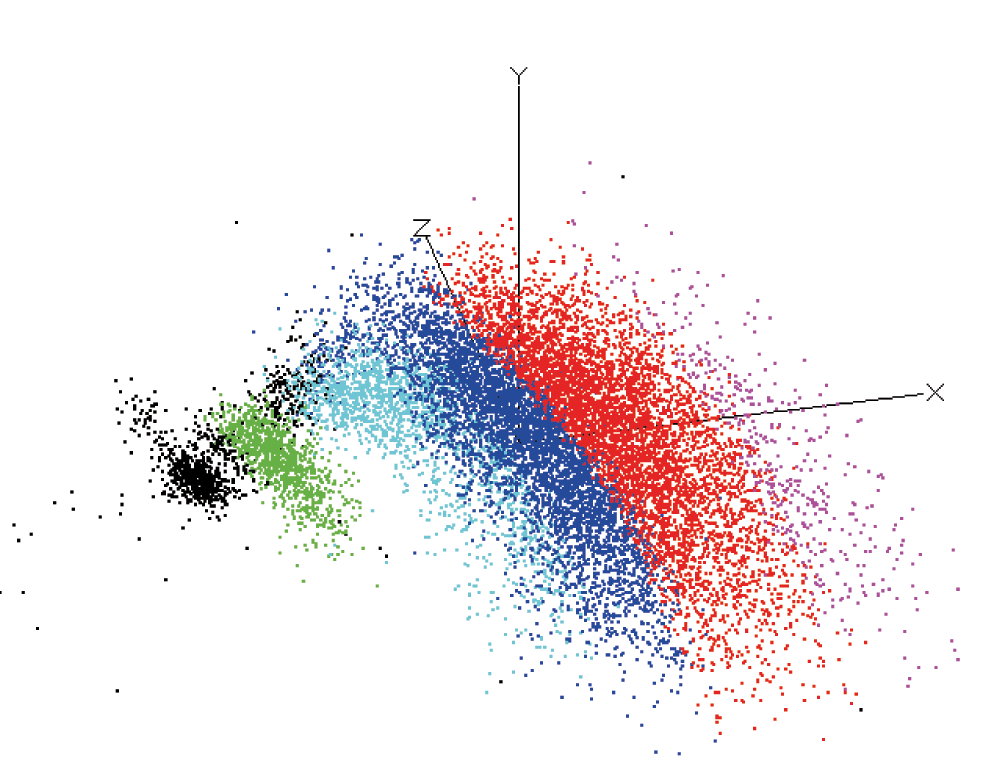
The result (the example here is from bee n80108 with 5 units) was used in order to estimate the quality of the sorting result. Only spatially (3D) separated clusters have been recognized as different units.
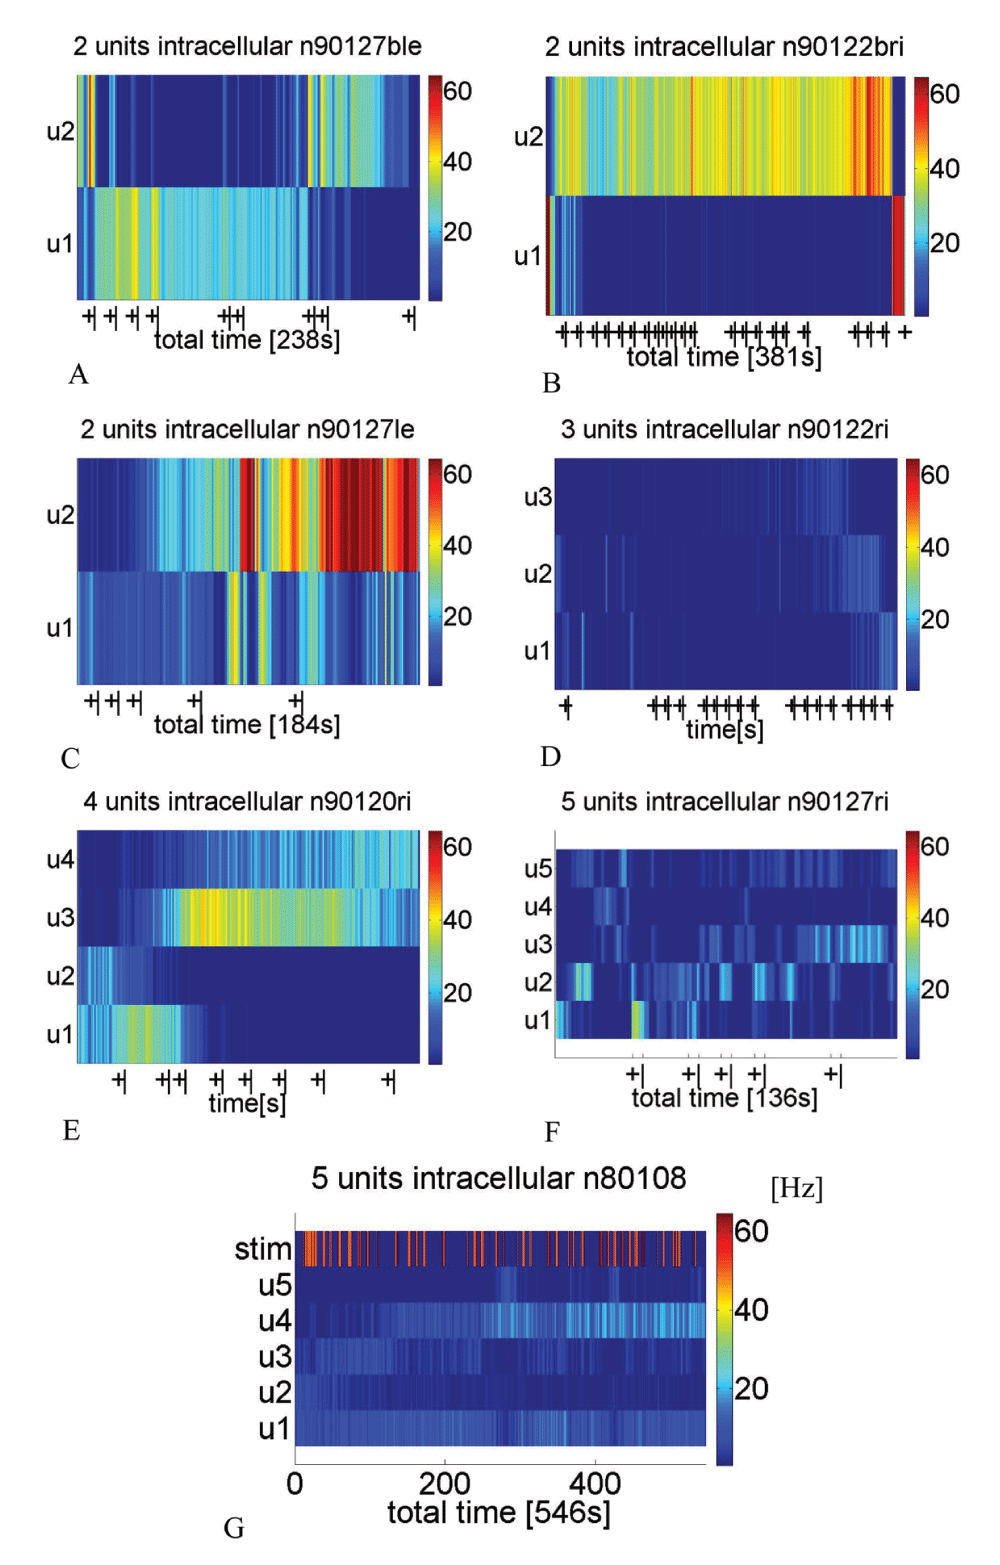
The plus and minus signs below panels indicate the on- and offset of stimulations. In panel G the stimuli have been applied manually and are encoded as red stripes in the first row. Spike frequency (Hz, 1 s bins) is color coded, as indicated in the color bar on the right side of each panel. Each panel contains 2 to 5 units. The following stimuli were applied: A [4× linalool (Lol), 2× octanone (8one), 2× heptanal (7al) and 1× hexanol (6ol)]; B [2× ipsiantennal sugar water (sipsi), contraantennal sugar water (scontra), tactile ipsiantennal stimulation (tipsi), 5× cineole (Col), 4× 8one, 2× 8one plus white light, white light, green light]; C [3× Lol and 2× Lol plus simultaneous presentation of white light]; D [2× sipsi, 1× scontra, 1× tipsi, 5× Col stimulation, 4× 8one stimulation, 2× 8one plus white light stimulation, 1× white light and 1× green light stimulation]; E [sipsi, 2× 6ol, 6ol plus green light, green light, white light, 6ol, nonanone (9one)]; F [5× Lol]; G [2× blowing, 7× Col, 4× orange, 1× Lol, 6× geraniole, 3× Lol, 2× limonene, 3× 1-nonanol, 7× clove, 2× orange, 1× blowing]. The stimulation events are shown in more detail in the peri stimulus time histograms in Figure 6, Figure 7, Figure 9 and Figure 10.
Dye coupling of the recorded PCT neurons occurred in every successful Neurobiotin injection (Figure 3A–F, for examples) except one anatomically exceptional PCT neuron, with no arborizations in the calycal region of the mushroom body neuropile (Figure 2). Furthermore, the recordings of such dye coupled neurons revealed different spike shapes and amplitudes, which were sorted with a spike sorting algorithm (Spike2). In comparison to the single stained PCT neuron, mentioned beforehand, the spike amplitudes of dye-coupled PCT neurons were rather low (about 10 mV, Figure 6, Figure 7) and therefore called "spikelets". In order to account for possible errors due to the spike sorting procedure, the resulting sorted spikes are called units. The sorting results have been checked by a principal component analysis (example in Figure 4). Only anatomically identified PCT staining, without additionally stained non-PCT neurons, have been used for further analysis. Some neurons are completely stained (Figure 3A, C, E and F), others are identified by the characteristic soma clusters (Figure 3B and D). Multiple spike or spikelet shapes as well as antisynchronous activity patterns of these units were visible in all recorded, dye coupled units. In Figure 5, the spike sorting results of single electrode intracellular recordings are visualized as color maps for 1 s bins of spike times.
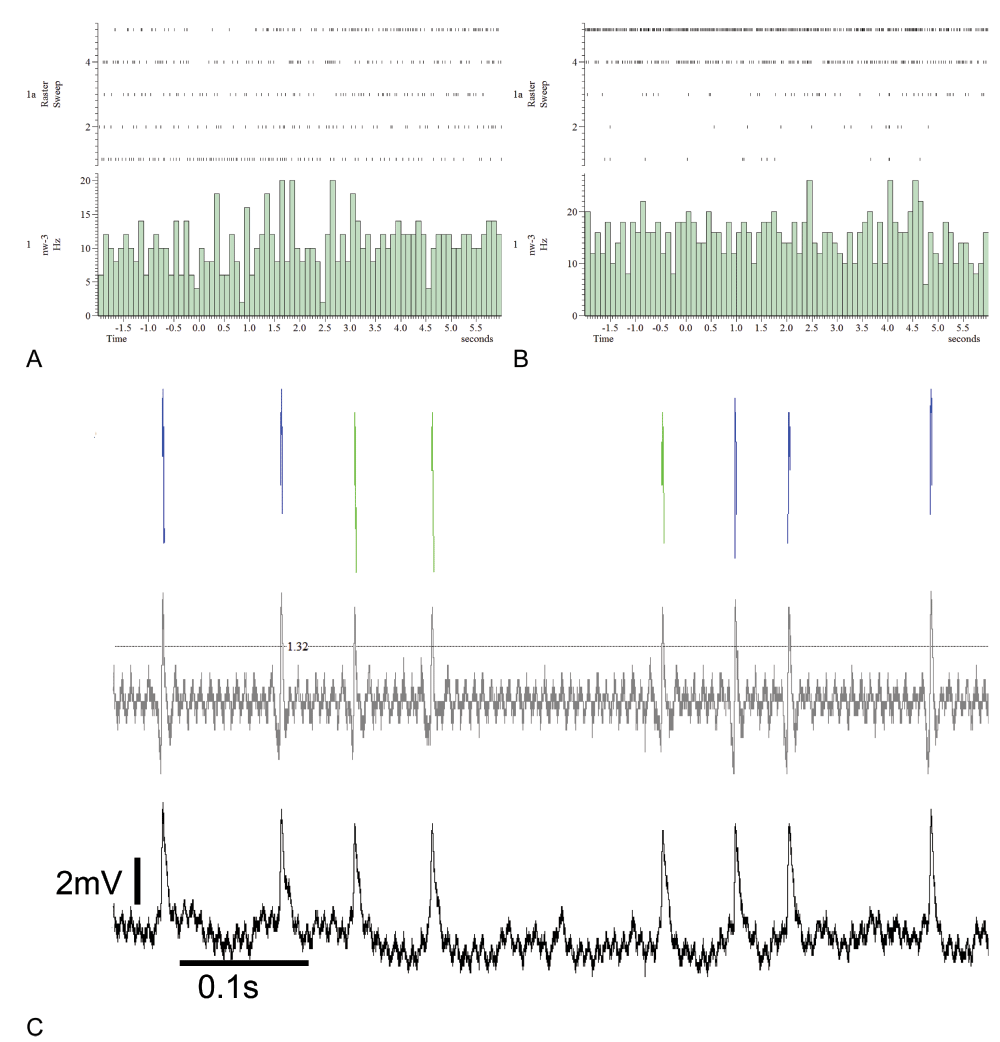
The single traces 1–3 correspond to linalool stimulations, traces 4 and 5 to linalool and simultaneous white light. Neither unit1 (panel A) nor unit2 (panel B) show clear alterations in the spike rate due to the stimulation. To extract the units from the single electrode recordings, the raw data (panel C, black trace) have been high pass filtered (panel C, grey trace, high pass: 100 Hz, transition gap: 50). Spikelets of unit1 are shown in blue, unit2 spikelets in green.
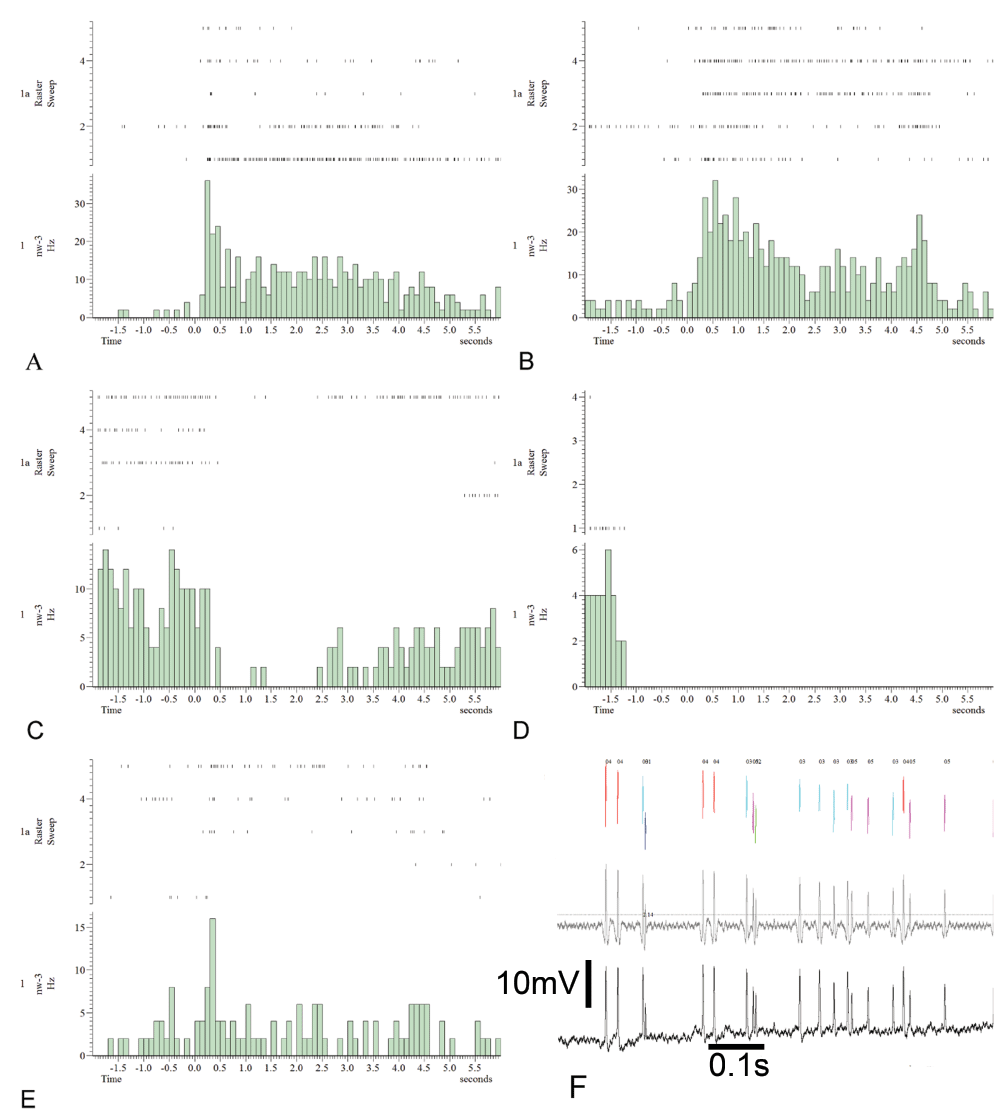
Unit1 (panel A), unit2 (panel B) and unit5 (panel E) show an increase in the firing rate during stimulation with linalool. Unit3 firing rate is decreased during linalool application (panel C). Unit4 has only very short activity periods (panel D). Interestingly, the unit1 response, with a phasic and a tonic component, decreases from trials 1–5 whereas the unit5 response, with an almost pure phasic activity, increases from trials 1–5. Unit2 phasic-tonic activity is oscillating, but almost constant over trials. Unit3 activity increases from trials 1–5, but no spikes occur during the first 2 seconds of linalool stimulation. The raw data of the single electrode intracellular recording (panel F, black trace) have been high pass filtered (panel F, grey trace, high pass: 100 Hz, transition gap: 50). The sorting result is shown in the colored channel.
The coefficient of correlation was calculated in order to estimate the degree of synchrony for pairs of units on two time scales (Table 1). Direct spike times (short time scale, labelled s) and 1 s binned spike occurrences (longer time scale, labelled l) were compared. The pairwise unit activity results are summarized in Table 1, including the coefficient of correlation (Spearman’s Rho, labelled SR). Antisynchrony (negative coefficient of correlation) on both timescales occurred the most often (eight unit pairs). Seven unit pairs are synchronous (positive coefficient of correlation) on the short timescale (original spike times) but antisynchronous on the larger timescale (1 s bins). Antisynchrony on the short but synchrony on the large time scale occurred in six cases. In eight cases, antisynchronous spiking for the short or long time scale is observed without a trend on the other timescale. In two cases, synchronous unit pairs were observed on both the short and the longer timescale. In one case synchrony on the longer time scale occurred with no tendency for the short time scale.
Most PCT neurons can be colocalized with GABA and GAD67GAD65 immunostaining, as seen in Figure 8 (at least one intracellulary labelled cell was colocalized within each immunostaining in four out of five cases. The five dye-coupled PCT intracellular recordings revealed 23 units). In Figures 8A–G, GAD67GAD65 and GABA stainings were done simultaneously. The comparison reveals similar colocalization patterns with the intracellular staining in the somata (Figure 8A–D) as well as axonal projections (Figure 8F and G). A colocalization for GABA but not GAD67GAD65 is seen in Figure 8E. Figure 8H–L shows GABA staining of the recorded PCT neurons at different cellular locations. Some somata show a colocalization with anti-GABA antibodies (Figure 8H), others do not colocalize even though GABA stained somata are seen in near vicinity (Figure 8K). The same is true for other regions of the neuron, even in the same slice. As seen in Figure 8I and J, axonal segments, indicated by a grey arrowhead in Figure 8I, and the alpha exit point are clearly colocalized with GABA (colocalization in green), whereas dendritic regions in the alpha-lobe exhibit less colocalized regions. The white arrows in panel I point towards tiny green patches of colocalization.
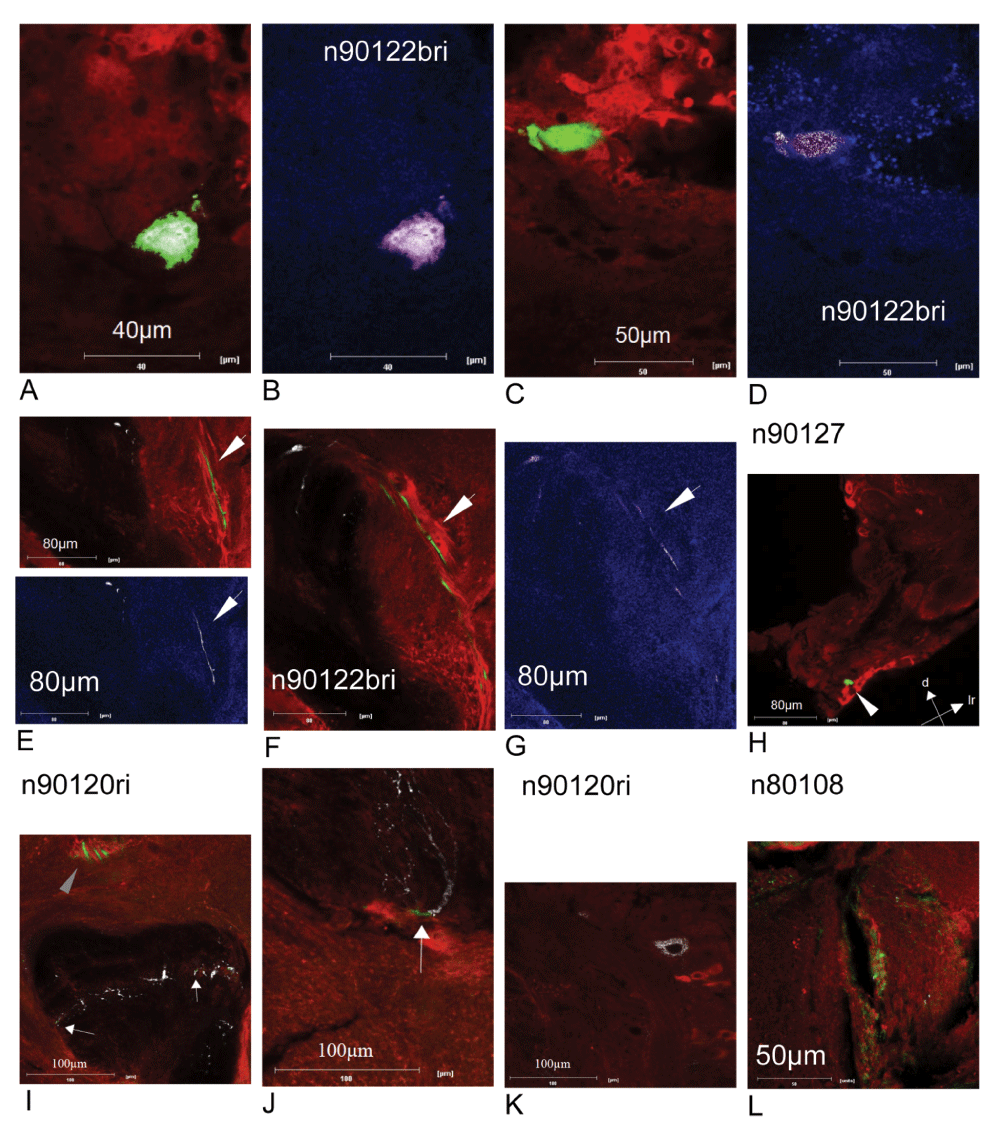
A colocalization between the GABA (red) and GAD67GAD65 (blue) staining with the intracellularly injected dye is indicated in green and magenta, respectively. Somata as well as axonal projections (arrows in panels E and F) in the intracellularly labelled Protocerebro Calycal Tract (PCT) neurons in the right brain hemisphere of bee n90122b are colocalized with GABA and GAD67GAD65 (panels A–G). The GABA colocalization is not homogenously distributed (panels H–L), even in the same slice (panels I and J, small patches of colocalization are highlighted by arrows). The regions for somata and axonal projections of PCT neurons within the bee brain are shown in Figure 1 and Figure 11.
Multimodality, as has been previously described for PCT neurons20, can be confirmed by the data, presented here. The two units in Figure 9 are responding antagonistically towards the presentation of linalool and octanone. In the case of heptanal presentation, both units decrease their spike rate. Unit2 in panel B has a generally higher signal to noise ratio in comparison to unit1 in panel A with high spontaneous activity. Not all recorded PCT neurons responded to odor stimulation, as shown in Figure 6A and B. Unit2 in panel B increases its spontaneous spike rate continuously over stimulation trials. The original recording is shown in panel C (black trace). The high pass filtered trace is indicated in grey as well as the sorted unit1 in blue and unit2 in green.
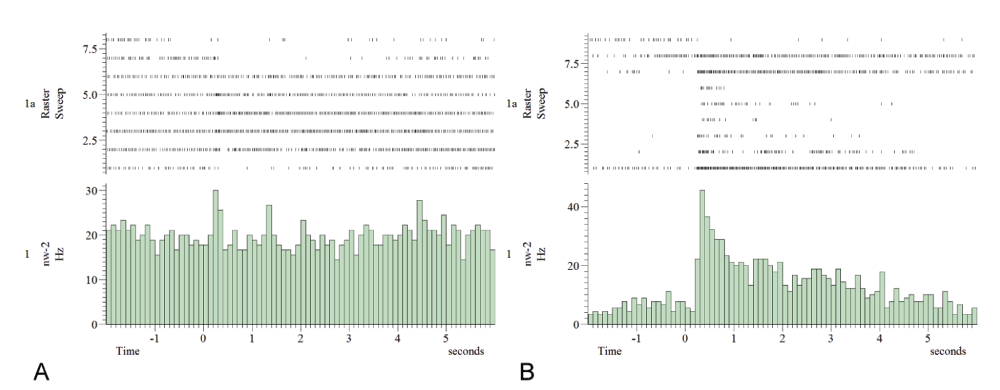
Panel A shows the frequency and single traces for unit1. In panel B the same is shown for unit2. Unit2 (B) has a lower baseline firing rate and reaches higher peak spike rates due to stimulation. The order of stimulation (trace 1 to 9 in B, trace 1 to 8 in A, because unit1 was completely silent during the last (hexanol) stimulation) is as follows: 4× linalool, 2× octanone, 2× heptanal, 1× hexanol. The response to odorants is complementary in the two recorded feedback neuron units. A decrease in the firing rate of unit2 to linalool stimulation (the first 4 trials) is accompanied by an increase in unit1. Interestingly both units change their firing rate in a similar way in response to octanone and hexanol stimulation. Oscillatory response characteristics are seen in panel B, unit2, second trace, after linalool presentation. The oscillatory pattern is characterized by undulatory spiking activity after one sensory stimulation (raster plots).
Five units were extracted via spike sorting in the right brain hemisphere in bee n90127 (Figure 7F). Unit1 (Figure 7A), unit2 (Figure 7B) and unit5 (Figure 7E) increased their firing rate during the odor stimulation (5× linalool). The unit1 response, with a phasic and a tonic component, decreases from trial 1–5 (Figure 7A). Unit2 also had a phasic and tonic component but the response strength was more or less constant along trials with an additional peak in spike rate for the offset of stimulation (Figure 7B). Unit5’s response increased in strength from trial 1–5 and is purely phasic (Figure 7E). The response of unit3 to linalool stimulation is seen as a decrease in spike rate. This becomes more pronounced from trial 1–5, because the spontaneous spike rate before and after the stimulation increases (Figure 7C). Unit4 did not respond to the odor presentations (Figure 7D). Unit4 activity decreases after the onset of odor presentations and is restricted to periods where the other units show decreased spiking activity (Figure 7D). Figure 10 gives an example of the occurrence of multisensory characteristics in some PCT neurons (Figure10B). In contrast, unit1 in honeybee n90122b only responded to the first ipsiantennal sugar stimulation (Figure10B). Spontaneous activity as well as response to stimuli increased in unit1 but decreased in unit2.
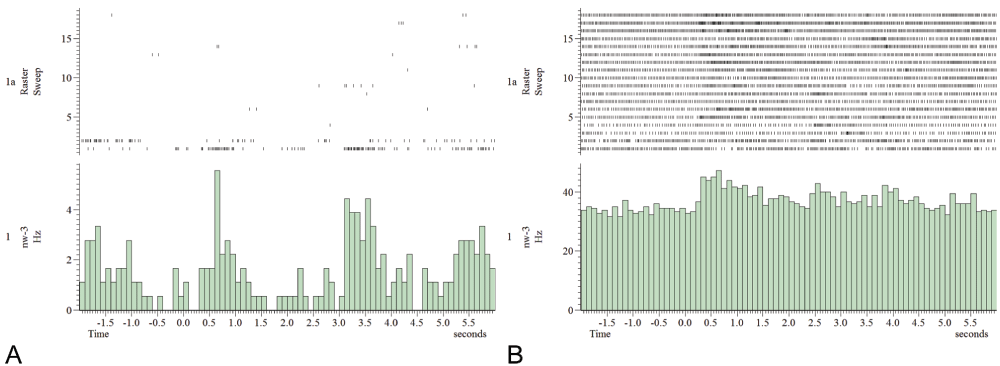
Traces 1–18 are the following stimuli: 2× ipsiantennal sugar water ×, contraantennal sugar water, tactile ipsiantennal stimulation, 5× cineole ×, 4× octanone ×, 2× octanone plus white light ×, white light, green light. Unit1 (A) is responding to the first ipsiantennal stimulation with sugar water. Subsequent unit1 spikes are very sparse. Unit2 (B) spike rate increases over trials, responding to light, sugar, odor and tactile stimuli. Oscillatory activity patterns are visible as well as variable latencies.
In order to estimate the spike sorting accuracy, a single stained PCT neuron, which probably had no gap junction connections, was analyzed in the same way as the other recordings. This PCT neuron did not show any dendritic arborizations in the calyces of the mushroom body. Instead, the pedunculus was innervated (color coded in yellow and cyan for the lateral and median ipsilateral mushroom body, respectively; Figure 2). The spike sorting revealed two well separated units (Figure 11A). The blue unit occurs only at the very beginning of the recording, due to tickle induced noise, which is confirmed by a principal component analysis (Figure 11B). The uniformly shaped spikes are illustrated in Figure 11C.
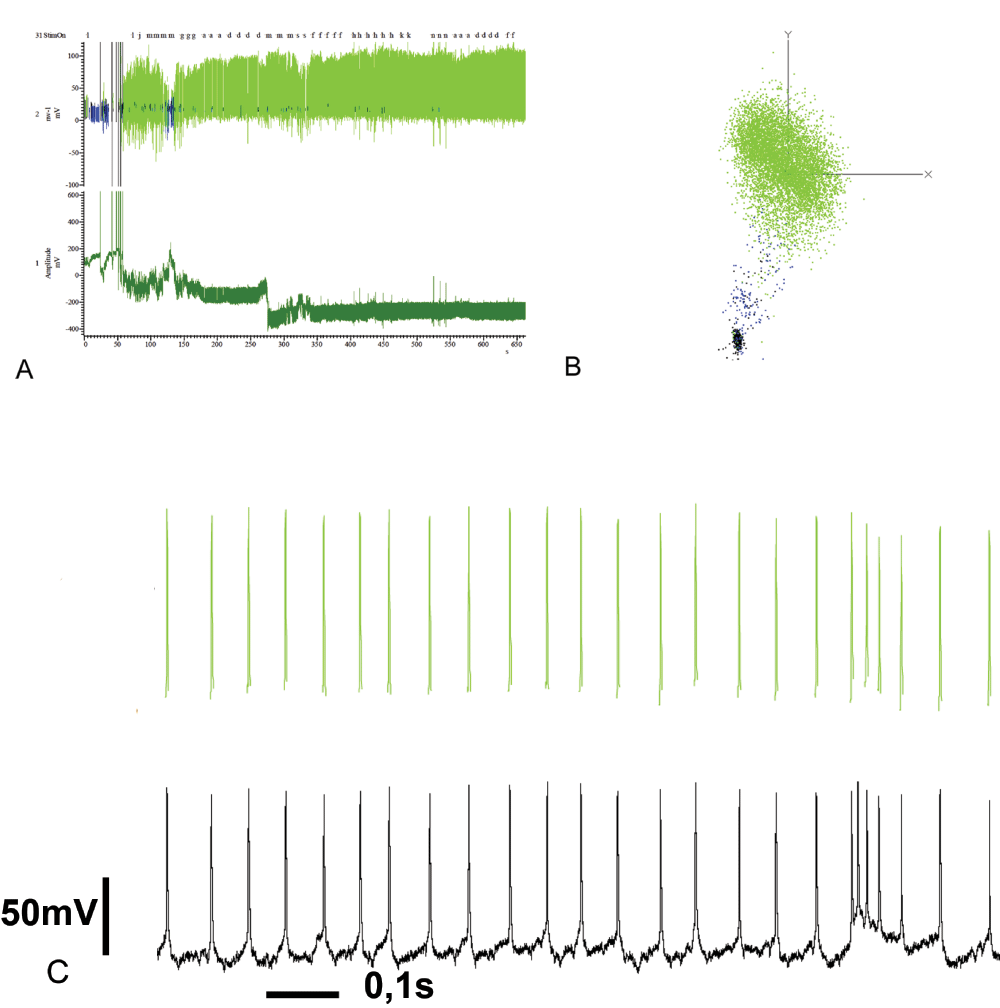
The spike sorting reveals 1 unit (green, top trace, panel A). The blue unit is due to noise (the bottom trace is the original recording). Tickle events for cell penetration are seen as large artefacts at the left border of panel A. In panel B, the principal component analysis for the spike sorting is shown. In panel C, original (black, bottom trace) and sorted spikes (green, top trace) are shown in order to estimate the similarity of spikes. The spikes occur regularly, despite some burst events, as seen on the right side of panel C. The spike amplitude is much higher in comparison to the spikelets in the dye coupled PCT neurons (for example Figure 7 and Figure 8).
This study investigated the occurrence of dye-coupling and synchrony effects of unit activity in PCT neurons.
Since single PCT neuron intracellular markings are sparse, especially with Neurobiotin (286 mw) for Neurobiotin25, it can be assumed, that electrical coupling via gap junctions occurs in PCT feedback neurons. These observations have shown that single staining is more easily achieved with Lucifer Yellow, a bigger molecule than Neurobiotin (457 mw for Lucifer Yellow25). In the following section, I will explain why gap junctions between subpopulations of PCT neurons are a parsimonious explanation for the phenomena observed in this investigation in contrast to the assumption of staining artefacts, which cannot be fully excluded. Cytoplasmic bridging seems to be unlikely, because only stable recordings have been used for analysis. Additionally, experiments with multiple neural staining other than PCT neurons have been excluded from analysis.
Let us assume that neighbouring PCT neurons are firing at their maximal rate. This might be a rare scenario but stable in terms of spike propagation. The respective refractory period of the neuron makes it impossible to propagate additional axo-axonal gap junction mediated potentials from the neighbouring cells. But what happens, if the firing rate of one PCT neuron is subthreshold with respect to the refractory period? Incoming signals from neighbouring PCT neurons, which are electrically coupled in their axonal regions, become more likely in this situation, because the cell, which is firing sparsely, is now susceptible to the propagation of laterally incoming potentials. Furthermore, the gap junction potentials are spreading bidirectionally through the invaded axon. In contrast, the spike propagation in the high frequency "potential source"-cell is unidirectional due to the refractory period. Spike coupling via gap junctions has some important implications for spike propagation including ultra fast information transfer26. Despite the observed asynchrony on the level of competing electrically coupled feedback neurons, the axo-axonal gap junctions lead to a high level of synchrony regarding the postsynaptic sites. But without feedback inhibition, this situation might be a dead end. Since the activity pattern of dye coupled ensembles consisted of fluctuating synchrony patterns on a relatively short timescale during an intracellular recording (up to 10 minutes), it is likely that a second assumption is realized in PCT neurons, that the gap junction mediated potentials are not only forward propagated (towards the calycal region) but also retrograde (towards the lobes). If the gap junction mediated, bidirectionally spreading spikes outperform the orthodromic spike initiation27 of the respective invaded PCT neuron, a retrograde signal becomes possible. Since the observed activity in the PCT is oscillatory20, the backward-feedback signal to neighbouring, electrically coupled neurons or their input sites in the lobes can be proposed as feedback inhibition of the invading cell and therefore a break against long lasting synchronization of coupled PCT neurons.
This mechanism is a realistic scenario since GABAergic cell interconnections have been observed in the mushroom body lobes21. The precise control of synchronized spike propagation in PCT neurons might be an important step in learning and memory formation in the honeybee brain. It has been shown that synchrony-dependent processes occur in the bee brain28. Axo-axonal gap junctions are involved in the initiation of sharp wave/ripple events in the hippocampus26,29. Ripple events in turn have been shown to play an important role in the acquisition of memory in rodents30. It might be possible, that PCT neurons are a source of ripple-like local field potentials in insects. Another effect of axo-axonal gap junctions between feedback neurons might be an amplification effect regarding the output sites in the calycal region of the mushroom body, as it has been proposed to be involved in ectopic spike initiation (see Bucher and Goaillard for review31). This form of electrical connection between feedback neurons could be an alternative solution for ultrafast26, high frequency and broad band transmission to other cells without the requirement for giant fibres (as has been observed in locusts32).
The hypothesis of gap junctions between PCT neurons is further supported by the single stained exceptional PCT neuron without arborizations in the calycal region of the mushroom body, but instead has dendritic trees in the ipsilateral pedunculi (Figure 2). The spike sorting results in one unit (the second unit is clearly related to noise at the beginning of the recording, see Figure 11A). The gap junctions provide a mechanism for the coupling of subpopulations of neurons, which might be a source of synchrony for the information transferred to postsynaptic sites. Additionally, it has been shown that gap junctions can be uncoupled by rising intracellular calcium concentrations and pH changes33,34. These findings implicate that gap junction-coupled neurons cannot simply be regarded as functional units but rather that gap junctions provide complex mechanisms for neural plasticity.
In conclusion, the assumption of gap junctions between dye coupled feedback neurons in the mushroom body of bees provides an explanation for several features of these neurons, including oscillatory activity and multisensory response characteristics (Figure 6, Figure 7). The exciting question that arises is whether such oscillatory gap junction-mediated subnetworks can produce ripple-like events in insects. This is especially interesting since harp wave/ripples are associated with replay mediated consolidation of memory loads in rodents30. PCT neurons are potentially suited for the reactivation of sensory information, because they are part of complex synaptic aggregations in the mushroom body input regions, called microglomeruli19. It has been shown that Picrotoxin (a GABA A receptor blocker) injection in the honeybee brain led to reduced odor discrimination while learning ability per se was not affected. Furthermore, Picrotoxin application led to desynchronization between local field potential oscillations in the antennal lobe and the firing pattern of projection neurons35. The exact mechanisms of the output level of PCT neurons remain elusive, because they depend on the targeting of PCT neuron synapses and whether these synapses are really purely GABAergic. In order to further determine the occurrence of gap junctions in mushroom body calyces it might be interesting to perform dual intracellular recordings in the near vicinity as has been done in the rat hippocampus36, simultaneous injection of Neurobiotin and a second dye incapable of passing the gap junctions and both recordings and staining after the blockade of gap junctions with carbenoxolone36 or comparative drugs.
| Views | Downloads | |
|---|---|---|
| F1000Research | - | - |
|
PubMed Central
Data from PMC are received and updated monthly.
|
- | - |
Provide sufficient details of any financial or non-financial competing interests to enable users to assess whether your comments might lead a reasonable person to question your impartiality. Consider the following examples, but note that this is not an exhaustive list:
Sign up for content alerts and receive a weekly or monthly email with all newly published articles
Already registered? Sign in
The email address should be the one you originally registered with F1000.
You registered with F1000 via Google, so we cannot reset your password.
To sign in, please click here.
If you still need help with your Google account password, please click here.
You registered with F1000 via Facebook, so we cannot reset your password.
To sign in, please click here.
If you still need help with your Facebook account password, please click here.
If your email address is registered with us, we will email you instructions to reset your password.
If you think you should have received this email but it has not arrived, please check your spam filters and/or contact for further assistance.
Comments on this article Comments (0)