Keywords
nodes, network, modularity, interactions
nodes, network, modularity, interactions
Modularity, the fact that groups of nodes within a network interact more frequently with themselves than with other nodes, is an important property of several systems, including genetic1,2, informatics3, ecological4, and socio-economic5 interactions, as well as biogeographic patterns6,7 and disease spread management8. Because of the relevance of modularity for network properties, it is important to assess it correctly. There exists several methods to measure network modularity, some of which rely on the optimization of a given criterion9,10, label propagation11, or combination of these approaches12. These methods return two elements. The first is a value of modularity for the networks, most often within the 0–1 interval. Each method often has a threshold value, above which a network is considered to be modular. Increasing values reflect an increasingly modular structure. The second element is a “community partition”, i.e. the attribution of each node to a module.
Recently, Thébault7 showed that different measures of modularity tailored to presence/absence matrices (i.e. networks in which links have no weight), gave roughly equal estimates of the significance of modularity, but differed in the community partition they returned (i.e. the identity of nodes composing each module varied). In this situation, one might look for a way to choose which community partition should be used. As the criterion that is optimized by each method is different, one possible way to compare the different community partitions is to use an a posteriori measure to quantify modularity, which can be applied to a network regardless of the method used to obtain the community partition.
An important feature of modular networks is the occurrence of interactions between nodes of different modules. They contribute to the propagation of disturbances4, flow of information13,14, and cross-regulation of biological processes15, inter alia16. In addition to measuring how modular the network is, determining to what extent modules are connected, and to identify nodes and edges responsible for connecting modules, is thus a valuable information. In this article, I propose an a posteriori measure of the proportion of interactions established between modules, i.e. edges connecting different communities. I apply this measure to the community partition identified by the Louvain method on 290 ecological networks, and show that it behaves in a similar way to other modularity measures.
In this contribution I define the realized modularity, termed QR. QR measures the extent to which edges, within a network, are established between nodes belonging to the same module. For E edges in a network, if W of them are established between members of the same module, then
When there are no between-module links, then W = E and QR takes the maximal value of 1. When between-module interactions are as numerous as within-modules interactions, then W = E/2, and QR takes the minimal value of 1/2. To express the realized modularity as a value between 0 and 1, it is expressed as:
The main advantage of QR is that it is agnostic with regard to the measure used to optimize modularity (and even to the method by which the nodes were assigned to modules, which can be arbitrary), as it acts a posteriori, i.e. after nodes have been attributed to modules. It can therefore be used to select the community detection method maximizing modularity. This measure works on most type of networks, as it makes no difference if links are directional, or if the networks is bipartite/unipartite. An illustration of this measure is given in Figure 1.
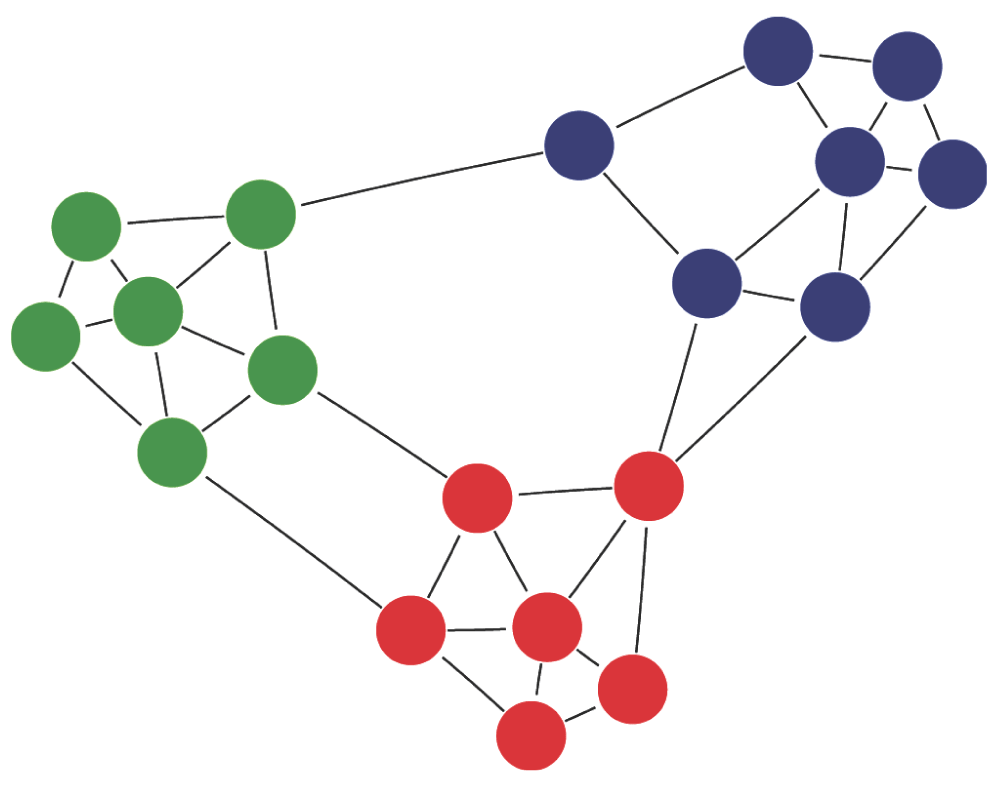
Nodes of the same modules are identified by different colors. This network has a modularity (Louvain method) of Q = 0.527. Out of the 36 interactions, 31 are established within modules, and 5 between modules. This gives a QR value of 0.86, and Q′R = 0.72.
A python implementation of this measure, using the networkx package, is proposed at https://gist.github.com/tpoisot/4947006. It reads data in the edge list format, and offers additional functions to generate null networks, as detailed in the following section.
In this section, I analyze the modular structure of a large dataset of 290 ecological networks (187 food webs and 113 host-parasite networks) published in previous meta-analyses17,18. Modularity is an important feature of ecological interaction networks, which is linked to their resilience19,20, stability7, biogeographic structure21, functioning22, and to the evolutionary mechanisms involved in their assembly23. Notably, the occurrence of interactions between and within modules plays a central role in the structure of pollination networks4, and help buffer the effect of species extinctions20.
I used the Louvain method24 to detect modules, due to its rapidity and efficiency on large networks. The Louvain method works in two steps: first it optimizes modularity locally, through clustering of neighboring nodes. These clusters are, in the second step, aggregated together, until modularity ceases to increase. This method is known to give values of modularity comparable to what is found using e.g. simulated annealing, and has been observed to give modules that have a functional relevance. Once the partition is returned by the Louvain method, I recorded its realized modularity Q′R, and its modularity Q (using the Newman and Girvan25 measure).
For each network, I compared the values of Q and Q′R on the empirical networks to their random estimate using a network null model. The null model is defined as follows. For each node n of the network, I measured its degree dn, its generality (number of successors) gn, and its vulnerability (number of predecessors) vn. In each random network, for each pair of nodes (i, j), the probability that i interacts with j is given by
and conversely for P(j→i). This null model allowed the generation of pseudo-random networks through a Bernoulli process (in each replicate, the occurrence of a link is randomly determined), with the same connectance, and the same distribution of degrees, generality, and vulnerability, as the original one (these properties are also conserved at the node level). For each of the 289 networks, 1000 pseudo-random replicates are generated. For each of them, the average value of QR and Q′R are estimated along with their 90% confidence interval. When the empirical value lies outside the confidence interval, it can be assumed that the modular structure of the network is different than expected by chance.
There is a strong, positive relationship between the values of Q′R and the values of Q (Pearsons's product-moment correlation coefficient, as implemented in R 2.1526, ρ = 0.64, 288 d.f., p < 10-6), i.e. networks for which a high modularity is detected tend to have relatively few between-module links (Figure 2). It is worth noting that some Q′R values were negative: in some cases, the best community division resulted in more interactions between than within modules. This result highlights why using an a posteriori measure is useful: other measures of modularity do not reveal the fact that there were more interactions between than within modules. Q and Q′R have different relationships with connectance (Figure 3). Increased connectance values resulted in lower modularity (ρ = –0.61, 288 d.f., p < 10-6), but had no impact on Q′R. This is a desirable property, as it allows easy comparison with the Q′R values of networks with extremely different connectances.
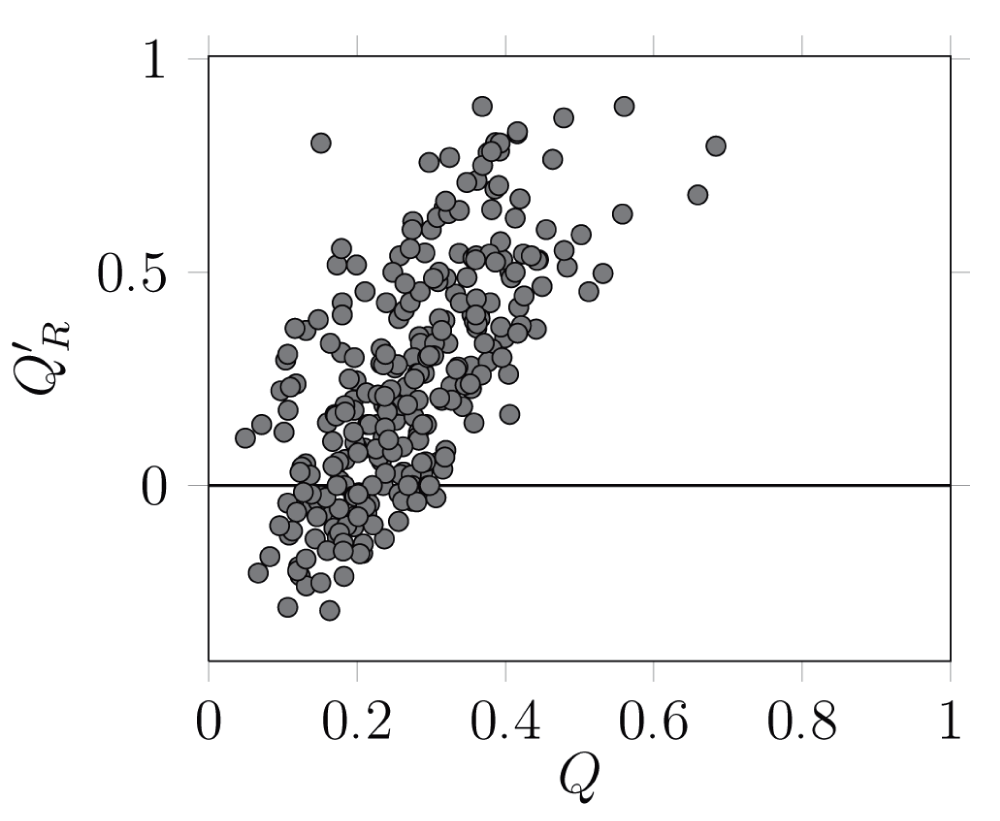
There exists a strong, positive between the two variables. Worth noting is that fact that, for some networks, the best partition resulted in negative versions of Q′R, i.e. there were more interactions between than within modules. Each dot correspond to a network.
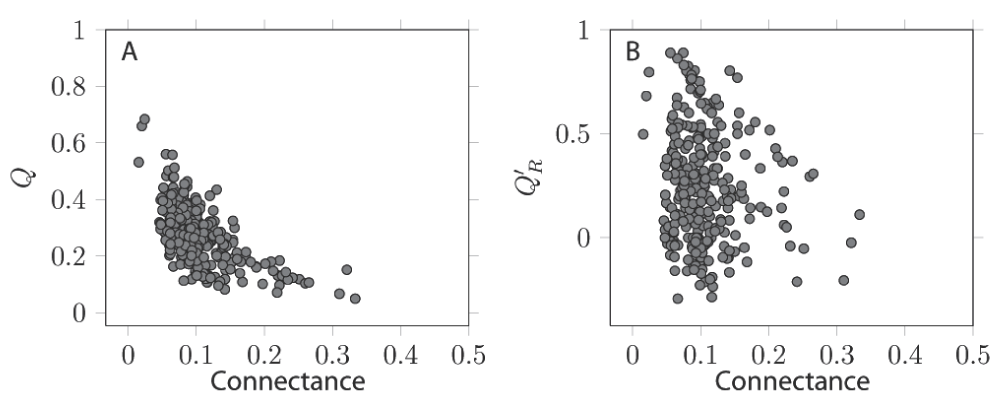
A. Q is negatively affected by connectance, i.e. densely connected networks are more likely not to be modular. B. Q′R is not affected by connectance, allowing to use it to compare different networks. Each dot correspond to a network.
There is a linear relationship between the deviation from random expectation of Q and Q′R (ρ = 0.78, 288 d.f., p < 10-6 Figure 4). The deviations (respectively ΔQ and ΔQ′R) are calculated as the empirical value, minus the average of the values on the networks generated by the null model. As an example, a ΔQ less than zero indicates that the empirical network is less modular than expected by chance.
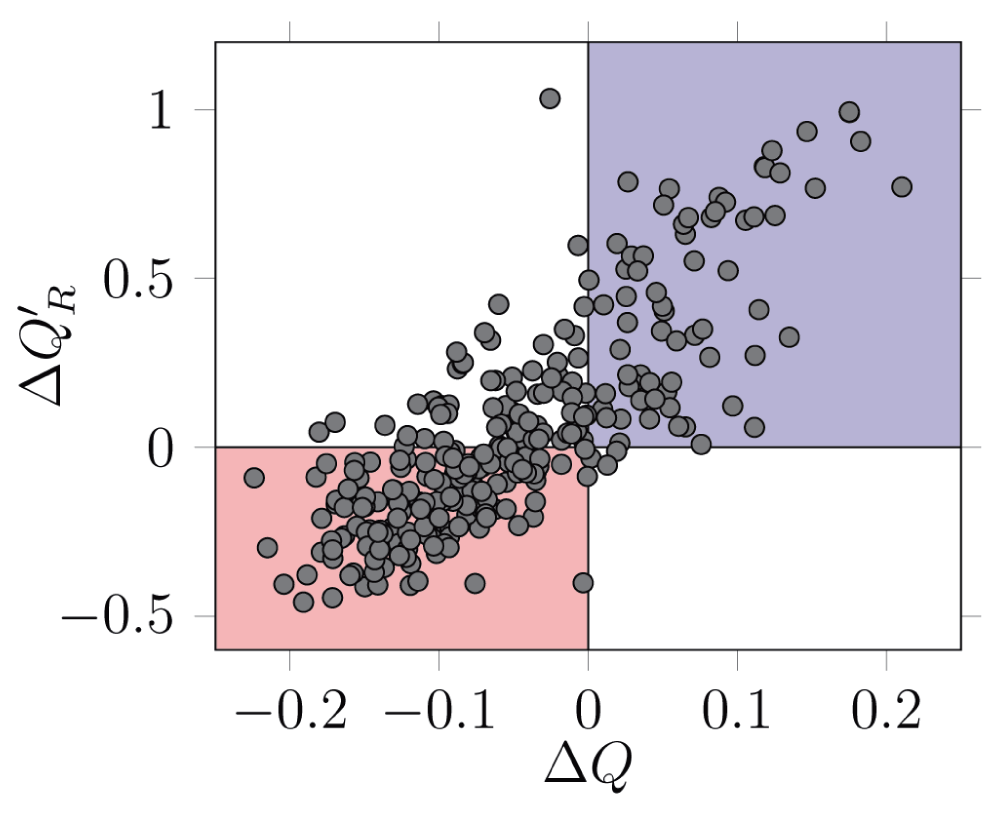
Networks in the red area are detected as being less modular than expected both by Q′R and Q, while networks in the blue area are detected as being more modular. Although the agreement between the two measures is good (see main text for statistics), some networks are detected as having a higher than expected realized modularity Q′R, despite a lower than expected modularity Q. Each dot correspond to a network.
Confidence intervals for the average of the null models were typically very narrow (not represented in the figure to avoid cluttering-see associated dataset), probably owing to the fact that the null model is restrictive on the type of networks which are generated. It is worth noting that for some networks, the diagnostic of the null model analysis conflicted. It is then worth knowing why these networks are less modular but have fewer links between modules, or conversely, than expected. This kind of analyses will help further clarify the importance of species functional role on ecological network modularity.
The Q′R measure presented here allows the estimation of the proportion of interactions established between different modules in a network. This measure can be analyzed much in the same way as other measures of modularity, but is applied a posteriori. As such, it can help choosing the “best” community partition according to the property of the network that one wants to maximize. For example, choosing the partition giving the lowest Q′R can help identify which species are more likely to act as connectors between different modules.
| Views | Downloads | |
|---|---|---|
| F1000Research | - | - |
|
PubMed Central
Data from PMC are received and updated monthly.
|
- | - |
Provide sufficient details of any financial or non-financial competing interests to enable users to assess whether your comments might lead a reasonable person to question your impartiality. Consider the following examples, but note that this is not an exhaustive list:
Sign up for content alerts and receive a weekly or monthly email with all newly published articles
Already registered? Sign in
The email address should be the one you originally registered with F1000.
You registered with F1000 via Google, so we cannot reset your password.
To sign in, please click here.
If you still need help with your Google account password, please click here.
You registered with F1000 via Facebook, so we cannot reset your password.
To sign in, please click here.
If you still need help with your Facebook account password, please click here.
If your email address is registered with us, we will email you instructions to reset your password.
If you think you should have received this email but it has not arrived, please check your spam filters and/or contact for further assistance.
Comments on this article Comments (0)