Introduction
Whole genome sequencing continues to become faster and less expensive with time; currently there are more than 2000 complete microbial genomes that are publically accessible, and the number of sequences is still growing exponentially. The availability of numerous strains from the same species has led to the development of new analyses, such as the bacterial species pan-genome1. Pan-genomic studies aim to determine differences in protein content between organisms and characterize the complete genomic repertoire of certain taxonomic groups. Therefore, comparative genomics is the first fundamental step in pan-genome analysis.
Proteins can be naturally classified into families of homologous sequences that derive from a common ancestor through a speciation event, or a duplication event2,3. As a result, comparative genomics usually starts with a sequence similarity search using standard approaches, such as a local alignment search (BLAST4, FASTA5); orthology detection and clustering (CD-HIT6, OrthoMCL7, Inparanoid8); or search tools based on Hidden Markov Models (HMM)9. The comparison of homologous sequences and analysis of their phylogenetic relationships has important implications in understanding evolutionary processes and provides very useful information regarding the structure and function of proteins10.
Here we present a tool for pan-genome analysis. It is a stand-alone tool providing several functionalities such as homology detection and genome annotation by three HMM-collections, pan-/core genome calculation within a set of proteomes, pairwise pan-/core-genome analysis, specific genome estimation for different sets of genomes as well as pairwise analysis of specific proteomes, basic statistics for the output proteins from the pan-/core-/specific-genome calculation, and finally analysis of available Gene Ontology (GO) information for the output proteins from the pan-/core-/specific-genome calculation.
Design and implementation
Approach overview
There are four basic steps in the PanFunPro approach, as shown in Figure 1: (1) genome selection; (2) functional domain collection; (3) construction of functional profiles and and protein grouping; (4) and finally, analysis of the pan, core and accessory genomes.
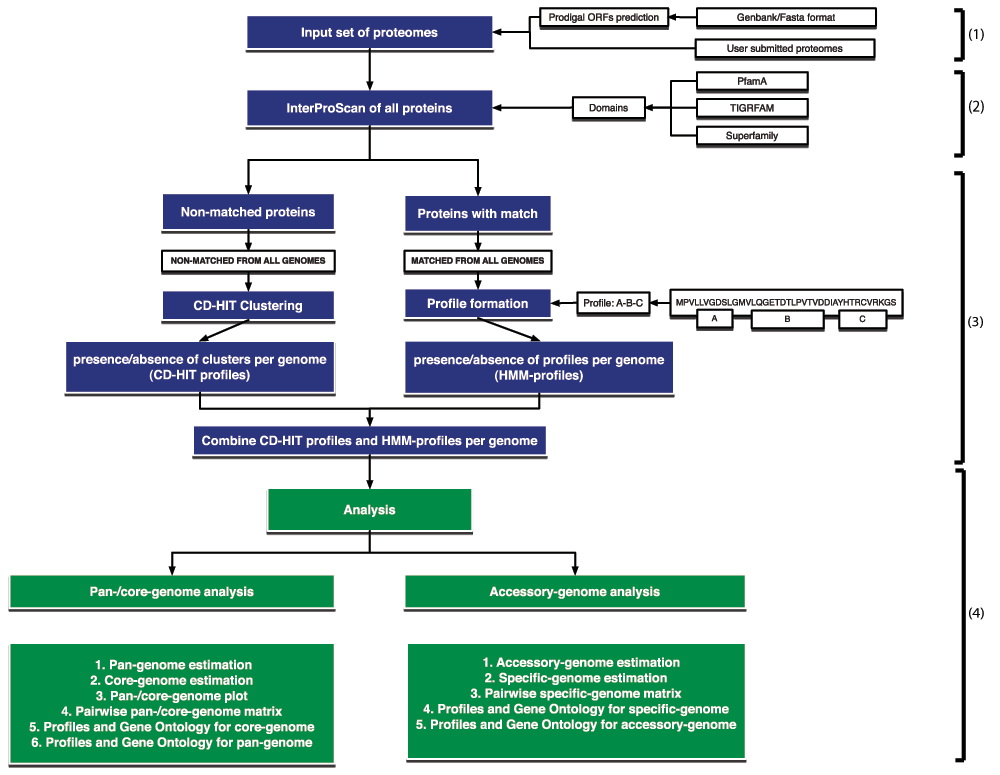
Figure 1. Schematic of the PanFunPro approach.
The method includes four basic steps: (1) genome selection; (2) functional domain collection; (3) construction of functional profiles and and protein grouping; (4) and finally, analysis of the pan, core and accessory genomes. Boxes in blue explain the profile construction steps, while green boxes indicate the possible types of analysis.
(1) Genome selection
The PanFunPro programme first imports a list of genomes, selected for analysis. Each genome is represented by a FASTA file of amino acid sequences for all the encoded proteins. In the case of DNA sequences with no annotated genes, prediction of open-reading frames (ORFs) from the DNA sequence of the genome is carried out using Prodigal software11.
(2) Acquiring the functional domains
To form a set of functional profiles for each genome, all proteins are scanned against three collections of HMMs: PfamA12, TIGRFAM13, and Superfamily14 using InterProScan software15.
(3) Construction of functional profiles and proteins grouping
Briefly, the functional profile or architecture is a combination of non-overlapping functional domains (HMMs) found in a particular protein. Only HMM hits with an E-value below 0.001 are considered significant and are used to create functional architectures. Furthermore, domains of only one database at a time are considered, meaning that if the protein has any matches in the PfamA database, the hits in the TIGRFAM and Superfamily databases are not considered. However, if the scan against the PfamA database does not result in any hit, analogously TIGRFAM and Superfamily databases are checked. HMM collections are searched in the following order: PfamA, TIGRFAM, and then Superfamily.
For each protein the functional profile name is created based on alphabetically sorted non-repeating accession numbers of all non-overlapping domains found in the protein sequence. Multiple proteins can belong to a single protein family if they share the same functional architecture, resulting in a lower number of families per genome than the reported number of proteins. Sequences with no significant matches to any searched HMM-database are collected from each of analysed genomes and clustered using the CD-HIT tool6. Clustering is implemented with a five amino acid window search, allowing two proteins to be in the same protein family if similarity between sequences is at least 60%. Resulting clusters are considered to be protein families, where the profile name is prefixed with ‘CL‘ (stands for clustering) and followed by the cluster identification number. Later, HMM-based and clustering-based protein families for each genome are joined together to form a whole genome profile collection.
(4) Analysis
The analysis is divided into two parts, as shown in Figure 1, and described in the two sections below. First, the pan-genome is estimated, along with the core-genome. A pan-/core-genome plot is created, along with a pan-/core-genome matrix. From this GO terms are determined for the core- and pan-genomes. The accessory genome is then estimated, and specific or enriched genes are determined, and as before, GO terms are calculated.
Core- and pan-genome calculation
The pan-genome is defined as the complete collection of all proteins found in a set of genomes1; in our case, this is represented by the collection of all unique functional profiles found in those genomes. Starting with the first genome, as more genomes are added, an accumulative pan-genome is constructed and the resulting pan-genome number increases with the addition of more genomes. Similarly, the core-genome is the collection of conserved proteins (functional profiles) that are conserved across the analysed genomes, and the size of the core-genome decreases as more genomes are added. Conservation data are stored as table and can be visualised in an accumulative pan-/core-genome plot. Additionally, lists of profiles, comprising the pan- and core-genomes, can be visualised as a table.
Pairwise comparison between genome is visualised as a triangle-shaped ‘matrix‘, showing the number of protein families that are shared between two proteomes, both as percentage and absolute number; as well as the total number of protein families found in both genomes. When a strain is compared to itself, the fraction of protein families with more than one member is provided. The blue colour gradient indicates homology between different genomes, and the red triangles at the bottom of the figure represent homology within a genome (e.g., duplicate proteins).
Accessory genome analysis
Differences between proteomes can be assessed by identification of accessory profiles. The accessory genome includes proteins that are present in several, but not all analysed genomes; or are specific to a particular genome or to a group of genomes. A protein is considered to be ‘specific‘ if the functional profile is present in the query set of genomes and is absent in subject set of organisms. Estimation of accessory or specific genomes requires two sets of organisms and can fit one of the following descriptions: (1) proteins present in the core-genome of the first set of genomes, and absent in the core-genome of the second set of genomes; (2) proteins present in the pan-genome of the first set of genomes, and absent in the core-genome of the second set of genomes; (3) proteins present in the core-genome of the first set of genomes, and absent in the pan-genome of the second set of genomes; (4) and proteins present in the pan-genome of the first set of genomes, and absent in the pan-genome of the second set of genomes. Descriptions (1) and (2) introduce the specific-core-genome, while descriptions (3) and (4) describe the specific-pan-genome. Given that the first and the second sets of genomes are the same, application of options (3) and (4) will yield as accessory genome of input set of genomes.
Pairwise analysis of specific content can be visualised as a square-shaped matrix, where each row represents the specific genome of one organism compared to another, while the diagonal shows the comparison to the same genome. In the matrix cells, the amount of non-shared sequences is provided as a ratio of specific genome to a total number of proteins in the query strain. When compared to the same genome result is 0. The colour intensity indicates the level of similarity, where darker green shows more specific gene families, lighter green indicates less specific gene families, and white colour shows no specific gene families.
Basic statistics and gene ontology analysis
For a given collection of genomes, the set of core, pan, and accessory proteins is calculated, and the share of PfamA-, TIGRFAM-, Superfamily-, and CD-HIT-based profiles, as well as protein length distribution are visualised using the R ggplot2 package and can be visualised as a table.
In addition, available GO16 information can be extracted. The Interproscan tool provides possible GO identification numbers (GO ID) for each domain in the profile. Consequent GO IDs for each of the profiles are searched for GO term description and grouped by more common functional category using the map2slim tool, part of the GO::Parser module. Results are visualised using the R package ggplot2.
Results
The case study
The PanFunPro approach was tested on genomes of members of the genera Lactobacillus and Streptococcus, previously used in comparative genomics study by Lukjancenko et al.17, further mentioned as a BLAST-based study. All of the Lactobacillus genomes used were from probiotic strains, whereas the genomes of the Streptococcus strains contained both pathogenic and probiotic species.
Here, we focus on the types of results PanFunPro (further mentioned as PanFunPro-based analysis) can generate: a pan-/core-genome plot; a pairwise pan-/core-genome matrix; a pairwise specific-genome matrix; distribution of database source by which protein was annotated; and finally, the distribution of predicted GO terms among profiles.
Pan- and core-genome overview
Accumulative pan- and core-genomes were calculated for both example genera and are shown in Figure 2. Analysis of the strains of the Lactobacillus genus resulted in a total of 467 core and 7009 pan gene families (Figure 2A). Most of the shared architectures consisted of PfamA domains and GO terms were available for 73% of them (Figure S1.A), whereas only 37% of the pan-genome gene families were HMM-based profiles and barely half of them had GO information available (Figure S1.B). Analysis of GO IDs distribution among the 3 general functional groups: biological process, molecular function, and cellular component, resulted in 239, 176 and 26 GOs, respectively, in the core-genome; and 470, 418 and 60 GOs, respectively, in the pan-genome.
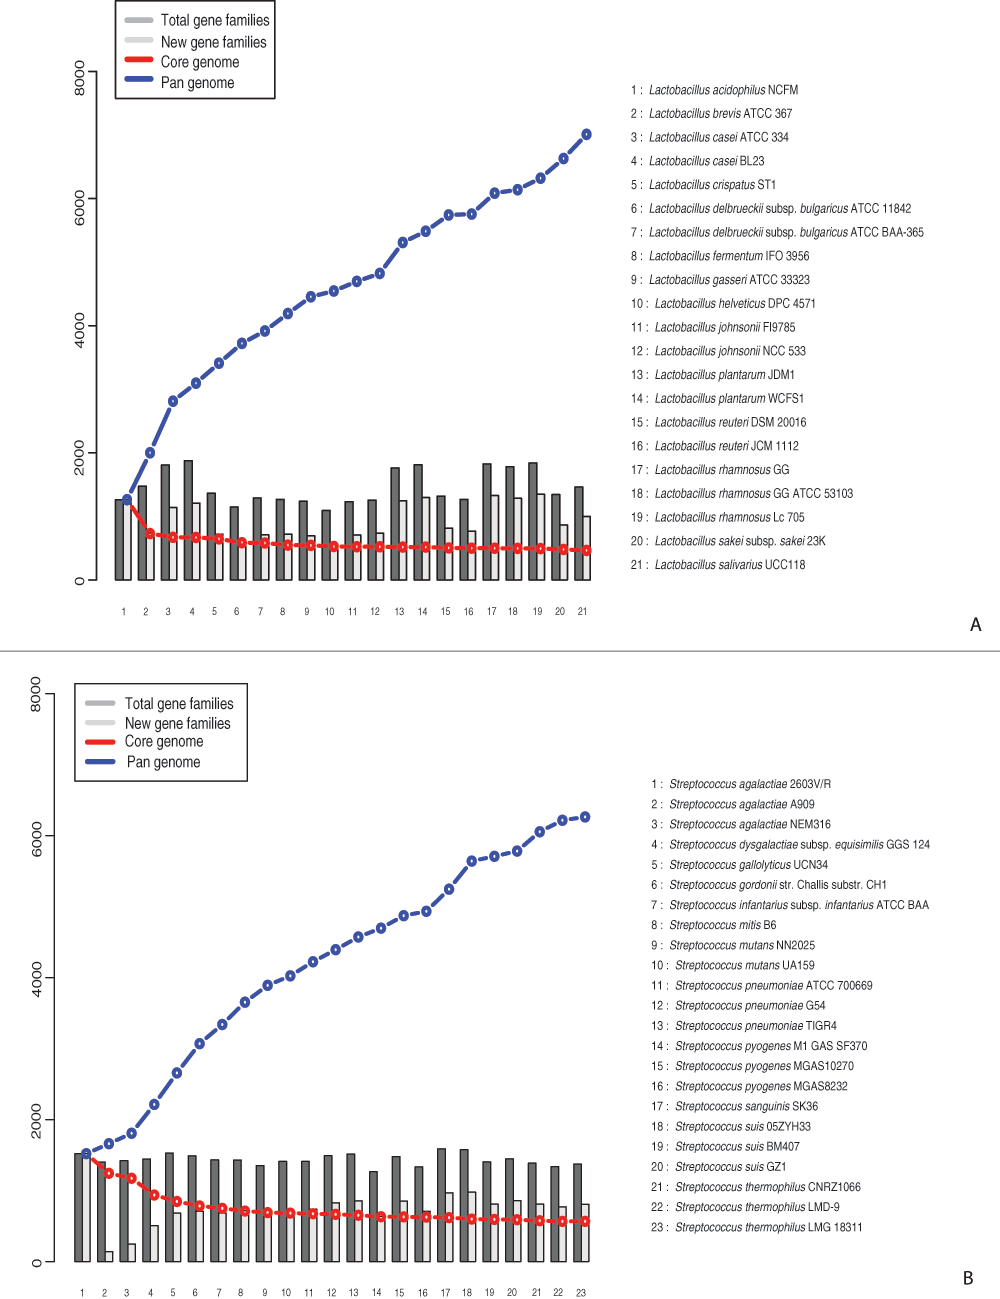
Figure 2. Pan- and core-genome plot.
A. Analysis performed on Lactobacillus genomes. B. Analysis performed on Streptococcus genomes.
A similar analysis, performed on the genomes of the strains from the genus Streptococcus, yielded 576 shared functional profiles and a total amount of 6263 architectures found within the genus (Figure 2B). Similarly to the Lactobacillus results, core-genome profiles consisted of PfamA domains and 72% of them contained GO information (Figure S2.A), whereas only 23% pan-genome profiles were based on HMM-domains and for more than half of them pathway information was accessible (Figure S2.B). Analysis of GO IDs distribution among the 3 general functional groups: biological process, molecular function, and cellular component, resulted in 269, 211 and 36 GOs, respectively, in the core-genome; and 492, 434 and 56 GOs, respectively, in the pan-genome.
Pairwise pan- and core comparison of strains within the Lactobacillus genus showed that pairs of genomes from different species share 30–60% of the protein families (profiles), while 70–90% are shared within the same species (Figure 3). Homology estimation within single proteomes revealed that approximately 20% of protein families in each genome had more than 1 member.
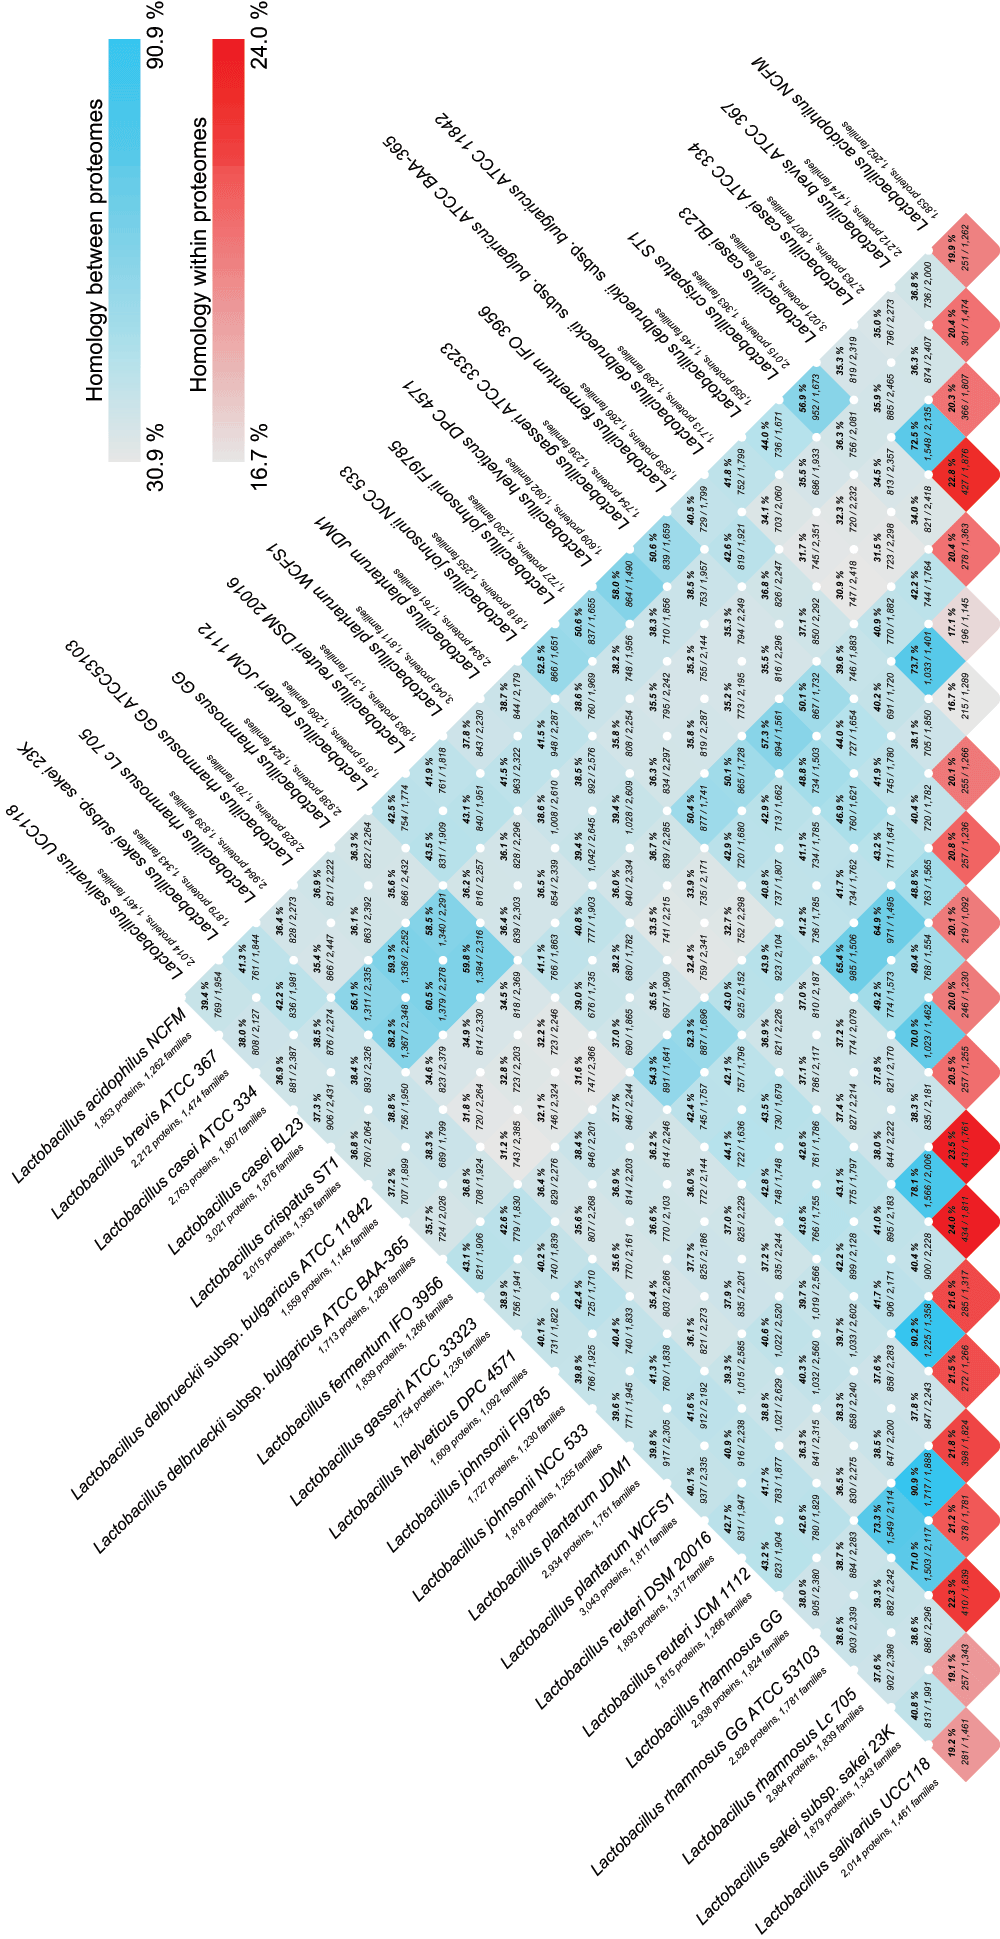
Figure 3. Pairwise pan- and core-genome comparison of strains within the Lactobacillus genus.
Comparison of core- and pan-genome analyses, performed by BLAST-based and PanFunPro-based approaches, found that typically HMM-based grouping of homologous sequences is more sensitive than BLAST-based grouping, and result in significantly reduced number of pan-genome families, 7,009 compared to 13,069 for the genus Lactobacillus, and 6,263 compared to 9,785 in the genus Streptococcus. Furthermore, the number of shared profiles increased fo the r Lactobacillus genus (363 to 467); however the core of Streptococcus genus did not follow the expansion tendency, and yielded 576 compared to 638 profiles.
Specific genome overview
Streptococcus genomes were used as an example of accessory genome analysis. The genus contains twelve species for which complete sequenced genomes are available. S. thermophilus is used in making yoghurt, and considered to be probiotic, while the other strains are pathogenic. Single representatives of each pathogenic species and all probiotic genomes were selected for specific genome analysis. Proteomes were compared in pairs to estimate the fraction of specific profiles, which are present in one genome and absent in another. The resulting overview is visualised in Figure 4. On average each pathogenic proteome contained 30–40% specific profiles compared to other species and 6–20% within the non-pathogenic species.
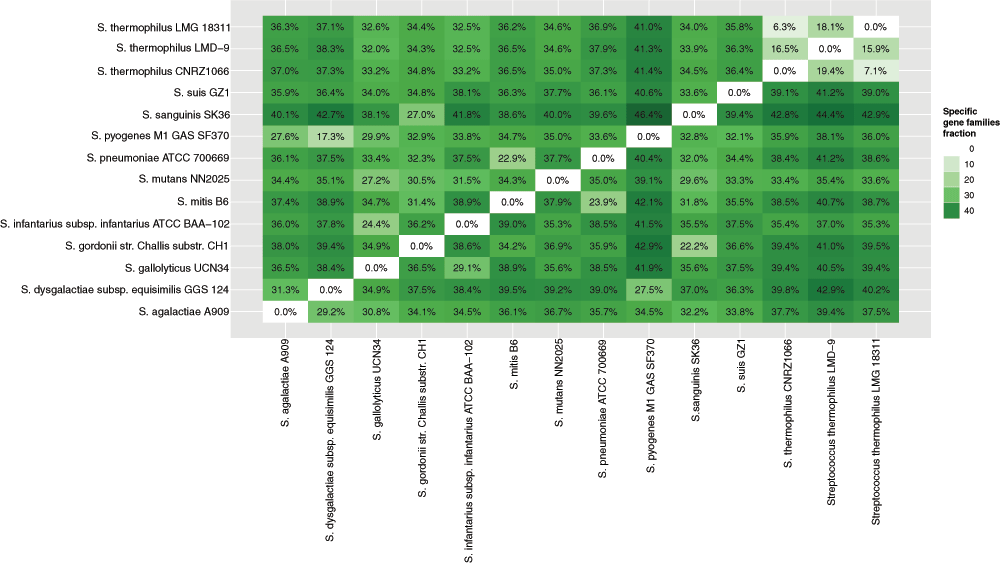
Figure 4. Pairwise specific genome comparison among species within the genus Streptococcus.
Furthermore, proteomes from pathogenic genomes were compared to non-pathogenic proteomes. Profiles, conserved in each pathogenic strain and absent in probiotic Streptococcus genomes, were considered to form specific core profiles. Specific-core-genome estimation resulted in 23 functional architectures formed from PfamA domains (Figure 5A), 14 of them contained GO information. Each protein could serve multiple functions, though more than one GO ID was available. The classification of proteins into three common gene ontology groups, as well as GO slims, are shown in Figure 5B. Specific core protein families were involved in metabolic processes, transport, signal transduction, and various binding and enzyme activity. Similar analysis of specific pan-genome for pathogenic Streptococcus strains yielded in 4,603 profiles, 31% of which were based on HMM-domains and 703 contained pathway information (Figure S3A). An overview of the GO functional groups (Figure S3B) reveals a broader collection of processes that proteins of pathogenic strains are involved in, however, they are not shared among all the pathogenic Streptococcus strains and are most likely to be species-specific. The BLAST-based analysis included pathogenic strains from other genera, and thus cannot be comparable.
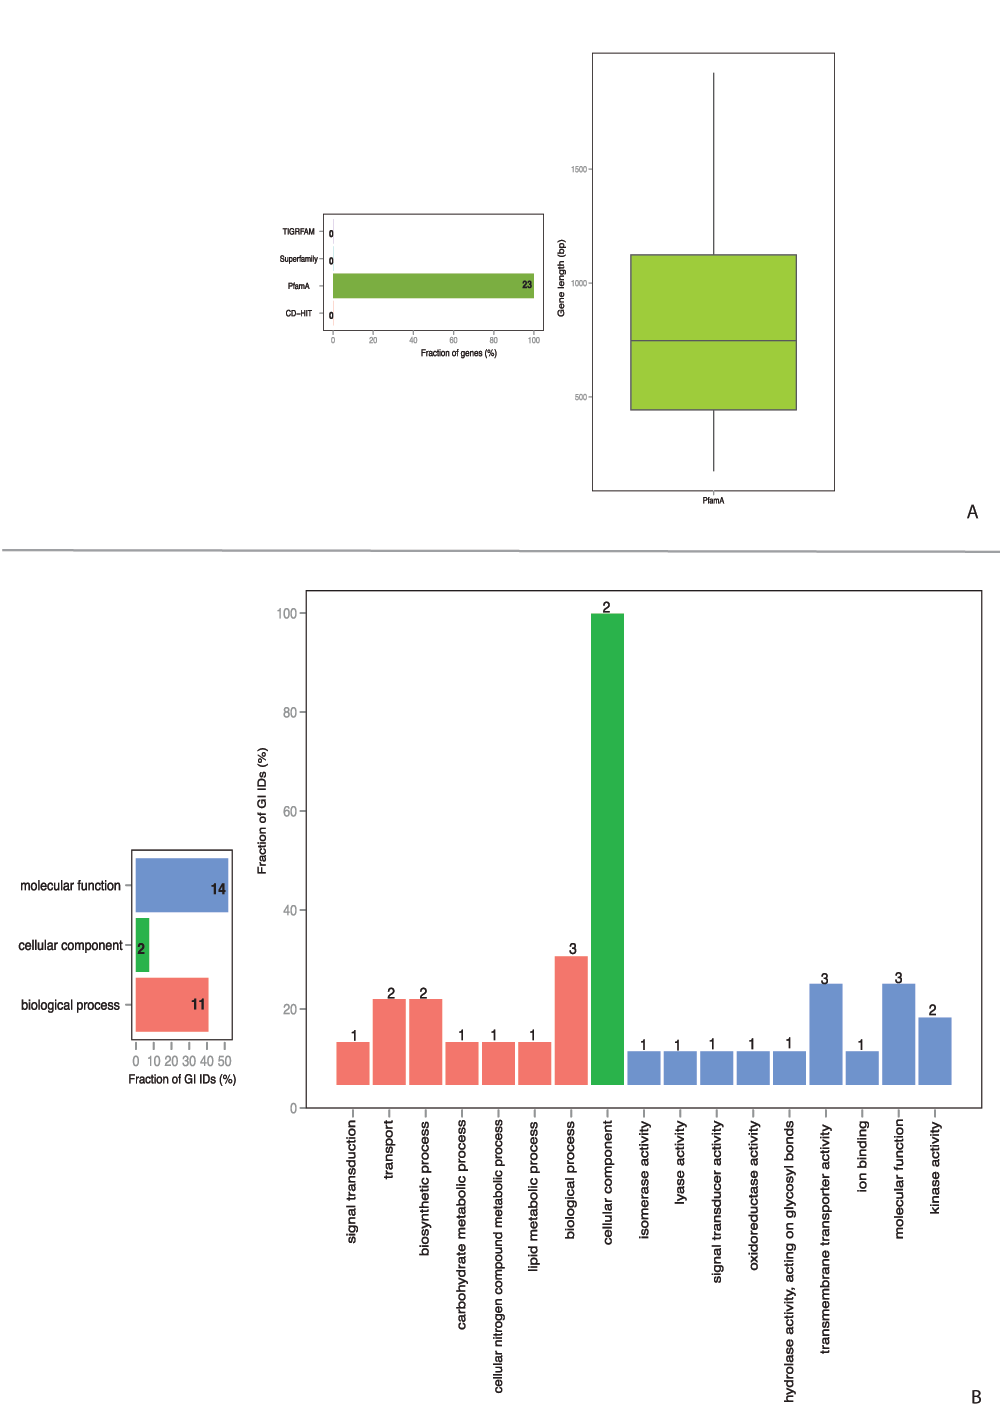
Figure 5. Protein architecture and available GO functional categories distribution within specific core-genomes of
pathogenic Streptococcus strains.
A. Specific core-genome profile distribution. B. Specific core-genome GO functional categories distribution.
Performance
The PanFunPro method was designed to integrate the information of functional domains from three HMM-based databases and group proteins into families according to the domain content within the protein. Further it can be used to analyse differences and similarities within defined groups of genomes based on functional architectures and visualise them. The approach includes a complex construction and assignment of functional profiles step. Therefore, we have measured the time required to collect functional domain information and perform profile formation for a set of 21 Lactobacillus genomes17. The test was performed both on MacBookPro, 2.4 GHz Intel Core i5, 8GB 1067 MHz DDR3; and on a Cluster with x86_64 architecture using 1 processor per genome and the default InterProScan settings. As illustrated in Table 1, single genome annotation by the PanFunPro approach takes about 25 and 14 min, on a laptop and cluster, respectively. To prepare profiles for the whole genus of 21 genomes, scanning one genome at a time, took more than 8h on MacBookPro and approximately 5h on the cluster. However if we allow scanning of genomes to run simultaneously on the cluster, the pan-genome calculation takes less than an hour.
Table 1. PanFunPro profile construction performance.
| MacBookPro | Cluster |
|---|
1 genome (1 genome
per scan) | 25 min 52 sec | 14 min 8 sec |
21 genomes (1 genome
per scan) | 8h 52 min 10 sec | 5h 2 min 43
sec |
21 genomes (21 genomes
per scan) | NA* | 21 min 33 sec |
Availability and future directions
The source code for PanFunPro is developed in the Perl programming language for UNIX systems, and requires access to the following programs: BioPerl, GO Parser, HMMER packages, R program, Interproscan, Oracle/Sun Java 1.6, CD-HIT clustering tool. The software and instructions are available via http://www.cbs.dtu.dk/~oksana/PhD_Thesis/PanFunPro/ and permanently accessible through 10.5281/zenodo.7583.
PanFunPro has been also implemented as a web server (http://cge.cbs.dtu.dk/services/PanFunPro/). The user can select a set of genomes from the provided database, including 1982 Bacterial and 128 Archaeal strains; or can upload a genome sequence and compare it to the genomes listed in the database (optional). The input file can be uploaded either in Genbank/FASTA format, or can already contain predicted proteins. The web server provides 6 analysis possibilities: core-, pan-, specific-genomes, pan-/core-plot, pan-/core-matrix, and specific-matrix. The results of analyses can be downloaded as a table and postscript file. For core-, pan-, and specific-gene families basic statistics and GO information can additionally be predicted as described above. More detailed instructions and output examples are provided on the server web page.
In the future we plan to update the approach with the analysis features and data visualization possibilities. Moreover, a web-interface will provide the possibility to compare known genomes to multiple user-submitted isolates.
Author contributions
OL planned the study, carried out all the bioinformatics analysis and drafted the manuscript. MCT carried out the web-server set-up. MVL and DWU participated in the design of the study and drafted the manuscript. All authors have read and approved the final manuscript.
Competing interests
No competing interests were disclosed.
Grant information
Authors received support from the Center for Genomic Epidemiology at the Technical University of Denmark; part of
this work was funded by grant 09-067103/DSF from the Danish Council for Strategic Research.
Conflict-of-interest statement
The authors declare that the research was conducted in the absence of any commercial or financial relationships that could be construed as a potential conflict of interest.
Acknowledgments
The authors are grateful to all research groups that have submitted their genome sequences to public databases, without which this analysis would not have been possible. We are also grateful to John Damm Sørensen for the excellent technical assistance.
Supplementary figures
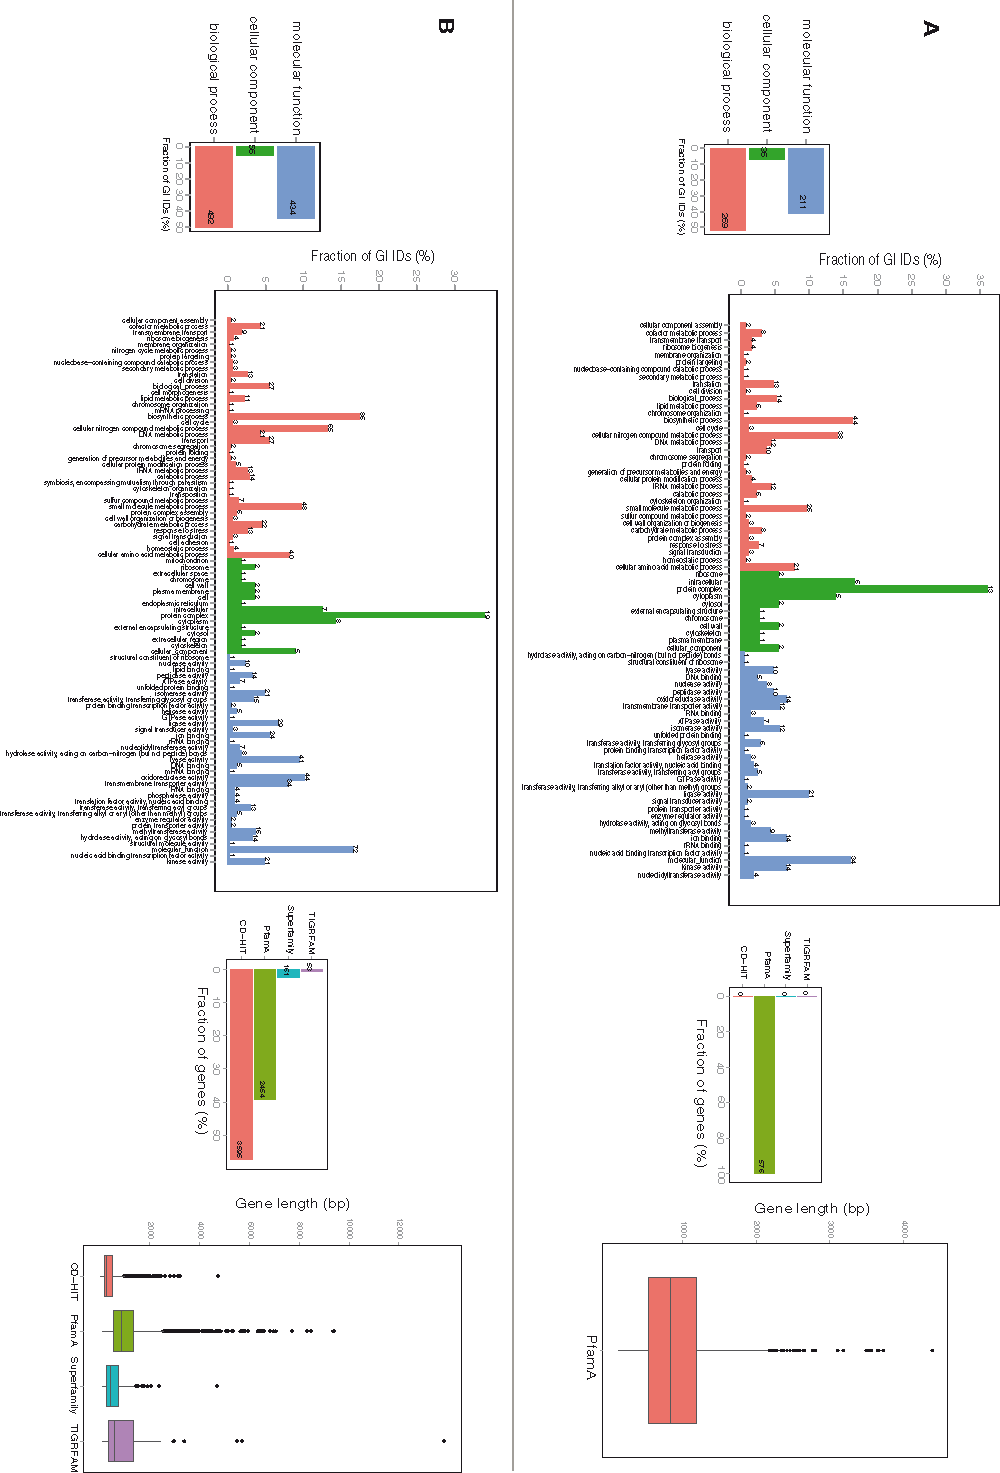
Figure S1. Protein architecture and available GO functional categories distribution within core- and pan-genomes of Lactococcus strains.
A. Core-genome GO functional categories and profile distribution. B. Pan-genome GO functional categories and profile distribution.
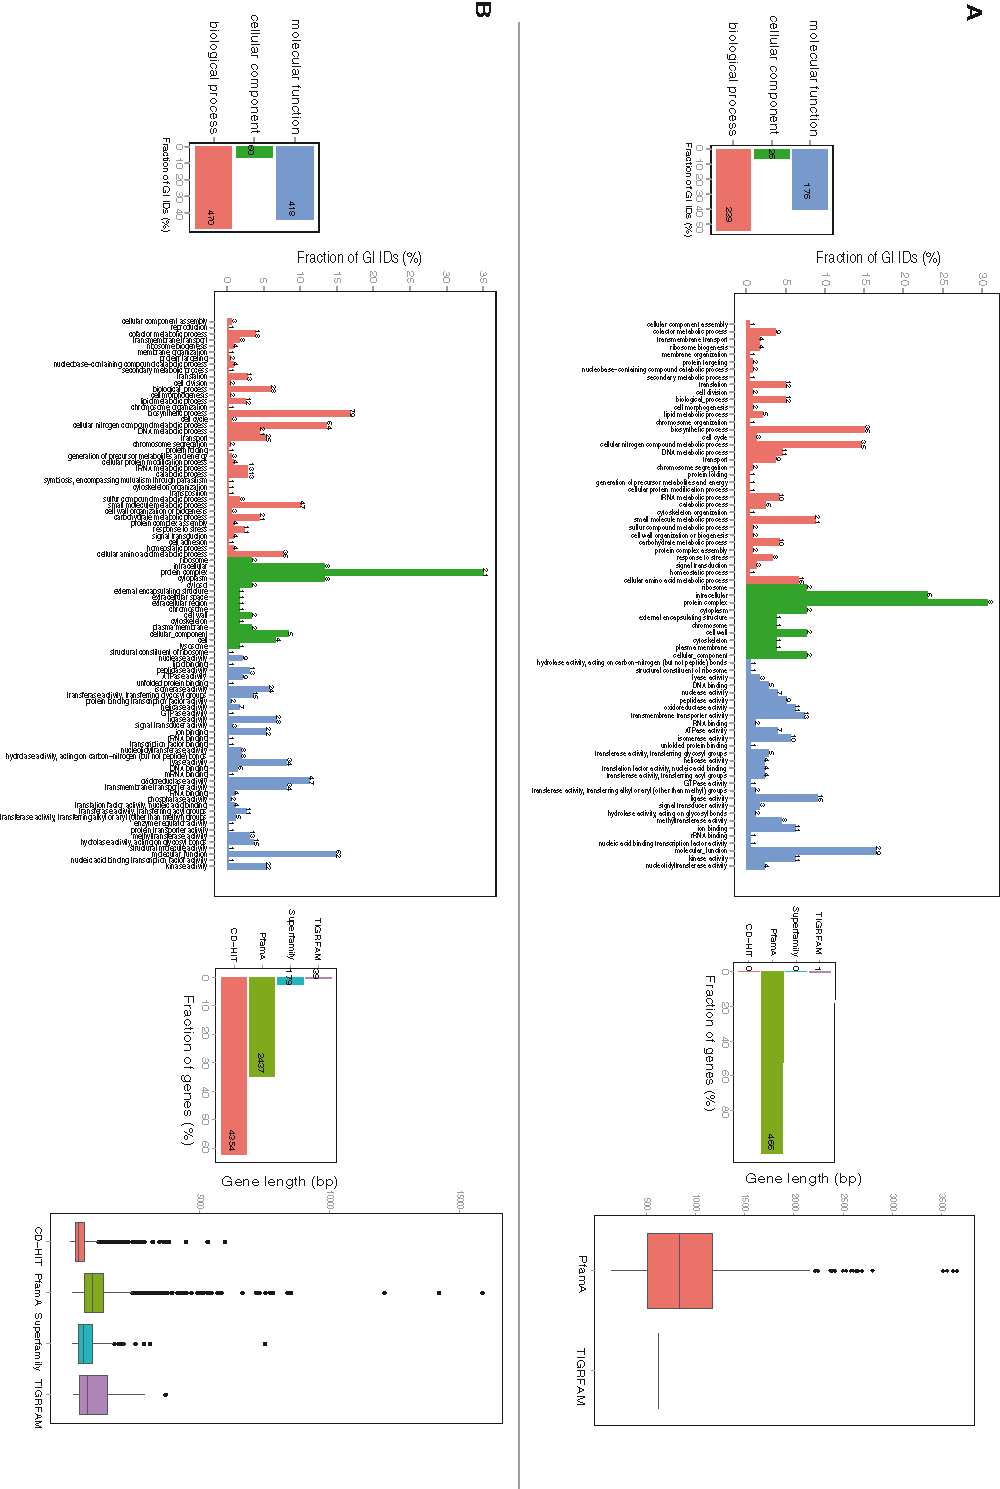
Figure S2. Protein architecture and available GO functional categories distribution within core- and pan-genomes of Streptococcus strains.
A. Core-genome GO functional categories and profile distribution. B. Pan-genome GO functional categories and profile distribution.
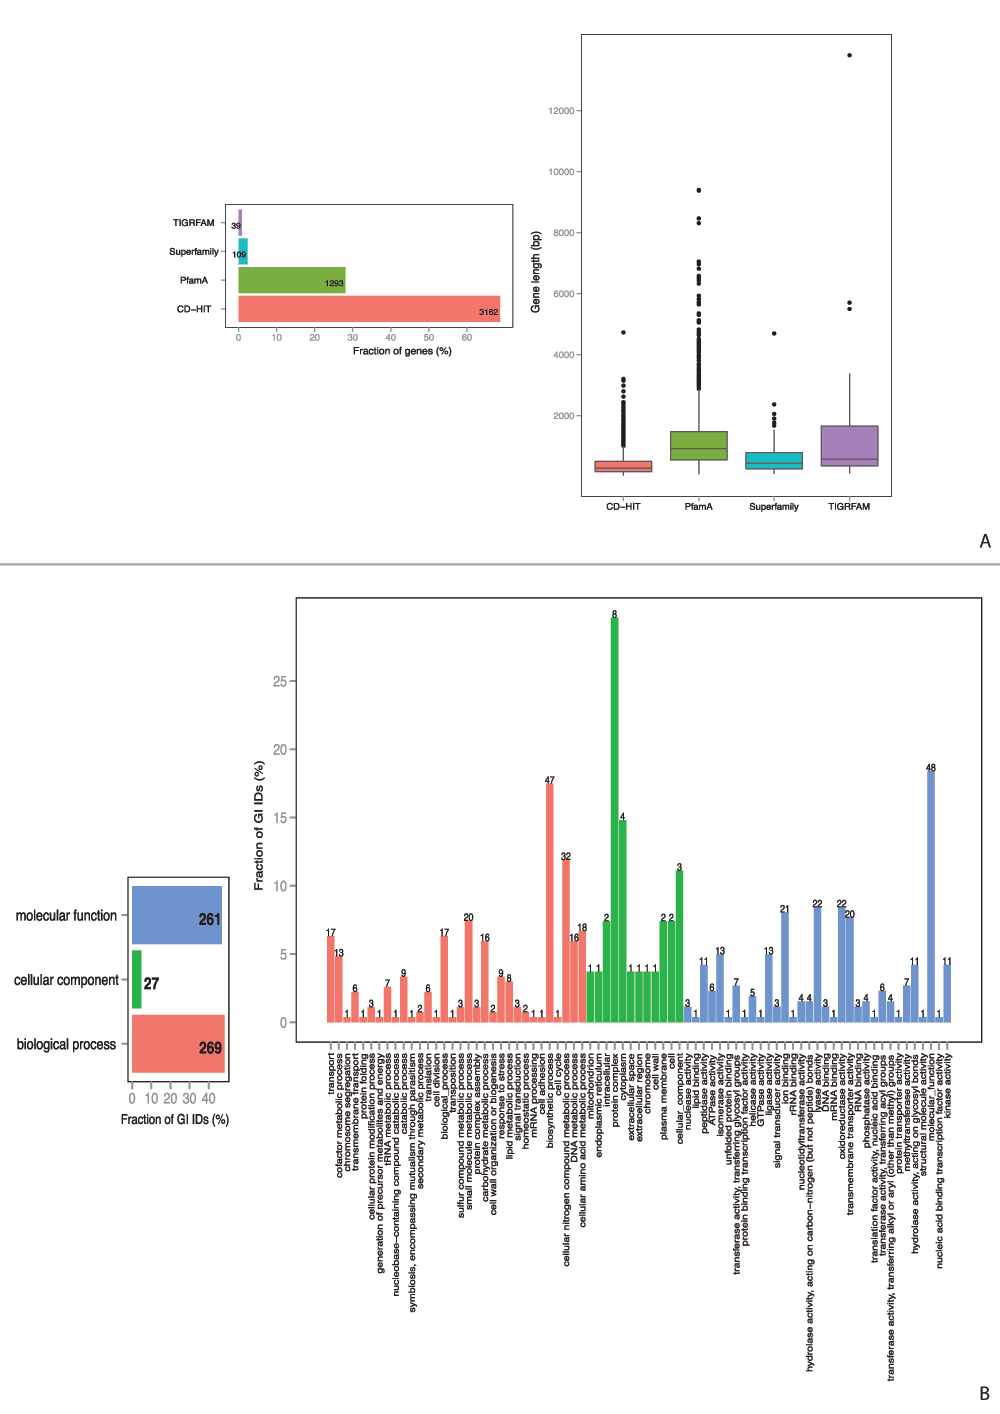
Figure S3. Protein architecture and available GO functional categories distribution within specific pan-genome of pathogenic Streptococcus strains.
A. Specific pan-genome profile distribution. B. Specific pan-genome GO functional categories distribution.
Faculty Opinions recommendedReferences
- 1.
Tettelin H, Riley D, Cattuto C, et al.:
Comparative genomics: the bacterial pan-genome.
Curr Opin Microbiol.
2008; 11(5): 472–7. PubMed Abstract
| Publisher Full Text
- 2.
Kuzniar A, van Ham RC, Pongor S, et al.:
The quest for orthologs: finding the corresponding gene across genomes.
Trends Genet.
2008; 24(11): 539–51. PubMed Abstract
| Publisher Full Text
- 3.
Fouts DE, Brinkac L, Beck E, et al.:
PanOCT: automated clustering of orthologs using conserved gene neighborhood for pan-genomic analysis of bacterial strains and closely related species.
Nucleic Acids Res.
2012; 40(22): e172. PubMed Abstract
| Publisher Full Text
| Free Full Text
- 4.
Altschul SF, Gish W, Miller W, et al.:
Basic local alignment search tool.
J Mol Biol.
1990; 215(3): 403–10. PubMed Abstract
| Publisher Full Text
- 5.
Pearson WR, Lipman DJ:
Improved tools for biological sequence comparison.
Proc Natl Acad Sci U S A.
1988; 85(8): 2444–8. PubMed Abstract
| Publisher Full Text
| Free Full Text
- 6.
Li W, Godzik A:
Cd-hit: a fast program for clustering and comparing large sets of protein or nucleotide sequences.
Bioinformatics.
2006; 22(13): 1658–9. PubMed Abstract
| Publisher Full Text
- 7.
Li L, Stoeckert CJ Jr, Roos DS:
OrthoMCL: identification of ortholog groups for eukaryotic genomes.
Genome Res.
2003; 13(9): 2178–89. PubMed Abstract
| Publisher Full Text
| Free Full Text
- 8.
O’Brien KP, Remm M, Sonnhammer EL:
Inparanoid: a comprehensive database of eukaryotic orthologs.
Nucleic Acids Res.
2005; 33(Database issue): D476–80. PubMed Abstract
| Publisher Full Text
| Free Full Text
- 9.
Eddy SR:
Hidden Markov models.
Curr Opin Struct Biol.
1996; 6(3): 361–5. PubMed Abstract
| Publisher Full Text
- 10.
Gabaldón T, Dessimoz C, Huxley-Jones J, et al.:
Joining forces in the quest for orthologs.
Genome Biol.
2009; 10(9): 403. PubMed Abstract
| Publisher Full Text
| Free Full Text
- 11.
Hyatt D, Chen GL, Locascio PF, et al.:
Prodigal: prokaryotic gene recognition and translation initiation site identification.
BMC Bioinformatics.
2010; 11: 119. PubMed Abstract
| Publisher Full Text
| Free Full Text
- 12.
Punta M, Coggill PC, Eberhardt RY, et al.:
The Pfam protein families database.
Nucleic Acids Res.
2012; 40(Database issue): D290–301. PubMed Abstract
| Publisher Full Text
| Free Full Text
- 13.
Haft DH, Selengut JD, White O:
The TIGRFAMs database of protein families.
Nucleic Acids Res.
2003; 31(1): 371–373. PubMed Abstract
| Publisher Full Text
| Free Full Text
- 14.
Wilson D, Pethica R, Zhou Y, et al.:
SUPERFAMILY-sophisticated comparative genomics, data mining, visualization and phylogeny.
Nucleic Acids Res.
2009; 37(Database issue): D380–6. PubMed Abstract
| Publisher Full Text
| Free Full Text
- 15.
Zdobnov EM, Apweiler R:
InterProScan-an integration platform for the signature-recognition methods in InterPro.
Bioinformatics.
2001; 17(9): 847–8. PubMed Abstract
| Publisher Full Text
- 16.
Gene Ontology Consortium. The Gene Ontology project in 2008.
Nucleic Acids Res.
2008; 36(Database issue): D440–4. PubMed Abstract
| Publisher Full Text
| Free Full Text
- 17.
Lukjancenko O, Ussery DW, Wassenaar TM:
Comparative genomics of Bifidobacterium, Lactobacillus and related probiotic genera.
Microb Ecol.
2012; 63(3): 651–73. PubMed Abstract
| Publisher Full Text
| Free Full Text
Comments on this article Comments (0)