Introduction
MicroRNAs (miRNAs) are cell- and therefore tissue-specific, and their expression levels impact protein translation (Sood et al., 2006). Nearly, 2000 microRNA (miRNA) sequences have been identified in humans (Kozomara & Griffiths-Jones, 2014). Numerous studies have reported specific miRNA expression levels in peripheral blood (PB) as markers of disease (Mookherjee & El-Gabalawy, 2013; Patnaik et al., 2012). Although miRNA expression levels could be inevitably influenced by the way that total RNA is extracted, often studies reporting differential miRNA expression levels fail to emphasise the impact of RNA extraction methods. This could at least partially lead to significant controversies and inconsistencies in the literature related to miRNA research.
PAXgene Blood RNA System (PAXgene Blood RNA Tube and Paxgene Blood miRNA Kit [PAXM]) has been the gold standard for PB collection as the stabilising reagent present in the tube prevents RNA degradation and inhibits changes in gene expression due to the collection procedure (Guenther & McCluskey, 2008). However, it should be emphasised that the miRNA expression detected in whole blood is the overall outcome from total hematocytes rather than the lymphocyte fraction only. Recent studies have shown that erythrocytes also contain a high proportion of miRNAs (Hamilton, 2010). Bayatti et al. have shown that the presence of globin (globular proteins such as haemoglobin) in PB can impact RNA expression and that globin depletion can decrease total RNA quality and yield in particular when extraction is performed using the PAXgene Blood RNA kit (Bayatti et al., 2014). However, it is necessary to evaluate the miRNA expression levels in an independent cohort, as miRNAs are in general highly stable, and therefore their expression might not be affected by globin treatment. Likewise, Mookherjee et al. have only shown that miRNA expression levels correlate between whole blood and PBMCs using PAXgene Blood RNA System and mirVana miRNA kit (MM), respectively (Mookherjee & El-Gabalawy, 2013). They have not shown that the expression levels are comparable or that they agree. This has raised some confusion as the PAXgene Blood RNA system extracts from whole blood while MM from PBMCs. In addition, researchers have only tested for the relationship between one method and another rather than for agreements as recommended by Bland et al., (Bland & Altman, 1986). Performing a comprehensive statistical analysis is required when two methods are compared (Burd, 2010).
In this investigation we have measured the expression of miR-146a-5p and miR-155-5p which have extensively been investigated in whole blood and PBMCs due to their critical functions in the innate and adaptive immune system (Curtale et al., 2010; Schulte et al., 2013). We sought to compare miRNA expression levels in PB collected from 14 healthy volunteers using both extraction methods (PAXM and mirVana PARIS [MP]). Overall, we sought to address (i) whether miRNA expression detected in whole blood is comparable to that of isolated PBMCs and (ii) whether the degree of haemolysis impacts on the detected levels of miRNA expression in whole blood and PBMCs. We also investigated whether there is a difference in miR-146a-5p and miR-155-5p expression between males and females as well as fresh and cryopreserved PBMCs. The experimental design for this investigation is depicted in Figure 1.
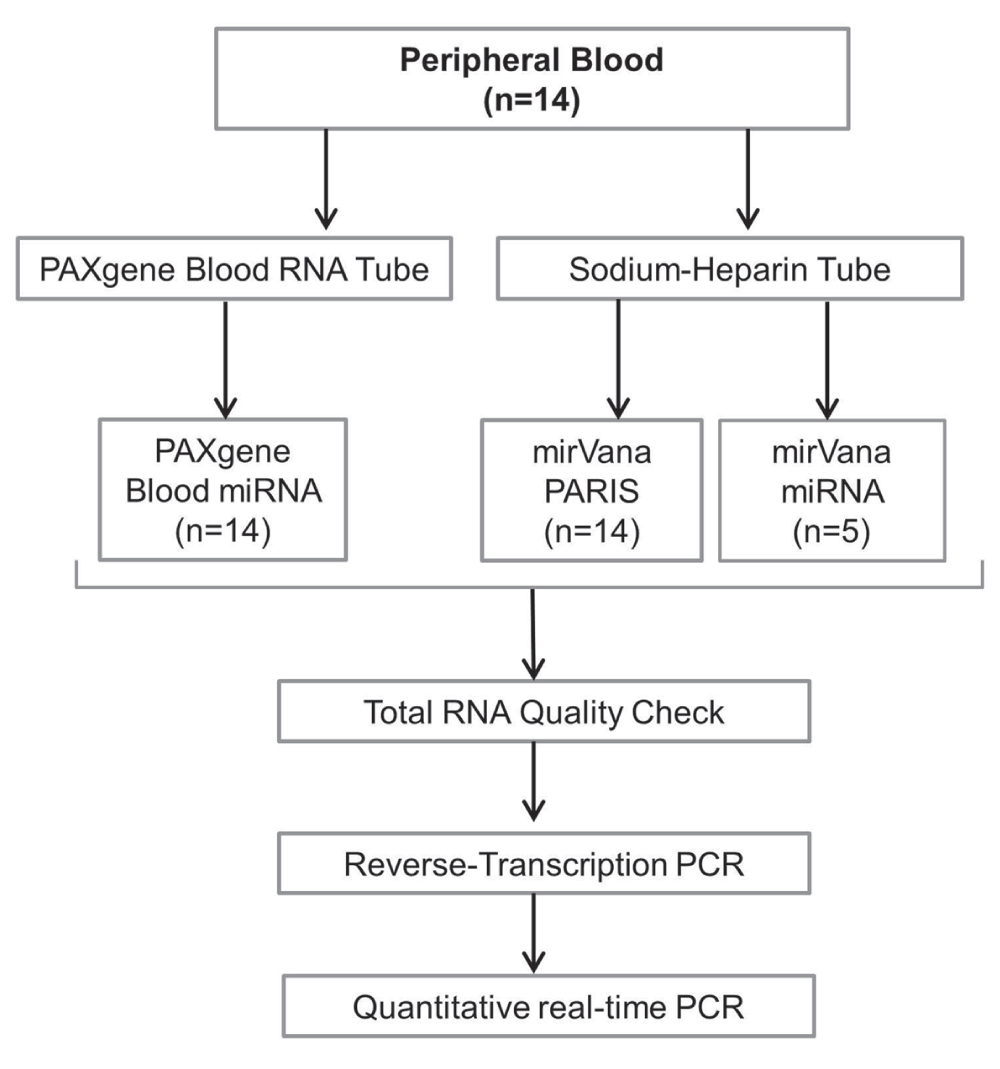
Figure 1. Experimental design.
Peripheral blood was collected into various tubes as illustrated. Total RNA was extracted via three different methods and tested for purity. Reverse transcription and quantitative real-time PCR was performed for all the samples.
Materials and methods
Volunteer cohort
Whole blood was collected from 14 healthy volunteers following approval from the Newcastle and North Tyneside 2 Research Ethics Committee (STEMDIAGNOSTICS: REC-07/H0906/131) and informed consent was obtained from every volunteer for both blood collection and miRNA testing. Samples from 14 healthy volunteers (5 males and 9 females) were used to quantify miRNA expression in whole blood and PBMC.
Sample collection and storage
PB (2.5 ml) was collected in PAXgene Blood RNA Tubes (PreAnalytiX GmbH, Switzerland [Catalog No: 762165]) containing an RNA stabilising agent that lysed the blood cells and stabilised the intracellular RNA. The tubes were stored at -20°C until processed. PB was also collected in sodium (Na)-heparin (Sigma, UK) containing tubes for peripheral blood mononuclear cell isolation using graduated centrifugation over Lymphoprep™ (STEMCELL Technologies, Manchester, UK). The cells were then stored at -4°C before extraction. Isolated PBMCs were cryopreserved by re-suspension in freezing solution containing 350 ml of RPMI 1640 (Sigma-Aldrich, UK), 20% fetal calf serum and 10% dimethyl sulfoxide (NBS Biologicals, UK) and stored in Cryovials at -80°C.
Total RNA extraction from peripheral blood
Total RNA was extracted from isolated PBMCs using the (i) mirVana™ PARIS™ kit (MP) and (ii) mirVana™ miRNA Isolation kit (MM) (Ambion, USA [Catalog Nos: AM1556 and AM1560, respectively]) according to the manufacturer’s protocol. PAXgene Blood RNA Tubes were incubated overnight at room temperature to increase the RNA yield. Total RNA extraction from whole blood was performed using the PAXgene Blood miRNA kit (PAXM) (PreAnalytiX GmBh, Switzerland [Catalog No: 763134]), according to the manufacturer’s protocol. Aseptic techniques were followed at all stages of extraction. Total RNA quality and concentration were assessed using NanoDrop ND-1000 spectrophotometer (Thermo Fischer Scientific, MA). The absorbance ratios 260 nm/280 nm and 260 nm/230 nm were analysed to determine the purity of total RNA.
Reverse transcription and quantitative real-time PCR
MicroRNA specific cDNA was synthesised from 10 ng total RNA extracted from isolated PBMCs and whole blood using TaqMan MicroRNA reverse transcription (RT) kit (Applied Biosystems, Life Technologies, USA [Catalog No: 4366596]) as per the manufacturer’s protocol. The same RNA concentration was used for all the reactions. Hydrolysis probes were used for cDNA synthesis (Assay IDs: miR-155-5p-5p: 000479, miR-146a-5p: 000468, miR-451-5p: 001141, miR-23a-3p: 000399, SNORD49A [RNU49]: 001005, SNRNP27 [U6]: 001973, SNORA74A [RNU19]: 001003 and SNORD48 [RNU48]: 001006). No-enzyme control (NEC) and a negative template control (NTC) were run for every extraction and RT reaction set. The samples were then run on a thermal cycler at four different holding temperatures: 16°C for 30 minutes, 42°C for 30 minutes, 85°C for 5 minutes and finally at 4°C until storage at -4ºC.
Quantitative real-time PCR (qPCR) was performed using the TaqMan method and hydrolysis probes mentioned above (Applied Biosystems by Life Technologies, CA, USA) according to the manufacturer’s protocol. Each sample was run in triplicate and every plate contained the no-template control (NTC) from the RT step and the qPCR step as well as a no-enzyme control (NEC) on a 7900HT Fast Real-Time PCR System (Life Technologues, CA, USA).
Data analysis
The qPCR results were analysed using SDS v2.4 software and normalised using SNORD48 as the reference control which was selected by testing a panel of four controls for stable expression within the whole blood and PBMCs. The comparative ∆∆Cq method was used to calculate fold-changes (ΔCq = Cq microRNA of interest - Cq reference control, Relative Quantification [RQ]aaaaa2-ΔΔCq and LOG transformed = LOG2RQ). Fold-change was logarithm-transformed as qPCR data are non-linear (exponential), and is transformed to decrease the heterogeneity of variance (McDonald, 2009) and also to identify the outliers present in the data (Rieu & Powers, 2009). Standard curves for three samples from both PAXM and MP were generated and a 95% confidence interval slope of the line was used to calculate the PCR efficiency (E) using the standard formula; E=10-1/Slope and % efficiency = (E-1) × 100. Mean efficiency was then calculated. Results were analysed and plotted using GraphPad PRISM v5.0 software (GraphPad Software, Inc, USA). Mann-Whitney U t-test was used to assess difference between two groups and Kruskal-Wallis one-way analysis of variance (ANOVA) for multiple groups. Spearman’s test was used to determine correlation. Bland-Altman was performed to test whether two methods agreed and if one could be interchanged with another. Significance was set at p<0.05.
Results
Quality of RNA extracts
Total RNA was extracted using three different extraction methods; PAXM (PAXgene Blood miRNA), MP (mirVana PARIS) and MM (miRVana miRNA) from whole blood and PBMCs. RNA purity was assessed by detecting the absorbance ratios at 260 nm/280 nm and at 260 nm/230 nm. The ratio (260 nm/280 nm) for whole blood was 1.95 – 2.35 and for isolated PBMCs was 2.00 – 2.27 (both MP and MM respectively). The ratios were ≥ 1.8 – 2.0; thus extraction was free from protein contamination which is usually absorbed at 280 nm. Absorbance ratios detected at 260 nm/230 nm showed ratios below the accepted contamination-free range of 1.5 – 2.0 (PBMCs: 0.18 – 1.83 and whole blood: 0.15 – 1.49). Therefore, the samples may have been affected by contaminants absorbed at 230 nm such as guanidine isothiocyanate present in all the three extraction kits. For RNA purity, the peak of each total RNA plot was also analysed as it could indicate contamination by phenol and/guanidine isothiocyanate. PBMCs had plot peaks at 260 nm thus confirming contaminant-free samples. However, peaks at 260 nm were absent for total RNA extracted using the PAXM (Figure 2). This further suggests that guanidine salts may have been the cause of contamination in whole blood samples extracted using PAXM.

Figure 2. Representative graphical plots of total RNA extracted.
(A) PAXM: analysis of whole blood showed peaks positioned at 230 nm (n=10) and (B) MP: analysis of PBMCs showed peaks positioned at 260 nm (n=5).
Quantitative PCR quality controls
NEC and NTC controls were used to ensure that the RT and qPCR reactions were contaminant-free. Each control displayed no amplification (Cq > 36). This was particularly important for total RNA extracted from PBMCs, as they were non-DNase treated. Thus, any amplification in the controls may have suggested either non-specific binding of primers or presence of contamination such as genomic DNA. In addition we calculated the average efficiency of our real-time qPCR reactions (E=97.8%) which confirmed absence of reaction inhibitors. Determining qPCR efficiency is important as inhibitory compounds can affect miRNA expression and result in false positives.
Reference control for microRNA expression in peripheral blood
We determined the most appropriate reference gene for this investigation by testing a panel of four controls that have been known for stable expression (SNORD49A [RNU49], SNRNP27 [U6], SNORA74A [RNU19] and SNORD48 [RNU48]) (Dataset a). Our results showed that SNORD48 expression was the most stable in total RNA extracted via both the PAXM (Figure 3A) and MP (Figure 3B) method. Therefore, SNORD48 was used as the reference control to normalise miR-146a-5p and miR-155-5p expression in each sample.
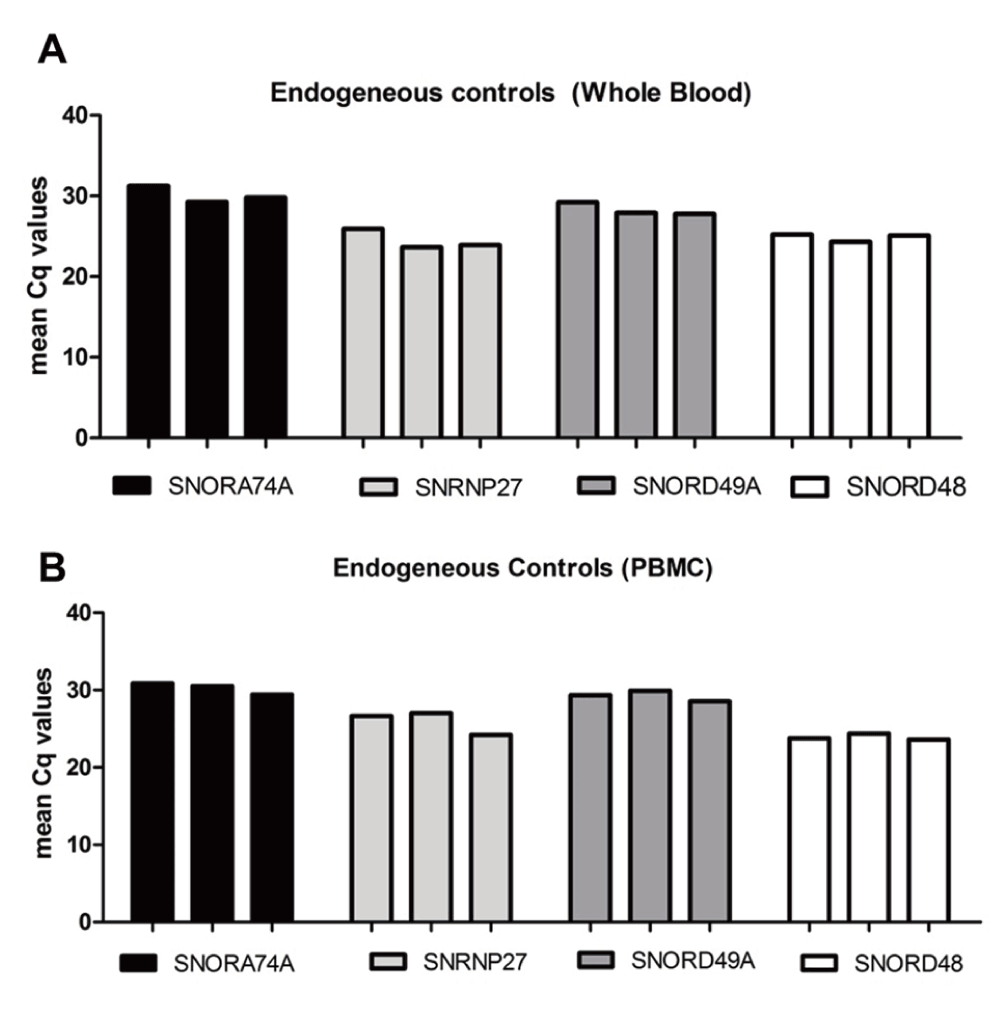
Figure 3. Expression of endogenous controls in total RNA extracted.
A panel of four stably expressed miRNAs were selected and quantified to identify the most stable control for normalisation of miR-146a-5p and miR-155-5p in paired samples (n=3) (A) whole blood and (B) PBMCs.
Whole blood extracted using PAXM exhibits higher degree of haemolysis
Erythrocyte haemolysis has been reported to alter miRNA measurements in whole blood, plasma, serum and tissues (McDonald et al., 2011; Pritchard et al., 2012). The total RNA extracted using the three different methods was examined for degree of haemolysis by quantifying miR-451-5p and miR-23a-3p (Dataset b). Normalised ∆Cq values (miR-23a-3p – miR-451-5p) greater than seven were considered as an indicator of haemolysis. Our results showed that there was a significantly high degree of haemolysis in the total RNA extracted using the PAXM method with the ∆Cq values in the range of 9 – 11. Haemolysis was low in total RNA extracted using either of MP or MM, ∆Cq>3 (Figure 4).
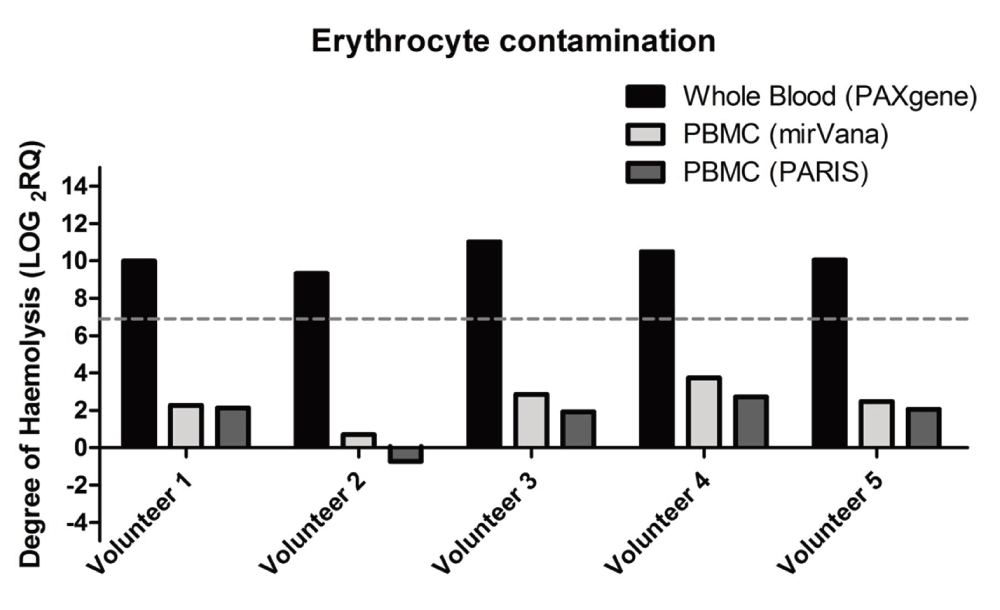
Figure 4. Degree of haemoloysis in total RNA extracted via the three extraction methods.
Total RNA extracted using the PAXgene miRNA isolation kit. A threshold of LOG2RQ greater than 7 was indicative of haemolysis (dashed line). The degree of haemolysis was calculated by measuring the difference between miR-451-5p and miR-23a-3p expression. All data (n=5) have been log-transformed.
MicroRNA expression in whole blood and PBMCs
With inclusion of stringent quality controls, we assessed miR-146a-5p and miR-155-5p expression in total RNA extracted in parallel from whole blood using PAXM (n=14) and PBMCs using MP (n=14) (Dataset c). Our results showed that there was no correlation (Figure 5, miR-146a-5p: r=-0.352, p=0.217 and miR-155-5p: r=0.380, p=0.180) between PAXM and MP in the expression of both miR-146a-5p and miR-155-5p. In a PCR reaction, it is assumed that the target expression doubles at every reaction cycle. Bland-Altman analysis also showed that the two methods did not agree as the bias was greater than 1 which equated to more than one qPCR cycle difference between the two methods (Figure 5A and 5B). Mookherjee et al. had used MM to extract total RNA from PBMCs, then correlated miRNA expression between the PAXM and MM method (Mookherjee & El-Gabalawy, 2013). To eliminate the possibility that using MP was the reason for the non-correlation and disagreement, we tested the three different extraction methods (PAXM, MP and MM) for both miRNAs in a randomly selected cohort of five healthy volunteers (Figure 6) (Dataset d). The results demonstrated that PAXM and MP as well as PAXM and MM do not correlate nor agree. However, MP and MM methods agree with one another and can be interchanged as the bias between the two methods for both miR-146a-5p and miR-155-5p was only 0.769 (SD=0.307) and 0.892 (SD=0.802), respectively. Interestingly, normalised miRNA expression was significantly different only between PAXM and MM methods (miR-146a-5p and miR-155-5p: p<0.01). There was a higher miRNA expression in PBMCs than in whole blood for both miRNAs (Figure 7).

Figure 5. Bland-Altman plots for miRNA expression from whole blood and PBMCs.
Total RNA was extracted (n=14) using PAXM and MP for (A) miR-146a-5p and (B) miR-155-5p expression. MicroRNA expression is within the limits of agreement but the bias is greater than one showing high disagreement between PAXM and MP. r indicates Spearman correlation. SD: Standard Deviation and bias is the mean difference. Cq values were used for this analysis. Dashed lines show the 95% lower and upper limits of agreement.
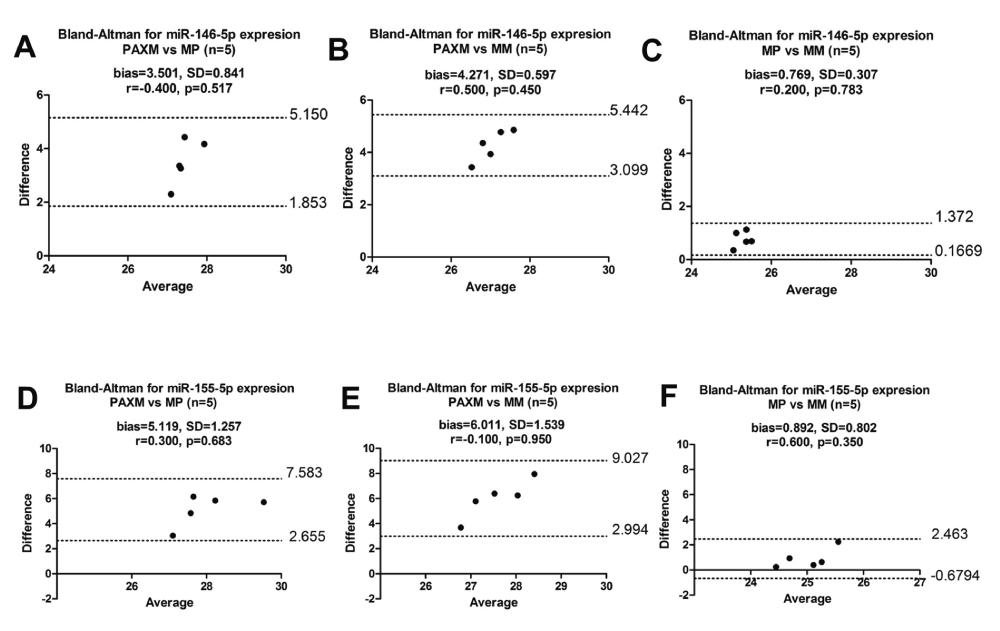
Figure 6. Bland-Altman plots for miR-146a-5p and miR-155-5p expression in whole blood and PBMCs.
The three methods were all compared for miR-146a-5p as (A) PAXM vs MP (B) PAXM vs MM and (C) MP vs MM as well as miR-155-5p (D) PAXM vs MP (E) PAXM vs MM (F) MP vs MM. MicroRNA expression is within the limits of agreement but the bias is greater than one showing high disagreement between PAXM and MP. Bias is lower than one for MP and MM, thus the two methods agree with one another. r indicates Spearman correlation. SD: Standard Deviation and bias is the mean difference. Cq values were used for this analysis. Dashed lines show the 95% lower and upper limits of agreement.

Figure 7. Normalised miRNA expression comparison from whole blood and PBMCs.
(A) miR-146a-5p and (B) miR-155-5p expression. MicroRNA expression is significantly varied across all the three different groups (p=0.002). MicroRNA expression is higher in PBMCs extracted via either MP or MM method in comparison to whole blood. **p<0.01 and ns: not significant.
Impact of cryopreservation on microRNA expression
Many samples from patients participating in clinical studies are cryopreserved and stored as PBMCs for later use. Therefore, it is important to know the specific effects of cryopreservation on miRNA expression in PBMCs. We evaluated the impact of cryopreservation by extracting total RNA using MP kit from paired fresh and cryopreserved PBMCs (n=5) and performing RT-qPCR respectively (Dataset e). There was no correlation in miRNA expression between fresh and cryopreserved PBMCs, but the bias for both miR-146a-5p and miR-155-5p was less than 1 (Figure 8A and B). In addition, there was no statistically significant difference between fresh and cryopreserved PBMCs for both miR-146a-5p and miR-155-5p expression (p=0.125) (Figure 8C and D, respectively). Thus, expressions in fresh and cryopreserved samples do agree with one another but more samples would need to be tested as the standard deviation of bias was high for both miRNAs (miR-146a-5p: SD=2.284 and miR-155-5p: SD=1.342), which indicates a large sample variability.
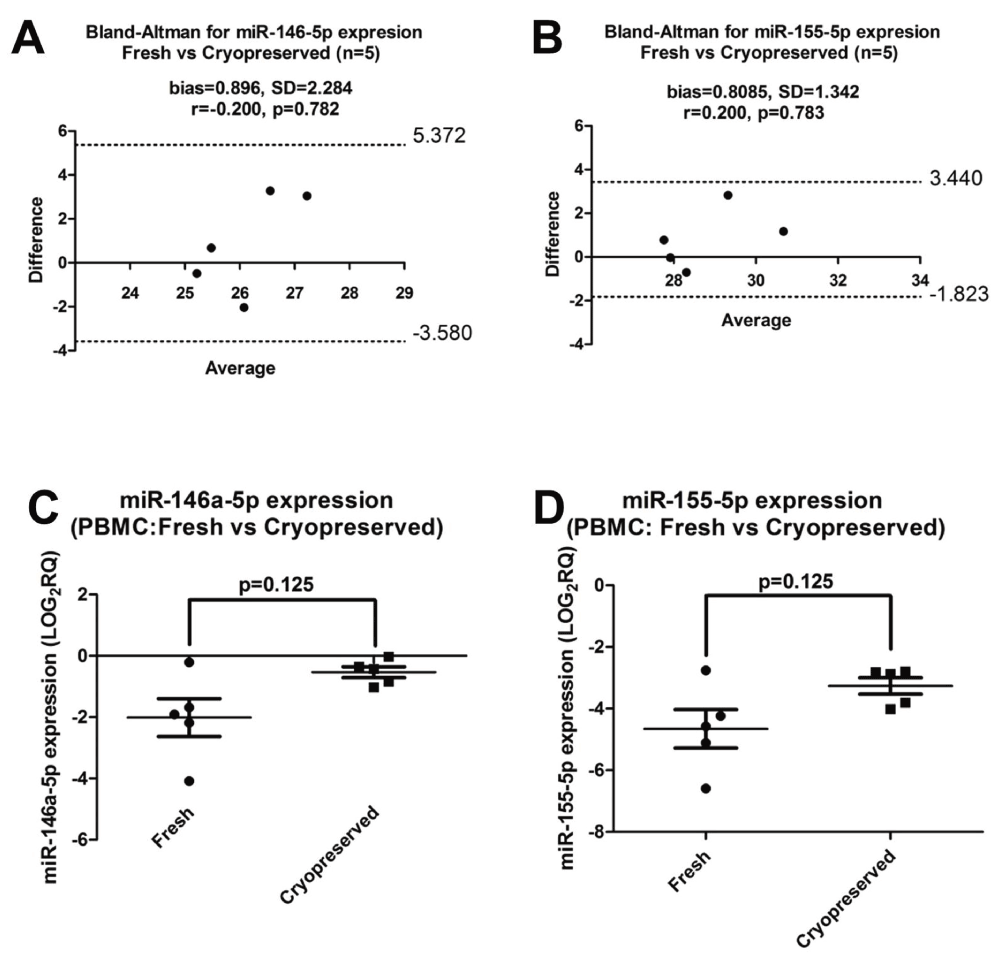
Figure 8. Bland-Altman and normalised miRNA expression plots in fresh and cryopreserved PBMCs.
Expression was measured in five volunteers. Bland-Altman plots (A) miR-146a-5p and (B) miR-155-5p expression. The bias for both miRNAs is less than one. Bias is the mean difference. SD: Standard deviation. Cq values were used for this analysis. Dashed lines show the 95% lower and upper limits of agreement. Normalised miRNA expression (C) miR-146a-5p and (D) miR-155-5p. All data was log-transformed. Significance was set as p<0.05.
MicroRNA expression in males and females
In order to determine whether miR-146a-5p and miR-155-5p expression differed between males (n=5) and females (n=9), further analysis was performed (Figure 9) (Dataset c). No significant difference was observed between males and females for miR-146a-5p (Whole Blood (PAXM): p=0.797, PBMC (MP): p=0.190) and miR-155-5p (PAXM): p=1.00, PBMC (MP): p=0.898) using both methods.
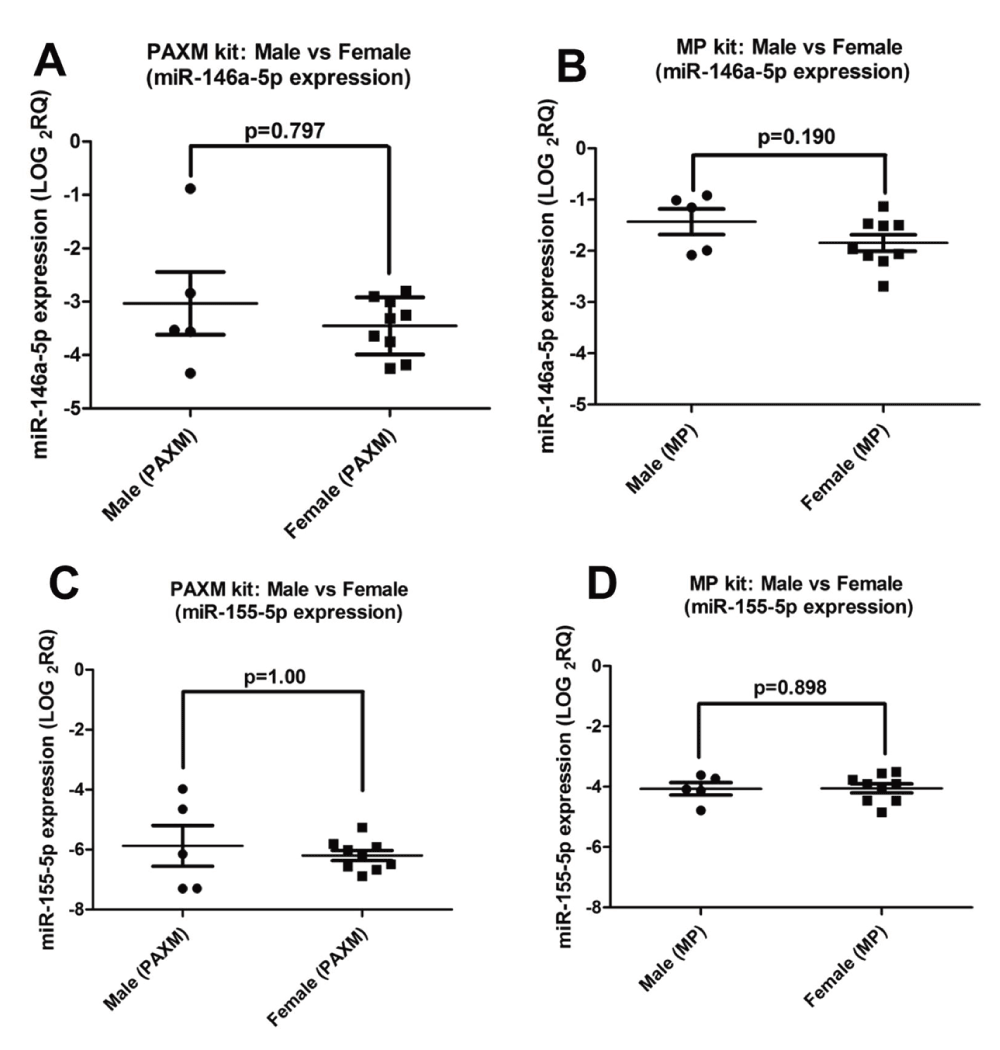
Figure 9. MicroRNA expression in males and females.
No significant difference in (A & B) miR-146a-5p and (C & D) miR-155-5p expression was observed between males and females when total RNA was extracted using PAXM and MP. Normalised miRNA expression was used for this analysis.
Dataset 1.Data of miRNA extraction methods from whole blood and PBMCs.
Dataset (a) shows the expression of all endogenous controls used in the study. Dataset (b) shows the degree of cell hemolysis using different extraction kits. Datasets (c)-(d)-(e) contain data of miR-146a-5p and miR-155-5p expression in whole blood and PBMCs in different samples. Complete dataset legends can be found in the text file.Discussion
Globally, miRNA expression levels are used to classify diseases and also to distinguish the diseased from the healthy population. However, non-uniform technical procedures have led to the many controversies and inconsistencies in miRNA expression results observed in various studies. In addition, failure to test the degree of haemolysis in studies using PB has led to only few reproducible experimental results. Thus, in an attempt to elucidate the importance of protocol standardization and show the impact of technical variations in miRNA expression investigations, we examined several parameters when measuring the expression of immune related miRNAs (miR-146a-5p and miR-155-5p).
First, we performed RT-qPCR to test whether the expression of miR-146a-5p and miR-155-5p is the same in whole blood and PBMC samples using three different commercially available extraction methods (PAXM, MP and MM). Our results showed that there was no agreement between PAXM and both MP and MM for miR-146a-5p and miR-155-5p expression. PBMCs constitute only a fraction of the cells present in PB and therefore lack granulocytes, platelets and erythrocytes (Min et al., 2010). Due to the unique miRNA expression pattern in each cell-type the relative proportions of cells in blood may have an effect on the overall miRNA expression profile and the expression of their protein targets (Min et al., 2010). Some studies have shown that mature miRNA expression signature in erythrocytes is similar to that in whole blood while different when compared to PBMCs (Chen et al., 2008). We have clearly demonstrated a high degree of haemolysis in whole blood samples processed using PAXM by measuring the difference between miR-451-5p which is a marker of erythrocytes (Rasmussen et al., 2010) and miR-23a-3p that has been shown to be unaffected by haemolysis (Blondal et al., 2013). We have shown that there is a lower miR-146a-5p and miR-155-5p expression in whole blood compared to PBMCs. Several studies have shown that total RNA yield from whole blood decreases after the use of DNase step in the PAXM protocol (Asare et al., 2008; Bayatti et al., 2014; Debey et al., 2004). However, if PAXM total RNA is not DNase-treated, there may be a possibility of DNA contamination. Contrary to our results, Mookherjee et al. found a linear correlation between miR146a-5p and miR-155-5p expression in whole blood and isolated PBMCs collected from a healthy population (Mookherjee & El-Gabalawy, 2013). In their work, they did not measure the degree of haemolysis in the samples, which may partly explain the discrepancy between the two studies. Furthermore, our study compared both the strength (correlation) and level of agreement between the two methods whilst Mookherjee et al. examined only the correlation (Bland & Altman, 1986). This highlights the importance of performing the correct statistics when two methods are compared with regards to their equivalence and interchangeability (Burd, 2010).
Our results suggest that isolation of total RNA from PBMCs is more reliable with higher RNA purity than isolation from whole blood via PAXgene Blood RNA Tubes. However, in clinical practice, it is easier to collect PB in PAXgene Blood RNA tubes as they have a shelf-life of two to five years without any RNA degradation. Immediate stabilisation is vital as storage of blood cells induce changes in the miRNA composition (Gaarz et al., 2010). Thus, extraction methods from whole blood must be optimised to either eliminate erythrocyte contamination or consider the expression as cumulative and design downstream experiments for miRNA protein target studies accordingly.
We evaluated whether miR-146a-5p and miR-155-5p expression was different between males and females as previous studies have shown that miRNA expression can be gender-dependent (Ji et al., 2009). We found no gender-dependent differences in the expression of miR-146a-5p and miR-155-5p.
Finally, we assessed the impact of cryopreservation on the expression of both miRNAs. Gaarz et al. had shown that miRNA expression profiles of fresh and cryopreserved isolated PBMCs were not comparable (Gaarz et al., 2010). However, in our investigation we have shown that there is no significant difference in the expression of both miRNAs. This disagreement could be due to technical differences between the studies as Gaarz et al., (2010) who used TRIZOL reagent for extraction, while we used the MP kit. Bland-Altman plots showed that both fresh and cryopreserved methods agreed with each other and cryopreserved samples had lesser variability, which could be explained by the fact that any erythrocyte carried-over from the gradient centrifugation step is removed on freeze-thawing.
In conclusion, our study shows differences in miR-146a-5p and miR-155-5p expression in isolated PBMCs and whole blood. We suggest that PBMCs are not the ideal source to study and correlate miRNA protein targets where the miRNA expression had been measured in whole blood as the miRNA expression pattern in whole blood is not comparable to that in PBMCs. We also highlight the importance of having a stringent set of technical controls and performing the correct statistics to increase the reliability and reproducibility of miRNA expression studies.
Consent
All participants to the study provided informed written consent for molecular testing and publication of the data.
Data availability
F1000Research: Dataset 1. Data of miRNA extraction methods from whole blood and PBMCs, 10.5256/f1000research.4884.d33496 (Atarod et al., 2014).
Author contributions
S.A performed the experiments, analysed the results and wrote the manuscript. H.S. performed part of the experiments. A.M.D provided constructive comments for the discussion. XN.W interpreted the results and wrote the manuscript. All authors revised the manuscript and agreed to the final content.
Competing interests
No competing interests were disclosed.
Grant information
This work was supported by the Newcastle University and the FP7 Marie Curie Initial Training Network CELLEurope (Contract No: 315963).
The funders had no role in study design, data collection and analysis, decision to publish, or preparation of the manuscript.
Acknowledgements
We would like to thank all the volunteers who donated blood for this study. We would also like to thank Dr Clare Lendrem and Dr Kim Pearce for their statistical advice.
Faculty Opinions recommendedReferences
- Asare AL, Kolchinsky SA, Gao Z, et al.:
Differential gene expression profiles are dependent upon method of peripheral blood collection and RNA isolation.
BMC Genomics.
2008; 9: 474. PubMed Abstract
| Publisher Full Text
| Free Full Text
- Atarod S, Smith H, Dickinson A, et al.:
Data of miRNA extraction methods from whole blood and PBMCs.
F1000Research.
2014. Data Source
- Bayatti N, Cooper-Knock J, Bury JJ, et al.:
Comparison of blood RNA extraction methods used for gene expression profiling in amyotrophic lateral sclerosis.
PLoS One.
2014; 9(1): e87508. PubMed Abstract
| Publisher Full Text
| Free Full Text
- Bland JM, Altman DG:
Statistical methods for assessing agreement between two methods of clinical measurement.
Lancet.
1986; 1(8476): 307–310. PubMed Abstract
| Publisher Full Text
- Blondal T, Jensby Nielsen S, Baker A, et al.:
Assessing sample and miRNA profile quality in serum and plasma or other biofluids.
Methods (San Diego, Calif).
2013; 59(1): S1–6. PubMed Abstract
| Publisher Full Text
- Burd EM:
Validation of laboratory-developed molecular assays for infectious diseases.
Clin Microbiol Rev.
2010; 23(3): 550–576. PubMed Abstract
| Publisher Full Text
| Free Full Text
- Chen SY, Wang Y, Telen MJ, et al.:
The genomic analysis of erythrocyte microRNA expression in sickle cell diseases.
PLoS One.
2008; 3(6): e2360. PubMed Abstract
| Publisher Full Text
| Free Full Text
- Curtale G, Citarella F, Carissimi C, et al.:
An emerging player in the adaptive immune response: microRNA-146a is a modulator of IL-2 expression and activation-induced cell death in T lymphocytes.
Blood.
2010; 115(2): 265–273. PubMed Abstract
| Publisher Full Text
- Debey S, Schoenbeck U, Hellmich M, et al.:
Comparison of different isolation techniques prior gene expression profiling of blood derived cells: impact on physiological responses, on overall expression and the role of different cell types.
Pharmacogenomics J.
2004; 4(3): 193–207. PubMed Abstract
| Publisher Full Text
- Gaarz A, Debey-Pascher S, Classen S, et al.:
Bead array-based microrna expression profiling of peripheral blood and the impact of different RNA isolation approaches.
J Mol Diagn.
2010; 12(3): 335–344. PubMed Abstract
| Publisher Full Text
| Free Full Text
- Guenther K, McCluskey M:
Maintaining the stability and integrity of RNA from whole blood samples. In CLI. 2008. Reference Source
- Hamilton AJ:
MicroRNA in erythrocytes.
Biochem Soc Trans.
2010; 38(Pt 1): 229–231. PubMed Abstract
| Publisher Full Text
- Ji J, Shi J, Budhu A, et al.:
MicroRNA Expression, Survival, and Response to Interferon in Liver Cancer.
N Engl J Med.
2009; 361(15): 1437–1447. PubMed Abstract
| Publisher Full Text
| Free Full Text
- Kozomara A, Griffiths-Jones S:
miRBase: annotating high confidence microRNAs using deep sequencing data.
Nucleic Acids Res.
2014; 42(Database issue): D68–73. PubMed Abstract
| Publisher Full Text
| Free Full Text
- McDonald JH:
Handbook of Biological Statistics. Sparky House Publishing, Baltimore, Maryland. 2009. Reference Source
- McDonald JS, Milosevic D, Reddi HV, et al.:
Analysis of Circulating MicroRNA: Preanalytical and Analytical Challenges.
Clin Chem.
2011; 57(6): 833–840. PubMed Abstract
| Publisher Full Text
- Min JL, Barrett A, Watts T, et al.:
Variability of gene expression profiles in human blood and lymphoblastoid cell lines.
BMC Genomics.
2010; 11: 96. PubMed Abstract
| Publisher Full Text
| Free Full Text
- Mookherjee N, El-Gabalawy HS:
High degree of correlation between whole blood and PBMC expression levels of miR-155 and miR-146a in healthy controls and rheumatoid arthritis patients.
J Immunol Methods.
2013; 400–401: 106–110. PubMed Abstract
| Publisher Full Text
- Patnaik SK, Yendamuri S, Kannisto E, et al.:
MicroRNA expression profiles of whole blood in lung adenocarcinoma.
PLoS One.
2012; 7(9): e46045. PubMed Abstract
| Publisher Full Text
| Free Full Text
- Pritchard CC, Kroh E, Wood B, et al.:
Blood Cell Origin of Circulating MicroRNAs: A Cautionary Note for Cancer Biomarker Studies.
Cancer Prev Res (Phila).
2012; 5(3): 492–497. PubMed Abstract
| Publisher Full Text
- Rasmussen KD, Simmini S, Abreu-Goodger C, et al.:
The miR-144/451 locus is required for erythroid homeostasis.
J Exp Med.
2010; 207(7): 1351–1358. PubMed Abstract
| Publisher Full Text
| Free Full Text
- Rieu I, Powers SJ:
Real-Time Quantitative RT-PCR: Design, Calculations, and Statistics.
Plant Cell.
2009; 21(4): 1031–1033. PubMed Abstract
| Publisher Full Text
| Free Full Text
- Schulte LN, Westermann AJ, Vogel J:
Differential activation and functional specialization of miR-146 and miR-155 in innate immune sensing.
Nucleic Acids Res.
2013; 41(1): 542–553. PubMed Abstract
| Publisher Full Text
| Free Full Text
- Sood P, Krek A, Zavolan M, et al.:
Cell-type-specific signatures of microRNAs on target mRNA expression.
Proc Natl Acad Sci U S A.
2006; 103(8): 2746–2751. PubMed Abstract
| Publisher Full Text
| Free Full Text
Comments on this article Comments (0)