Keywords
iNOS, migration, ligand, heme binding, FTIR
This article is included in the Oxygen-binding and sensing proteins collection.
iNOS, migration, ligand, heme binding, FTIR
We have made the following changes to the manuscript:
1. On page 6: ”In substrate free iNOSoxy-CO, recombination is already maximal at 4 K and extends to ~70 K.” was replaced by ”In substrate free iNOSoxy-CO, the TDS signal is maximal at 4 K, indicating that there is substantial rebinding already at this low temperature. Rebinding extends up to ~70 K.”
2. We also have added the following sentences on the same page:
“The solid contours at ~2144 cm‒1 in Figure 3f indicate a growth of this photoproduct population during the TDS measurement. Because data are taken in the dark, this can only occur via an exchange of photoproduct population from one band to another because of dynamics. Here, photoproduct population transfers from 2131 cm‒1 to ~2144 cm‒1, and the underlying process is most likely a rotation of the CO by 180° so as to attain thermal equilibrium between the two states corresponding to opposite orientations of the CO17.”
3. The legends of figures 3 and 4 were corrected:
…. (a, b) w/o substrate; (c, d) with H4B; (d, e) with L-Arg; (f, g) with NOHA was replaced by
…. (a, b) w/o substrate; (c, d) with H4B; (e, f) with L-Arg; (g, h) with NOHA
To read any peer review reports and author responses for this article, follow the "read" links in the Open Peer Review table.
Nitric oxide synthases (NOSs) are homodimeric heme enzymes that catalyze the oxidative degradation of L-arginine (L-Arg) to nitric oxide (NO)1,2. Three structurally similar NOS isoforms have been identified in endothelial cells (eNOS), neuronal tissues (nNOS) and in macrophages (iNOS)3. Different from eNOS and nNOS, iNOS is not expressed in resting cells but induced upon inflammatory and immunologic stimulation. Each NOS protomer consists of an oxygenase and a reductase domain. In the catalytic oxygenase domain (NOSoxy), dioxygen (O2) binds to a central heme prosthetic group, anchored to the polypeptide chain via a proximal cysteine residue (Figure 1). Its thiol sulfur atom accepts a hydrogen bond from an adjacent tryptophan residue. The substrate, L-Arg, is accommodated directly on top of the heme plane in the distal pocket; the cofactor tetrahydrobiopterin, H4B, binds along the side of the heme4–7. L-Arg and H4B are linked through an extended hydrogen bonding network mediated by one of the heme propionate groups. The reductase domain, NOSred, binds flavin mononucleotide (FMN), flavin adenine dinucleotide (FAD), and reduced nicotinamide adenine dinucleotide phosphate (NADPH). It provides the electrons for the catalytic reaction proceeding in the oxygenase domain. In a first step, L-Arg is converted to N-hydroxy L-Arg (NOHA). Subsequently, NOHA is decomposed into citrulline and nitric oxide (NO). Electron transfer is enabled by calmodulin binding in the interface between the two domains8.
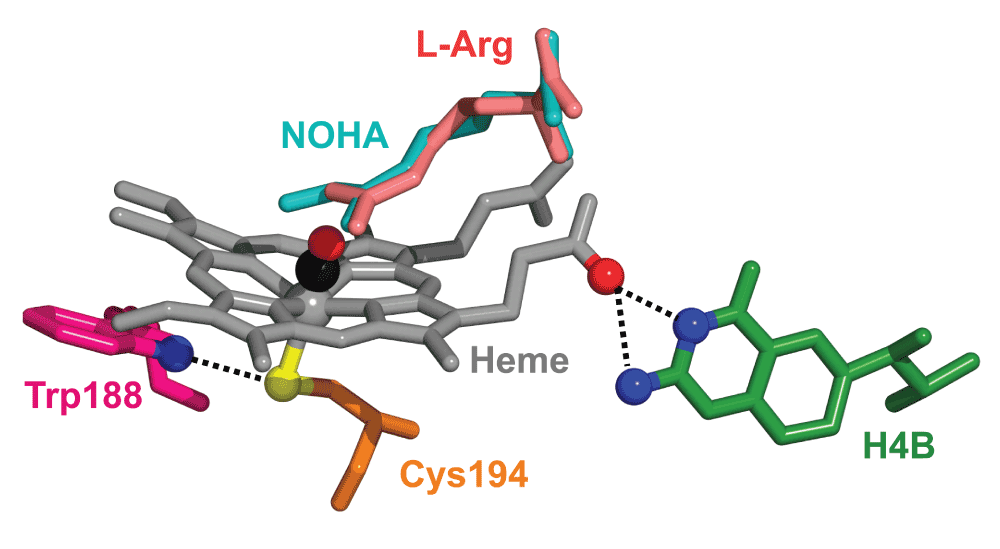
The CO ligand was added for illustration.
The NO molecule generated during enzymatic turnover can either coordinate directly to the heme iron or diffuse out of the protein into the environment. From there, it may again bind in a bimolecular process9. Formation of the very stable ferrous NO complex results in self-inhibition of the enzyme. The probability of forming this product depends on the dissociation rate coefficient of NO from the ferric heme, the likelihood of autoreduction of the ferric NO-bound form to the ferrous derivative with its much stronger NO affinity, and the probability of oxidizing the ferrous NO-bound species to the ferric form plus nitrate by O210. Deactivation of the enzyme may also occur via nitrosylation of the side chains of two cysteine residues coordinating a zinc ion in the dimer interface, which leads to irreversible dissociation into non-functional monomers11–14.
The iNOS isoform has been implicated in the pathogenesis of various diseases; so there is a growing interest in developing potent and highly selective inhibitors15,16. Their targeted design requires detailed insights into the interactions between ligand, substrate and the surrounding protein matrix. Therefore, we have investigated ligand and substrate binding in the iNOS oxygenase domain, iNOSoxy, by using Fourier transform infrared (FTIR) spectroscopy of the stretching vibrations of carbon monoxide (CO) and NO as ligands rather than the physiological ligand O2. They are of similar size as O2, which suggests that ligand dynamics within the protein may be comparable for all three ligands. CO and NO both have excellent properties as infrared (IR) spectroscopic probes17. CO has proven to be an attractive heme ligand because the CO bond stretching vibration gives rise to strong mid-IR absorption bands that can be measured with exquisite sensitivity and precision17,18. The IR bands are fine-tuned by electrostatic interactions with the environment19–21; therefore, CO is frequently utilized as a local probe of protein structure and dynamics22.
In the gas phase, CO absorbs at 2143 cm-123. When bound to the central iron of a heme cofactor, the CO stretching frequency, νCO, which is typically in the 1900 – 2000 cm-1 spectral range, is susceptible to changes in the iron-ligand bond and the local electric field due to the vibrational Stark effect24–29. There are two major contributions to the heme iron-CO bond, i.e., σ-donation from a weakly antibonding 5σ MO of CO to the iron 4s and 3dz2 orbitals and π-backbonding from the iron 3dz orbitals to the strongly antibonding CO 2π* orbital30. A positive charge located near the CO oxygen attracts electron density, causing a decrease in σ-donation and an increase in backbonding. Consequently, the C–O bond order is reduced and νCO shifts to lower values19–21. A negative charge has the opposite effect.
After photodissociation of CO-bound heme protein samples, the stretching bands of unbound CO trapped inside a protein are found within the range from ~2080 to ~2160 cm-118,31. The vibrational bands can reveal changes related to ligand relocation to other sites within the protein18,29,32,33, rotational motions of the ligand in these sites25,34 and protein conformational changes35. Often, there are doublets of bands corresponding to opposite orientations of the CO at a particular transient docking site27,29,32,36–38. The bond order and, therefore, νCO increases if the carbon atom interacts with a hydrogen bond donor, whereas an interaction with the ligand oxygen reduces both the bond strength and the stretching frequency29.
Unlike CO, which only binds to a ferrous (FeII) heme iron, NO may coordinate to both the ferrous and the ferric (FeIII) forms. So far, FTIR studies using NO have remained scarce because of its weaker intrinsic absorption. Furthermore, there is spectral overlap with the amide bands and ultrafast recombination of a major fraction of proteins even at very low temperatures. Therefore, only small photoproduct yields are obtained in experiments probing longer times such as FTIR, which renders experiments with ferrous NO technically challenging. Consequently, we have limited ourselves to NO binding to ferric heme in this work. For iNOS, this complex is of physiological relevance because the heme iron is in the ferric state after completion of the catalytic cycle.
Here, we have performed FTIR studies on iNOS at cryogenic temperatures, at which ligand rebinding is very slow. Thus, photoproducts induced by illumination are long-lived and can be conveniently studied by photolysis difference spectroscopy. Moreover, essentially all protein (and solvent) motions are frozen in39,40, so the ligands cannot escape to the solvent and can be observed within the protein matrix. We have combined FTIR with temperature-derivative spectroscopy (TDS)41–43, which allows us to disentangle photolysis-induced absorption changes caused by the different types of ligand dynamics.
The iNOSoxy domain, with its first 65 residues deleted (Δ65 iNOSoxy, referred to as iNOSoxy in the following), was expressed essentially as described44. Briefly, iNOSoxy containing plasmids (pCWori) were transformed into competent Escherichia coli cells (strain BL21). The cells were plated on agar in the presence of 390 µM ampicillin (Carl Roth, Karlsruhe, Germany) and cultured overnight at 37°C. A single colony was added to 150 ml terrific broth (TB, Carl Roth) supplemented with ampicillin (390 µM) and agitated for 12 h at 37°C and 250 rpm. 10 ml of the overnight culture were added to 1.5 l TB, containing 390 µM ampicillin, and grown to an optical density of ~1 at 600 nm. Then, the temperature was lowered to 30°C and δ-aminolevulinic acid (44 µM, Sigma-Aldrich, St. Louis, MO, USA) and hemin (8 µM, Sigma-Aldrich) were added. iNOS expression was induced by adding isopropyl β-D-1-thiogalactopyranoside (IPTG, Carl Roth) to a final concentration of 100 µM. After 48 h (fresh ampicillin was added every 16 h), the cells were harvested by centrifugation for 20 min at 4°C and 2,000 rpm (swing-bucket rotor, 4–16 K, Sigma, Osterode, Germany). The cells were resuspended in lysis buffer (40 mM HEPES, 10% glycerol (vol.), 200 mM NaCl, pH 7.6, Carl Roth), mixed with 2 mg DNase (Sigma-Aldrich), and ruptured using a bead-beater (Biospec, Bartlesville, USA), filled with 0.1 mm (diameter) zirconia/silica beads (three treatments of 2 min each). The lysate was separated from the beads by a glass filter and loaded onto an immobilized-metal ion affinity column equilibrated with lysis buffer (Ni Sepharose 6 FastFlow, GE Healthcare). After washing with lysis buffer supplemented with increasing concentrations of imidazole (0, 10, 40 mM, Sigma-Aldrich), the protein was eluted with lysis buffer containing 160 mM imidazole. Appropriate fractions were pooled, dialyzed against water and concentrated by using Vivaspin Turbo 15 (cut-off 10 kDa) centrifugal concentrators (Sartorius, Göttingen, Germany). Finally, the protein was lyophilized and stored at -20°C.
To prepare CO-ligated iNOSoxy, 12 mg freeze-dried iNOS were slowly added to 40 µl cryosolvent (75%/25% glycerol/100 mM potassium phosphate buffer (v/v), pH 7.4, and, if so desired, supplemented with L-Arg and NOHA substrate (Sigma-Aldrich) or H4B cofactor (Sigma-Aldrich) to reach final concentrations of 200 mM and 100 mM, respectively) and stirred under 1 atm CO for 60 min. Subsequently, a two-fold molar excess of an anaerobically prepared sodium dithionite solution (Sigma-Aldrich) was added with a gas-tight Hamilton syringe, and the solution was stirred for another 10 min. To remove any undissolved protein, the solution was centrifuged for 10 min at 13,400 rpm (Minispin centrifuge, Eppendorf, Hamburg, Germany) before loading it into the sample cell. For an NO-ligated sample, ferric iNOSoxy was dissolved in cryosolvent and stirred under an N2 atmosphere for 1 h. The gas phase above the sample was replaced repeatedly by N2 to efficiently remove O2. Finally, a few microliters of NO gas were added with a gas-tight syringe. NO ligation to the heme iron was confirmed by UV/vis absorption spectroscopy.
A few microliters of the sample solution were sandwiched between two CaF2 windows (diameter 25.4 mm) separated by a Mylar washer. The windows were mounted inside a block of oxygen-free high-conductivity copper. The copper block was attached to the cold-finger of a closed-cycle helium refrigerator (model F-50, Sumitomo, Tokyo, Japan). The sample temperature was measured with a silicon temperature sensor diode and regulated in the range 3 – 320 K by a digital temperature controller (model 336, Lake Shore Cryotronics, Westerville, OH). A continuous-wave, frequency-doubled Nd-YAG laser (Samba, Cobolt, Solna, Sweden), emitting up to 300 mW output power at 532 nm, was used to photolyze the sample. The laser beam was split and focused with lenses on the sample from both sides. Transmission spectra were recorded on a Vertex 80v FTIR spectrometer (Bruker, Karlsruhe, Germany) at a resolution of 2 cm–1, using either an InSb detector (75 µm thick Mylar, 1,700 to 2,300 cm–1) or an MCT detector (<5 µm thick Mylar, 1,100 to 2,300 cm–1).
The infrared absorption of CO and NO can be studied selectively by using photolysis difference spectroscopy, which involves measurement of IR transmission spectra, I(ν, T), before and after photolysis. The difference absorbance of the two spectra, ΔA(ν, T) = log(Idark/Ilight), contains only features that are due to photodissociation of the ligand from the heme iron. The missing absorption of the heme-bound ligands (A bands) after photolysis and the corresponding absorption of the photolyzed ligands (photoproduct bands) are displayed with negative and positive amplitudes, respectively. Peak positions and fractional occupancies were determined by fits with Gaussian band shapes; they are compiled in Table 1. In the following, we use the Gaussian band positions (frequencies) at 4 K as a subscript to ‘A’ (denoting the heme-bound state) to distinguish the absorbance bands and also to refer to a particular substate of the protein.
Different illumination protocols were applied for photodissociation17. Before starting a TDS experiment, the sample was illuminated for 10 s at 4 K to trap the photolyzed ligand close to the heme iron at the so-called primary docking site B. Alternatively, under ‘slow-cool’ illumination, the sample was cooled from 160 to 4 K at a rate 0.3 K/min under constant laser illumination to enable the photodissociated ligands to sample alternative docking sites that may not be accessible upon photolysis at 4 K. In both protocols, 300 mW laser power at 532 nm was used. To monitor the photodissociation kinetics, the samples were continuously illuminated for 15,000 s at reduced laser power (0.3 mW or 10 mW), and transmission spectra were recorded continuously. For comparison, the photolysis yield was scaled with respect to complete photodissociation with full laser power (300 mW).
TDS, an experimental protocol designed to study thermally activated rate processes involving enthalpy barrier distributions, has been described in great detail elsewhere41–43. Briefly, a non-equilibrium state is created in the sample at low temperature, e.g., by photolysis with visible light. The integrated absorbance, A, of a spectral band taken at the lowest temperature represents the total photolyzed population, N. Subsequently, thermal relaxation of the sample back to equilibrium is recorded while the sample temperature is ramped up linearly over a few hours in the dark. One FTIR transmission spectrum is taken for every 1-K temperature increase. In the simplest analysis, we assume that any change in integrated absorbance is due to ligand rebinding and, therefore, proportional to a population change, ΔN, during acquisition of two successive spectra. TDS data are conveniently presented as two-dimensional contour plots, with solid lines indicating an absorbance increase and dashed lines a decrease. Contours are spaced logarithmically to emphasize small features.
In the following, we present 4-K FTIR photolysis difference spectra of iNOSoxy-CO and briefly discuss the influence of substrate, substrate intermediate and cofactor on the CO stretching vibration and rebinding. For additional information, we refer to Jung et al.45 and Li et al.46.
Photolysis difference spectra at 4 K. The 4-K absorption difference spectrum of iNOSoxy-CO displays two broad, extensively overlapping A bands at 1945 and 1959 cm–1, indicative of two active site subconformations with significant intrinsic structural heterogeneity (Figure 2a). Adding the H4B cofactor induces only small changes; the resulting spectrum can be described by a dominant A band centered on 1951 cm-1 and a minor one at 1924 cm-1 (Figure 2a). As H4B binds along the side of the heme4 and, thus, not in the immediate vicinity of the heme-bound CO, it is not expected to modify νCO to any significant extent. In contrast, the presence of L-Arg shifts the main A band of iNOSoxy-CO/L-Arg to 1904 cm-1; smaller features are located at 1921 and 1951 cm-1 (Figure 2a). The pronounced red-shift of A1904 arises from the electron-withdrawing effect of the terminal, positively charged NH2+ moiety of the L-Arg side chain close to the bound CO4. The position of the A1921 band is indicative of an electrostatic interaction of the CO dipole with a less pronounced positive partial charge, most likely the neutral terminal amino group of the L-Arg side chain.
If the reaction intermediate NOHA is present, three A bands at 1903, 1937 and 1956 cm-1 are discernable (Figure 2a). The crystal structure shows that NOHA binds in the same orientation in the active site as L-Arg, with the side chain pointing towards the heme iron47. Therefore, we suggest that, in those iNOSoxy molecules absorbing within the A1937 band, a hydrogen bonding interaction exists between the CO ligand and the hydroxyl group of the NOHA side chain. A1903 is most likely associated with iNOSoxy molecules, in which the terminal amine of the NOHA side chain is protonated (pK = 8.148) and points towards the heme-bound CO. The protonated NOHA has been suggested to be the catalytically active substrate intermediate49,50.
The absorption spectra of photolyzed CO are plotted in Figures 2b (brief illumination at 4 K) and 2c (slow-cool illumination); peak positions and relative areas are included in Table 1. For comparison, the integrated absorption in each spectral region was scaled to the same area. We note that the ratio of the integrated areas of the A and photoproduct bands is ~2018.
All photoproduct spectra obtained after 10-s illumination at 4 K have absorption bands in the 2120 – 2130 cm-1 spectral range (Figure 2b). The spectrum of iNOSoxy-CO is composed of two stretching bands at 2124 and 2129 cm-1. With H4B, photoproduct bands appear at 2124 and 2133 cm-1, indicating that the cofactor has an effect on νCO of the unbound CO. In the presence of L-Arg, the absorption bands are centered on 2120 and 2131 cm-1, and there are two additional bands at 2144 and 2150 cm-1. Their higher stretching frequencies suggest formation of a hydrogen bond between the ligand carbon and the terminal amine group of L-Arg29. Upon NOHA binding, the photoproduct bands are centered on 2122 and 2133 cm-1. The minor absorption at 2145 cm-1 can be associated with CO ligands photolyzed from iNOSoxy/NOHA trapped in its A1903 conformation.
The photoproduct spectra obtained after slow-cool illumination (Figure 2c) are similar to the ones recorded after 10-s illumination (Figure 2b), suggesting that it is not possible to populate additional docking sites to any significant extent. The greatest difference is seen for iNOSoxy-CO. Its photoproduct spectrum shows two well separated bands at 2124 and 2134 cm-1 rather than the non-separated doublet seen in Figure 2b. We also note that there is an additional shoulder at 2117 cm-1 for iNOSoxy-CO/NOHA.
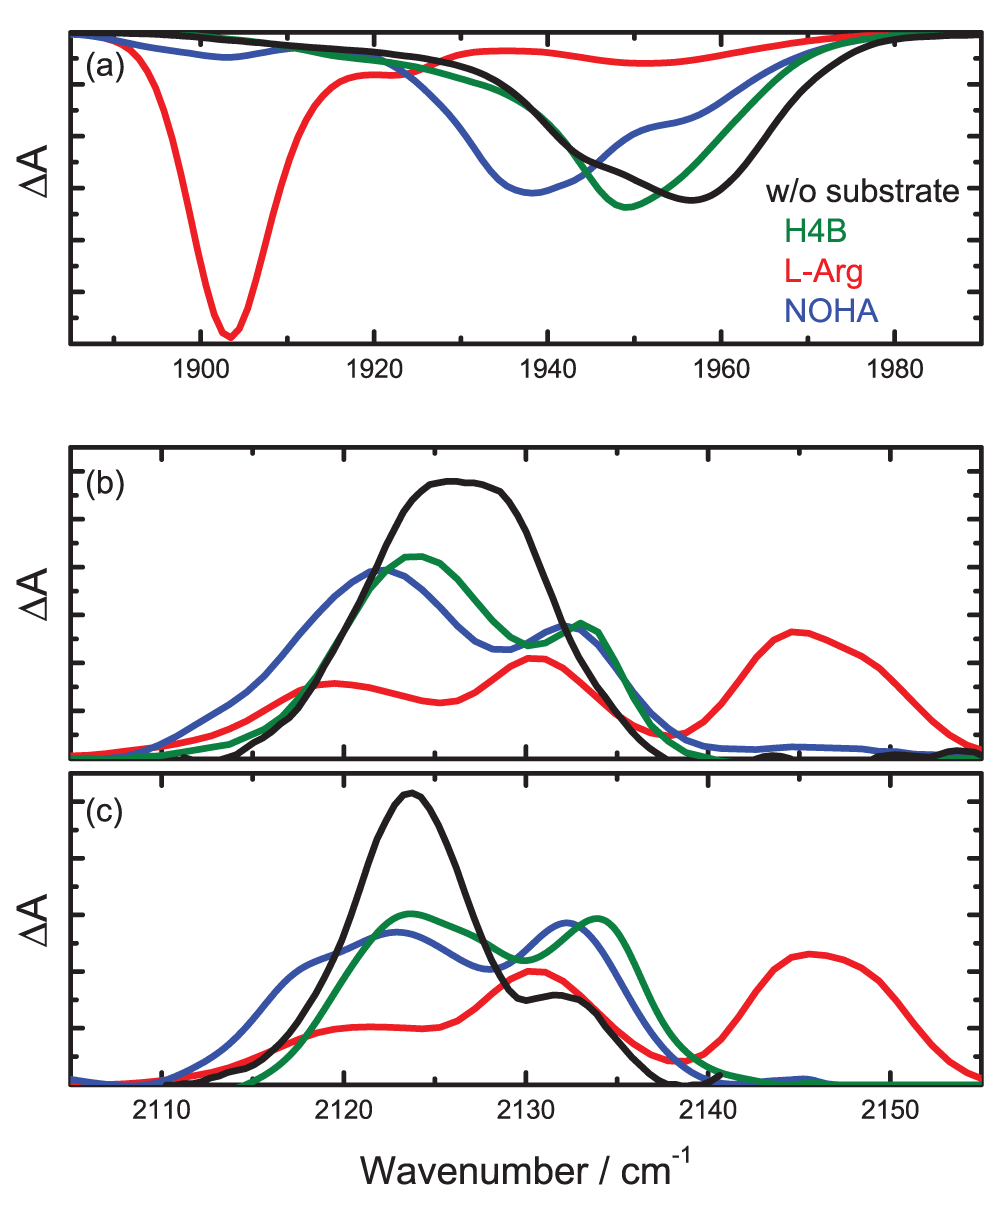
(a) Absorption of the heme-bound CO. (b) Photoproduct bands obtained after 10-s illumination at 4 K. (c) Photoproduct bands obtained after constant illumination during slow cooling from 160 to 4 K.
CO rebinding in iNOSoxy. To obtain more information on the photoproduct states, TDS measurements were started at 4 K immediately after illumination. Figure 3 displays the contour maps obtained after 10-s illumination at 4 K, with the absorption changes in the A bands and the photoproduct bands in the left and right columns, respectively.
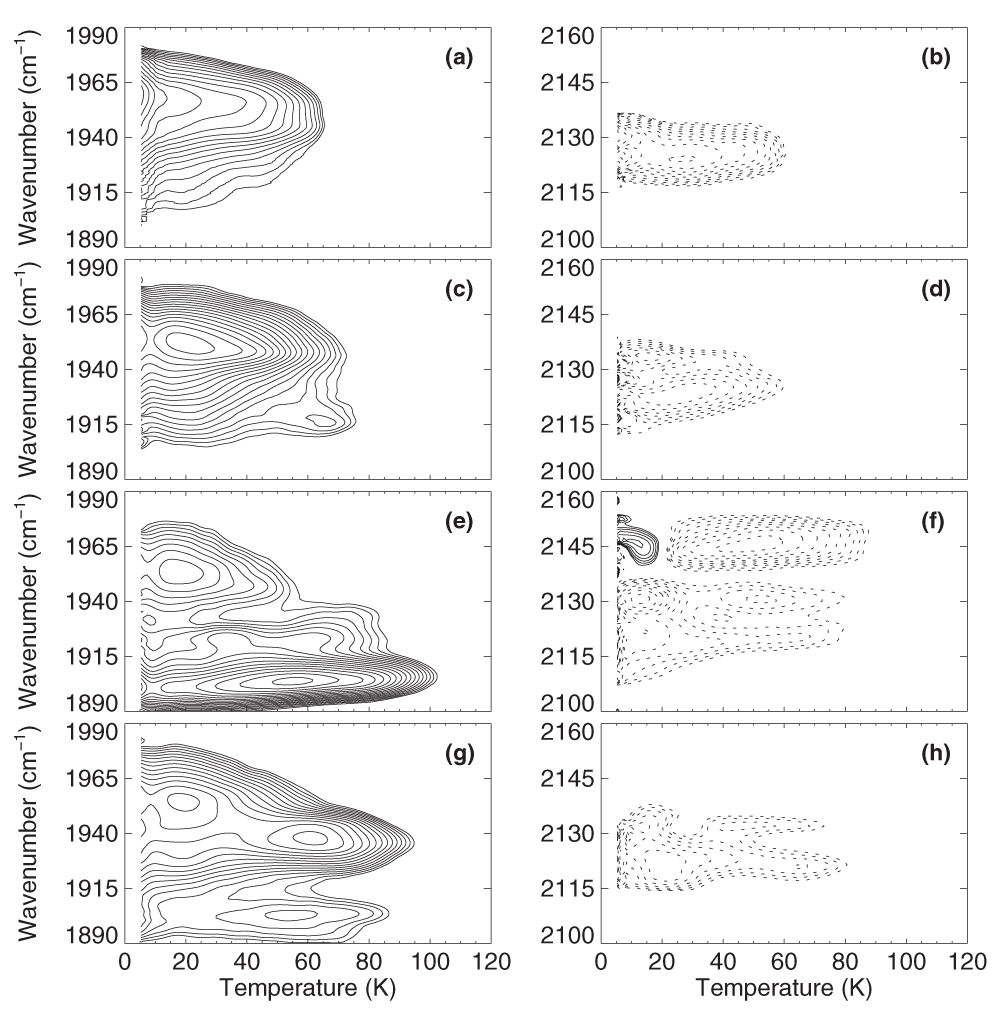
Left column: Absorption changes in the bands of heme-bound CO. Right column: Absorption changes in the photoproduct bands. Contours are spaced logarithmically; solid and dotted lines represent increasing and decreasing absorption, respectively. iNOSoxy-CO (a, b) w/o substrate; (c, d) with H4B; (e, f) with L-Arg; (g, h) with NOHA.
All iNOSoxy-CO samples display single-step CO rebinding. This observation indicates that there is only a single kinetic state of the photolyzed protein-ligand complex, and the presence of sharp photoproduct bands indicates that the photolyzed ligands are trapped in transient docking sites with well-defined orientations. In substrate-free iNOSoxy-CO, recombination is maximal at 4 K, indicating that there is substantial rebinding already at this low temperature. Rebinding extends up to ~70 K (Figure 3a, b). Rebinding in the dominant A1951 substate of iNOSoxy-CO/H4B peaks at 20 K; as in iNOSoxy-CO, the process extends to 70 K. Only the minor A1924 subpopulation shows a focused rebinding peak at ~60 K (Figure 3c). The photoproduct map does not yield additional information (Figure 3d). Binding of either L-Arg or NOHA in the active site shifts CO rebinding to higher temperatures, suggesting that the hydrogen bonding interaction stabilizes the ligands at the transient docking site against rebinding (Figures 3e and 3g). Maximal rebinding in iNOSoxy/NOHA, i.e., in A1903 and A1937, occurs at 50 – 60 K (Figure 3g). The corresponding photoproduct bands are centered on 2122 and 2133 cm-1 (Figure 3h). The contours at 1950 – 1960 cm-1 (Figure 3g) represent rebinding in the NOHA-free A1956 substate. With L-Arg anchored in the active site, CO ligands return to the heme iron also at ~50 – 60 K (Figure 3e). The corresponding photoproduct map shows a concomitant loss of the photoproduct bands at 2150, 2144, 2131 and 2120 cm-1, associating these bands with CO molecules trapped in the vicinity of the substrate (Figure 3f). A population transfer between photoproduct states due to CO rotation32,51,52 is apparent from the mirror-imaged dashed and solid contours at 2131 and 2144 cm-1 at 12 K. The solid contours at ~2144 cm-1 in Figure 3f indicate a growth of this photoproduct population during the TDS measurement. Because data are taken in the dark, this can only occur via an exchange of photoproduct population from one band to another because of dynamics. Here, photoproduct population transfers from 2131 cm-1 to ~2144 cm-1, and the underlying process is most likely a rotation of the CO by 180° so as to attain thermal equilibrium between the two states corresponding to opposite orientations of the CO17.
The TDS maps after slow-cool illumination (Figure 4) show only marginal differences to the ones obtained after brief 4-K illumination (Figure 3), which confirms that the photodissociated CO ligands populate only a single kinetic state. Notably, after slow-cool illumination, rebinding generally occurs at slightly higher temperatures than after brief 4-K illumination. The observed slowing may be attributed to small structural changes near the active site, causing an increase of the ligand binding barrier. A similar effect was also visible in MbCO upon extended illumination below 40 K42 as well as in NO- and CO-ligated nitrophorin 435.
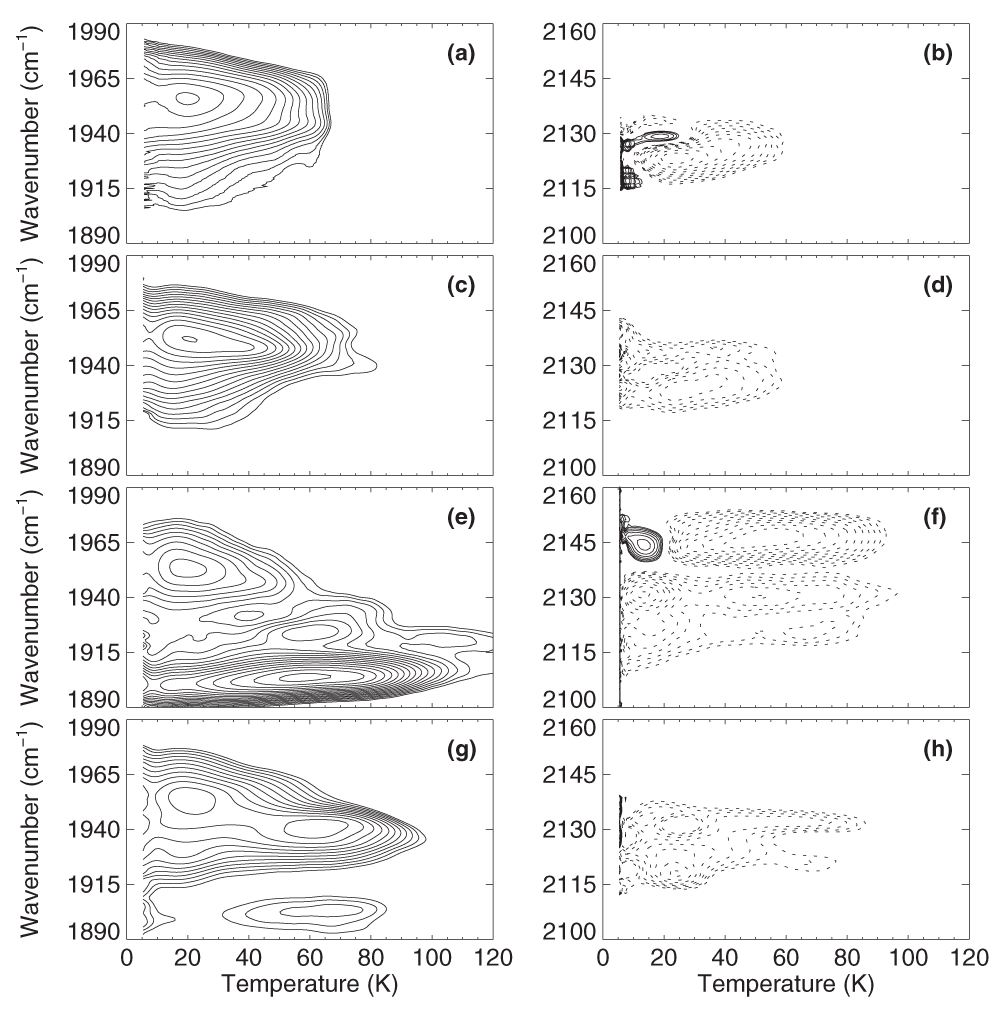
Left column: Absorption changes in the bands of heme-bound CO. Right column: Absorption changes in the photoproduct bands. Contours are spaced logarithmically; solid and dotted lines represent increasing and decreasing absorption, respectively. iNOSoxy-CO (a, b) w/o substrate; (c, d) with H4B; (e, f) with L-Arg; (g, h) with NOHA.
In a typical globin protein involved in ligand transport or storage, the primary ligand docking site B is indispensable because it ensures efficient ligand binding to and release from the heme iron53. Incoming ligands are ‘caught’ in site B before the actual bond formation process occurs32,54. Upon thermal dissociation from the heme iron, ligands can remain unbound in site B for some time, which increases their probability to escape from the protein. Without this site, they would immediately recombine with the heme iron, as is, e.g., observed for NO-transporting nitrophorin35 and modified cytochrome c55.
The catalytic reaction of iNOS requires sequential binding of two O2 molecules and efficient release of the NO product. Therefore, the B site is likely to have dual functionality. On the one hand, it allows efficient O2 binding to the heme iron. On the other hand, it ensures efficient release of the generated NO. Using CO as a ligand, we have shown that the B site is readily accessible for ligands photodissociated from the heme iron, both in the presence and absence of L-Arg or NOHA. The substrates stabilize the CO ligand at the transient site via hydrogen bonding. This stabilizing effect is also seen for the minor A1924 subpopulation of iNOSoxy/H4B. Presumably, a small fraction of H4B molecules are positioned such that they can form a direct hydrogen bond.
The NO stretching absorption is also very suitable as a local probe of the active site structure and of ligand movements within a protein17. Despite their similar sizes, the ligands may show different dynamics inside the protein56. For example, in myoglobin (Mb), a transient docking site on the proximal side of the heme is readily populated by CO but not at all by NO56. Such subtle differences could be relevant for the inhibitory effects of NO. Therefore, we have analyzed NO binding in ferric iNOSoxy using FTIR-TDS at cryogenic temperatures.
Photolysis difference spectra at 4 K. Figure 5 displays 4-K photolysis difference spectra of various ferric iNOSoxy-NO preparations. Most spectra show an A band at 1870 cm-1 associated with NO bound in an active site without bound cofactor or substrate (Table 1). In the spectrum of iNOSoxy-NO, A1870 is rather broad, suggesting significant conformational heterogeneity at the active site. The spectrum of iNOSoxy-NO/NOHA is very similar, dominated by the broad A1870 band; the only clear change from iNOSoxy-NO is a shoulder at 1851 cm-1. This comparison suggests that NOHA is bound only in a small subfraction reflected by the shoulder. In iNOSoxy-NO/L-Arg, A1847 and A1829 report the binding of L-Arg. A1870 is still present due to incomplete saturation with substrate (Figure 5). Interestingly, Rousseau et al.2 could not identify any changes of νFe-N in their resonance Raman spectra upon binding of L-Arg and even hypothesized that L-Arg does not bind to ferric iNOSoxy-NO. With H4B anchored next to the heme, the A band is shifted to 1872 cm-1, and another absorption band emerges at 1890 cm-1.
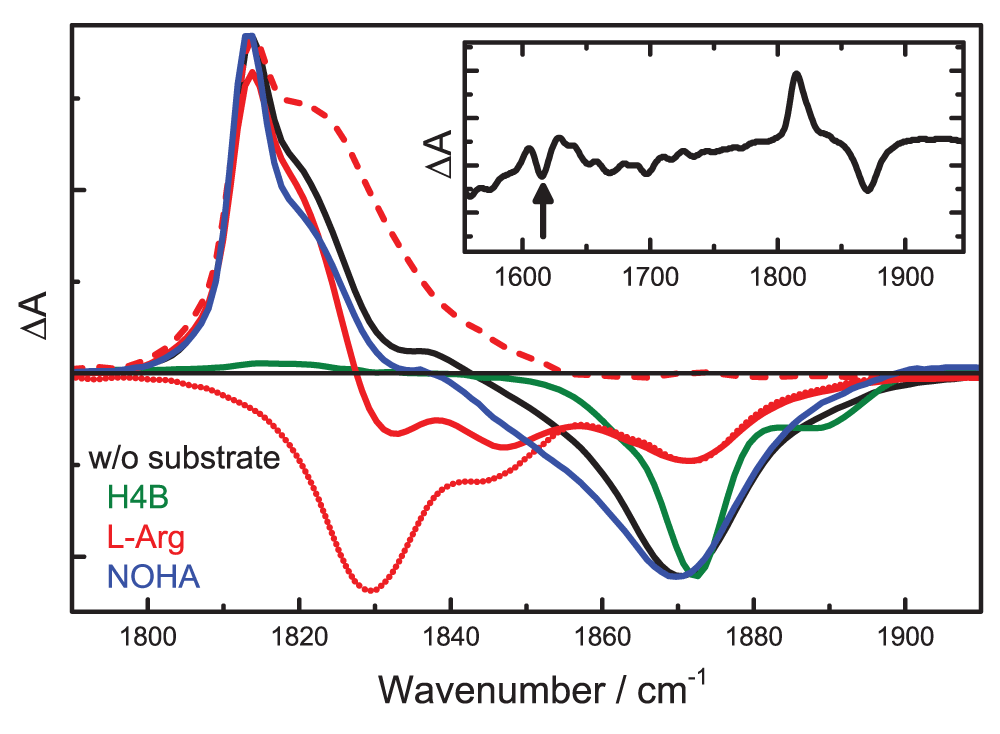
The stretching bands of heme-bound NO (NO after laser illumination at 300 mW) are plotted with negative (positive) amplitude. A bands of the NOHA spectrum were scaled independently of photoproducts (factor 2.07) to match the A bands of the spectrum without substrate. Dotted line: 4-K photolysis difference spectrum of iNOSoxy-NO/L-Arg, obtained upon illumination at 0.3 mW. Dashed line: iNOSoxy-NO/L-Arg photoproduct spectrum (obtained by calculating the difference between the two iNOSoxy-NO/L-Arg spectra). Inset: extended 4-K photolysis difference spectrum of iNOSoxy-NO.
Most of the observed spectral shifts can again be explained by backbonding57 because the ferric NO-ligated ground state, which is best described as FeIINO+, is isoelectronic to FeIICO58. The heme-bound NO absorbs at 1870 cm-1. L-Arg shifts νNO to lower frequencies; the A1829 and A1847 bands indicate an interaction between the NO and the positively charged and neutral terminal amino groups of the L-Arg side chain. As already observed for CO, the effect of NOHA is less pronounced; its presence is visible via a shift of the A band to 1851 cm-1. Interestingly, the NO stretching absorption is also affected by H4B. The band shifts slightly and, in addition, it becomes rather narrow, which is indicative of a more homogeneous active site environment or restricted dynamics of the heme-bound NO due to the bound H4B35,59. In 2005, Rousseau et al.2 reported that, upon H4B binding, a Raman band emerges that was assigned to the Fe-N-O bending mode, δFe-N-O, of the ferric adduct, indicating a more homogeneous bending of the bent NO. In thiolate-ligated FeIIINO adducts, NO is typically bound at an angle of 160°60–66, and H4B binding next to the heme is not expected to modify this angle due to steric interactions. It may, however, restrict its librational dynamics around this angle, possibly because of the increased heme distortion caused by H4B67,68. The additional band at 1890 cm-1 may indicate partial occupancy of a water molecule in the active site62.
The photoproduct bands, displayed in Figure 5 with positive amplitudes, are in the 1810 – 1830 cm-1 spectral range and, thus, red-shifted by only ~50 cm-1 from those of the heme-bound NO (Table 1). For iNOSoxy-NO/L-Arg, the photoproduct and A bands even overlap. Their decomposition (details are discussed below) yields a narrow photoproduct band at 1814 cm-1 and a broad feature at 1822 cm-1. iNOSoxy-NO and iNOSoxy-NO/NOHA show two photoproduct bands at 1814 and 1818 cm-1. Interestingly, these bands are about as strong as the A bands, which strongly suggests that they do not represent unbound NO trapped in a transient docking site but rather heme-bound NO with restricted librational freedom.
In contrast to all other samples, the iNOSoxy-NO/H4B photoproduct spectrum reveals only a very weak feature at ~1818 cm-1. This finding may be explained by a photolyzed NO that cannot be trapped in well-defined orientations. As a result, the stretching absorption becomes extremely broad and hardly distinguishable from the background. A similar effect was observed for NO in the primary photoproduct site B of ferric Mb56.
NO rebinding in ferric iNOSoxy. To gain additional information on the peculiar, strongly absorbing NO photoproduct bands, TDS experiments were started immediately after illuminating NO-ligated samples at 4 K. Figure 6 displays the absorption changes in the A bands and in the photoproduct bands with solid and dotted lines, respectively. The contour maps obtained after slow cool illumination (not shown) are essentially identical, as for the CO-ligated samples.
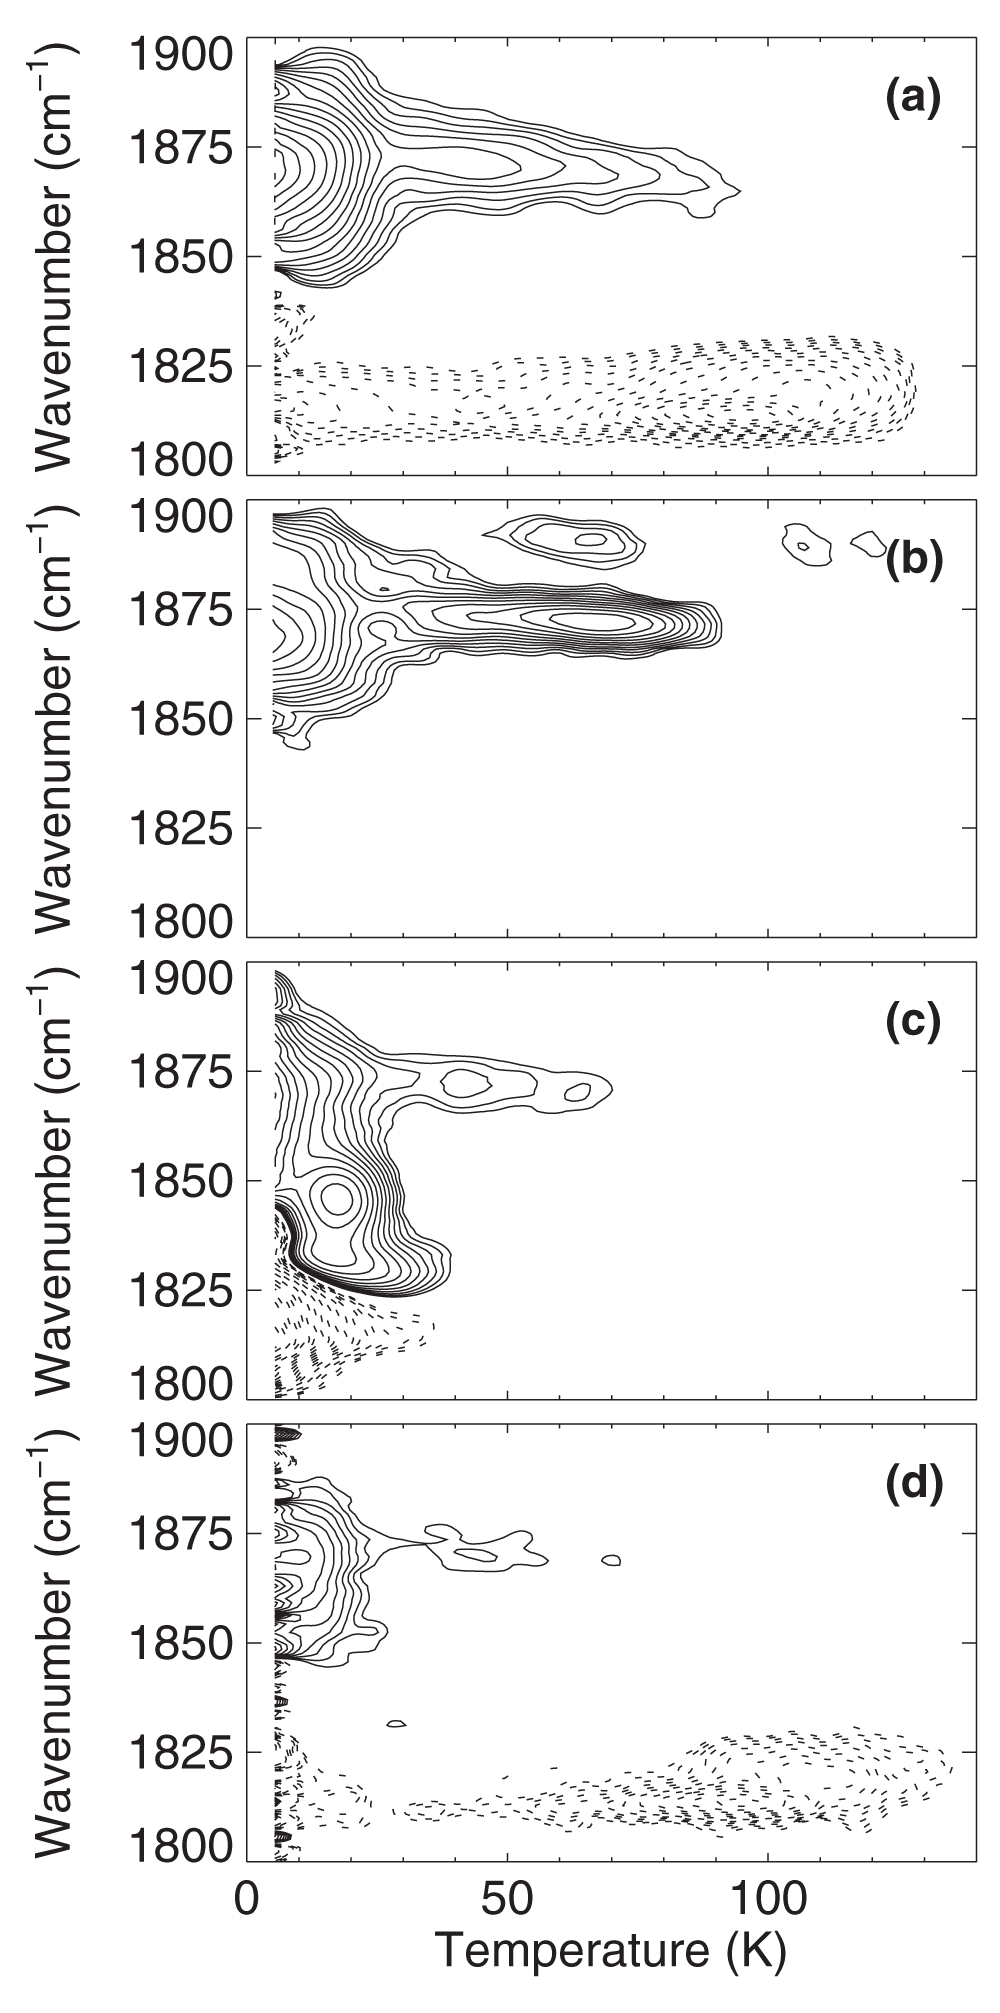
iNOSoxy-NO (a) w/o substrate; (b) with H4B; (c) with L-Arg; (d) with NOHA. Contours are spaced logarithmically; solid and dotted lines represent increasing and decreasing absorption, respectively.
In iNOSoxy-NO, NO rebinding in A1870 starts already at the lowest temperatures (Figure 6a) and extends to ~90 K. The decay of the photoproduct, however, occurs predominantly between 80 and 120 K, indicating that these bands cannot be associated with NO ligands photolyzed from the ferric heme iron, as reported by the A1870 band. Apparently, laser illumination produces a photoproduct band from another NO species in the sample. The TDS map of iNOSoxy-NO/NOHA (Figure 6d) shows essentially the same features. It is likewise evident that NO rebinding is complete below 80 K, whereas the strange photoproduct feature disappears in the temperature range 80 – 120 K. In iNOSoxy-NO/H4B (Figure 6b), NO rebinding at the ferric iron also starts at 4 K. In a subpopulation, recombination peaks at ~65 K; absorption changes of photoproducts are too small to be detected. NO rebinding in the L-Arg-bound A1829 and A1847 substates occurs mainly below 30 K, concomitantly with the decay of the photoproduct (Figure 6c). The apparent maximum in the contours at 15 K and ~1850 cm-1 is artificial and results from the superposition of the A bands and the photoproduct bands (compare Figure 5). Recombination in the substrate-free A1870 fraction of the sample is maximal at 4 K and extends out to ~70 K, consistent with the data shown in Figure 6a.
In summary, rebinding of NO to the ferric heme of iNOSoxy is a one-step process. The corresponding photoproduct bands, i.e., the absorption bands of NO photodissociated from the ferric heme, were not identifiable. Presumably, NO is bound only weakly within the protein, without any well-defined orientation and without any additional stabilization via hydrogen bonding interactions to the substrate or the cofactor. As a consequence, the NO has a broad stretching absorption that cannot be distinguished from the background. Note that, if the photoproduct bands were masked by the strong bands at ~1820 cm-1, they should have become visible in the spectrum of iNOSoxy-NO/H4B (Figure 5).
Identification of the iNOSoxy-NO photoproduct. The TDS data in Figure 5 clearly prove that the strong absorption bands at ~1820 cm-1 are not generated by photodissociation of NO bound to ferric heme, absorbing at ~1870 cm-1. To identify the corresponding pre-illumination states, we screened the 4-K FTIR photolysis difference spectrum of iNOSoxy-NO from 1,100 to 2,300 cm-1 and detected a band at 1616 cm-1, which we tentatively associate with a six-coordinate (6C) ferrous NO adduct (Figure 5, inset). This assignment is supported by the νNO of 1591 cm-1 reported for 6C ferrous P450cam-NO69. Praneeth et al.70 also computed frequencies in this range, νNO = 1617 cm-1 and νNO < 1600 cm-1 for thiophenolate- and alkylthiolate-heme complexes, respectively, using density functional theory calculations on ferrous, thiolate-coordinated porphyrin model systems.
The admixture of a ferrous NO species in our samples does not come as a surprise. Ferric iNOSoxy-NO is unstable and spontaneously converts to a ferrous 6C NO-ligated species. This conversion may take place during loading and cooling of an FTIR sample, which typically takes ~2 h. This species may subsequently evolve further to a five-coordinate (5C) complex by dissociation of the thiolate ligand on time scales of minutes to hours, depending on the iNOSoxy oligomerization state67,71–73. Here, we can safely exclude formation of significant amounts of 5C ferrous iNOSoxy-NO because we have not observed the characteristic IR bands of this species at ~1670 cm-153.
NO photodissociation from the 6C adduct is not expected to generate NO photoproduct bands that are of similar strength as the original A1616 band. Therefore, there must be yet another species responsible for the strong absorption at ~1820 cm-1. Perhaps, light-induced breakage of the iron-sulfur rather than the iron-NO bond could lead to an alternative photoproduct, considering the strong trans effect exerted by the NO in 6C ferrous heme NO adducts66. Indeed, Ibrahim et al.74 had noticed earlier that laser light passing through solution samples of 6C ferrous model porphyrins adducts during resonance Raman measurements was sufficient to photodissociate the axial thiolate base trans to the NO75. This effect could be suppressed by lowering the temperature to 77 K and reducing the laser power. Accordingly, we have illuminated the iNOSoxy-NO/L-Arg sample at low laser intensity (0.3 mW at 532 nm). This power was still sufficient to photodissociate the NO from the 6C ferric heme adduct (dotted line in Figure 5), photoproduct bands at ~1820 cm-1, however, did not emerge, confirming that the photoproduct was not formed. Therefore, we propose that illumination of 6C ferrous iNOSoxy-NO with sufficient laser power leads to rupture of the bond between the iron and the proximal Cys194 thiolate, leaving behind a 5C iNOSoxy-NO. Because the NO is still bound to the heme iron, the intensity of the IR bands at ~1820 cm-1 is comparable to that of other A bands25,34. The NO stretching frequency of the 5C adduct indicates that the ligand is coordinated to a ferric iron, so that the Cys194 sulfur is negatively charged after photodissociation. Similar NO stretching frequencies were reported for an isolated 5C ferric heme nitrosyl complex (νNO = 1842 cm-176) and for NO-ligated porphyrins with phenyl (νNO = 1825 cm-1) and pentafluorophenyl (νNO = 1859 cm-1) substituents on the four meso positions77. If the laser power is sufficiently high (300 mW), it is even possible to photodissociate the NO from the 5C ferric iNOSoxy-NO, leaving behind a four-coordinate, ‘naked’ heme as a ‘secondary photoproduct’ (Figure 7a).
L-Arg binding in the active site lowers the yield of ferric 5C iNOSoxy-NO upon laser illumination (Figures 7a and c) and favors reformation of the iron-sulfur bond as soon as the laser is switched off (Figures 7b and d). This effect may result from the competition between the NO ligand and the thiolate for σ charge donation to the heme iron; the higher the donation, the stronger the bond to the donor and the weaker the bond to the opposing heme ligand. The σ donor strength of the thiolate is altered by hydrogen bonding interactions to the sulfur atom66. Using sulfur K-edge x-ray absorption spectroscopy and density functional theory calculations, Dey et al.78 showed that each hydrogen bond reduces the electron-donating power of the thiolate sulfur. The NO electron donor ability and, therefore, its repulsive trans effect can be reduced by interactions that draw electron density away from the NO79,80, here by the hydrogen bonding interaction with L-Arg, so that the axial iron-sulfur bond is stabilized.
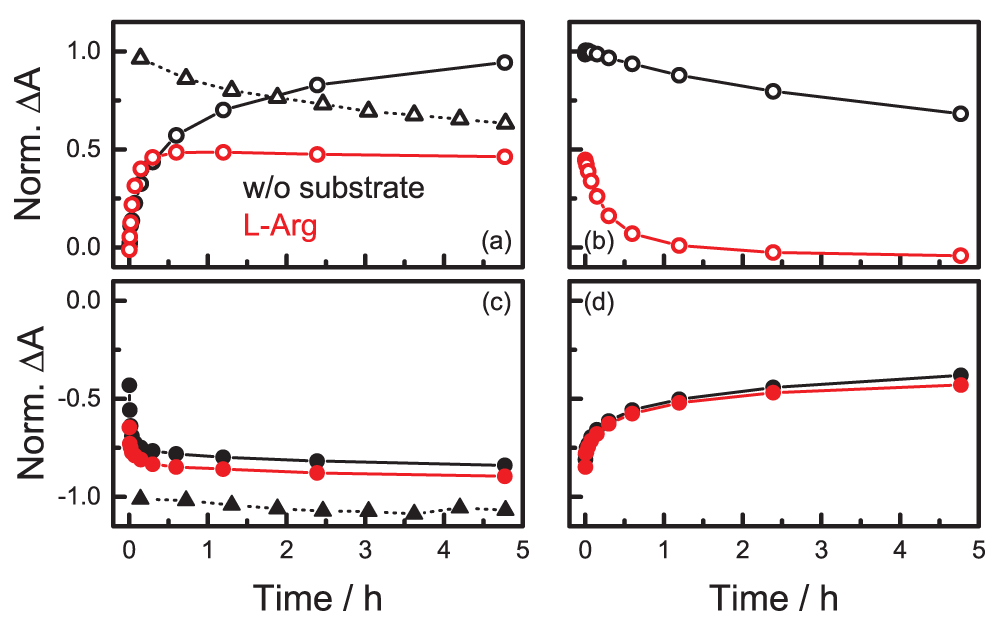
Temporal development of the integrated absorbance of the bands of 5C ferric iNOSoxy-NO (open symbols) and 6C ferric iNOSoxy-NO (filled symbols) (a, c) during constant illumination at 4 K (circles: 10 mW, 532 nm; triangles: 300 mW, 532 nm) and (b, d) after the laser was switched off. Black: iNOSoxy-NO; red: iNOSoxy-NO/L-Arg.
We also note that 6C ferrous iNOSoxy-NO is not stable in the presence of H4B but spontaneously oxidizes to the ferric form46. Consequently, the yield of the 5C adduct is negligible, as is indicated by the low intensity of the absorption bands (Figure 5).
Ferric 5C iNOSoxy-NO. In view of the competition between the NO ligand and the thiolate for σ charge donation to the heme iron, one should expect νNO of the 5C photoproduct lacking the thiolate ligand to be blue-shifted with respect to νNO of the 6C adduct because the repulsive trans effect of the thiolate has been removed. Experimentally, however, the opposite behavior is observed (Figure 5). To resolve this apparent discrepancy, one has to consider that the 5C ferric form originates from a 6C ferrous species, in which the NO is typically bound at an angle of ~140°. In the corresponding 6C ferric derivatives, the Fe – N – O angle is normally ~160°. At cryogenic temperatures, the dynamics of the protein matrix is completely arrested39,40.
Consequently, the NO is held in the strongly bent (lower angle) orientation of the 6C ferrous form. Based on DFT calculations, Linder et al.81 reported that reducing the angle from 160° to 150° shifts νNO in 5C model porphyrins from 1897 to 1857 cm-1. Therefore, we suggest that the low νNO of the 5C form is caused by NO binding at a small angle. We note that the similar νNO in 5C and 6C ferric iNOSoxy-NO/L-Arg implies that the bound substrate controls the angle at which the NO binds. Apparently, steric constraints override the bending induced by the trans effects.
Finally, we point out that, in contrast to the photo-induced 6C ferric → 5C ferric transition observed in the FTIR experiments at cryogenic temperatures, the spontaneous conversion of the 6C ferric NO-bound iNOSoxy derivative at physiological temperatures involves two NO molecules and yields a 5C ferrous species71,72,82. After binding the first NO, the ferric 6C iNOSoxy-NO reacts with a second ligand to yield 6C ferrous iNOSoxy-NO. This complex immediately converts to the 5C form and a nitrosonium ion (NO+). The ion may diffuse towards the zinc binding site and nitrosylate one of the Cys residues involved in coordinating the zinc.
FTIR spectroscopy at cryogenic temperatures, especially in combination with sophisticated illumination and data acquisition temperature protocols, provides quantitative data on protein-ligand interactions. Our FTIR-TDS studies on iNOSoxy have shown that CO and NO rebinding involve only a single transient state in iNOSoxy. The CO is stabilized in well-defined orientations at the docking site by hydrogen bonding interactions and, therefore, gives rise to rather narrow photoproduct bands. In contrast, photoproduct bands associated with the photolyzed NO cannot be resolved. The NO appears to be trapped in less specific orientations, which may favor the release of this ligand. Under physiological conditions, release of the generated NO from the protein is facilitated.
Upon illumination of 6C ferrous iNOSoxy-NO at cryogenic temperatures, a 5C ferric NO adduct was identified, providing direct evidence for light-induced breakage of the iron-thiolate bond. Future studies along these lines are likely to contribute to a better understanding of functional processes in which the NO ligand is involved.
F1000Research: Dataset 1. Fourier transform infrared photolysis difference spectra of CO- and NO-ligated inducible nitric oxide synthase, 10.5256/f1000research.5836.d3948183
Michael Horn performed the experiments. All authors have contributed to planning the experiments and analyzing the results. All authors were involved in writing and editing the draft of this manuscript. All authors have read and approved the final version.
This work was supported by the Deutsche Forschungsgemeinschaft (Grant Ni291/10). We acknowledge support by Deutsche Forschungsgemeinschaft and Open Access Publishing Fund of Karlsruhe Institute of Technology.
The funders had no role in study design, data collection and analysis, decision to publish, or preparation of the manuscript.
| Views | Downloads | |
|---|---|---|
| F1000Research | - | - |
|
PubMed Central
Data from PMC are received and updated monthly.
|
- | - |
Competing Interests: No competing interests were disclosed.
Competing Interests: No competing interests were disclosed.
Alongside their report, reviewers assign a status to the article:
| Invited Reviewers | ||
|---|---|---|
| 1 | 2 | |
|
Version 2 (revision) 12 Dec 14 |
||
|
Version 1 28 Nov 14 |
read | read |
Click here to access the data.
Spreadsheet data files may not format correctly if your computer is using different default delimiters (symbols used to separate values into separate cells) - a spreadsheet created in one region is sometimes misinterpreted by computers in other regions. You can change the regional settings on your computer so that the spreadsheet can be interpreted correctly.
Provide sufficient details of any financial or non-financial competing interests to enable users to assess whether your comments might lead a reasonable person to question your impartiality. Consider the following examples, but note that this is not an exhaustive list:
Sign up for content alerts and receive a weekly or monthly email with all newly published articles
Already registered? Sign in
The email address should be the one you originally registered with F1000.
You registered with F1000 via Google, so we cannot reset your password.
To sign in, please click here.
If you still need help with your Google account password, please click here.
You registered with F1000 via Facebook, so we cannot reset your password.
To sign in, please click here.
If you still need help with your Facebook account password, please click here.
If your email address is registered with us, we will email you instructions to reset your password.
If you think you should have received this email but it has not arrived, please check your spam filters and/or contact for further assistance.
Comments on this article Comments (0)